

Build & Deploy Application
Explore RUM in Splunk
In this step, you’ll observe how RUM sessions appear add context to requests and how they appear in Splunk Observability Cloud. This is the “problem state” of how the APM issue reflects in RUM.
The RUM Request Path #
- Open http://(your-instance-url):30080
- Open browser DevTools → Network tab
- Place 3–5 orders for different products
- In the Network tab, inspect a
POST /api/ordersrequest - Confirm the request includes a
traceparentheader (injected by Splunk RUM)
Example header:
traceparent: 00-4bf92f3577b34da6a3ce929d0e0e4736-00f067aa0ba902b7-01The browser appears to be correcly instrumented and processing requests as expected.
Note
Observe in Splunk RUM #
- Navigate to Digital Experience → Session Search
- Filter Environment →
workshop-$INSTANCE - Open a recent session
- Locate
fetchrequests - You will only see an APM correlation link for ‘api/catalog`.
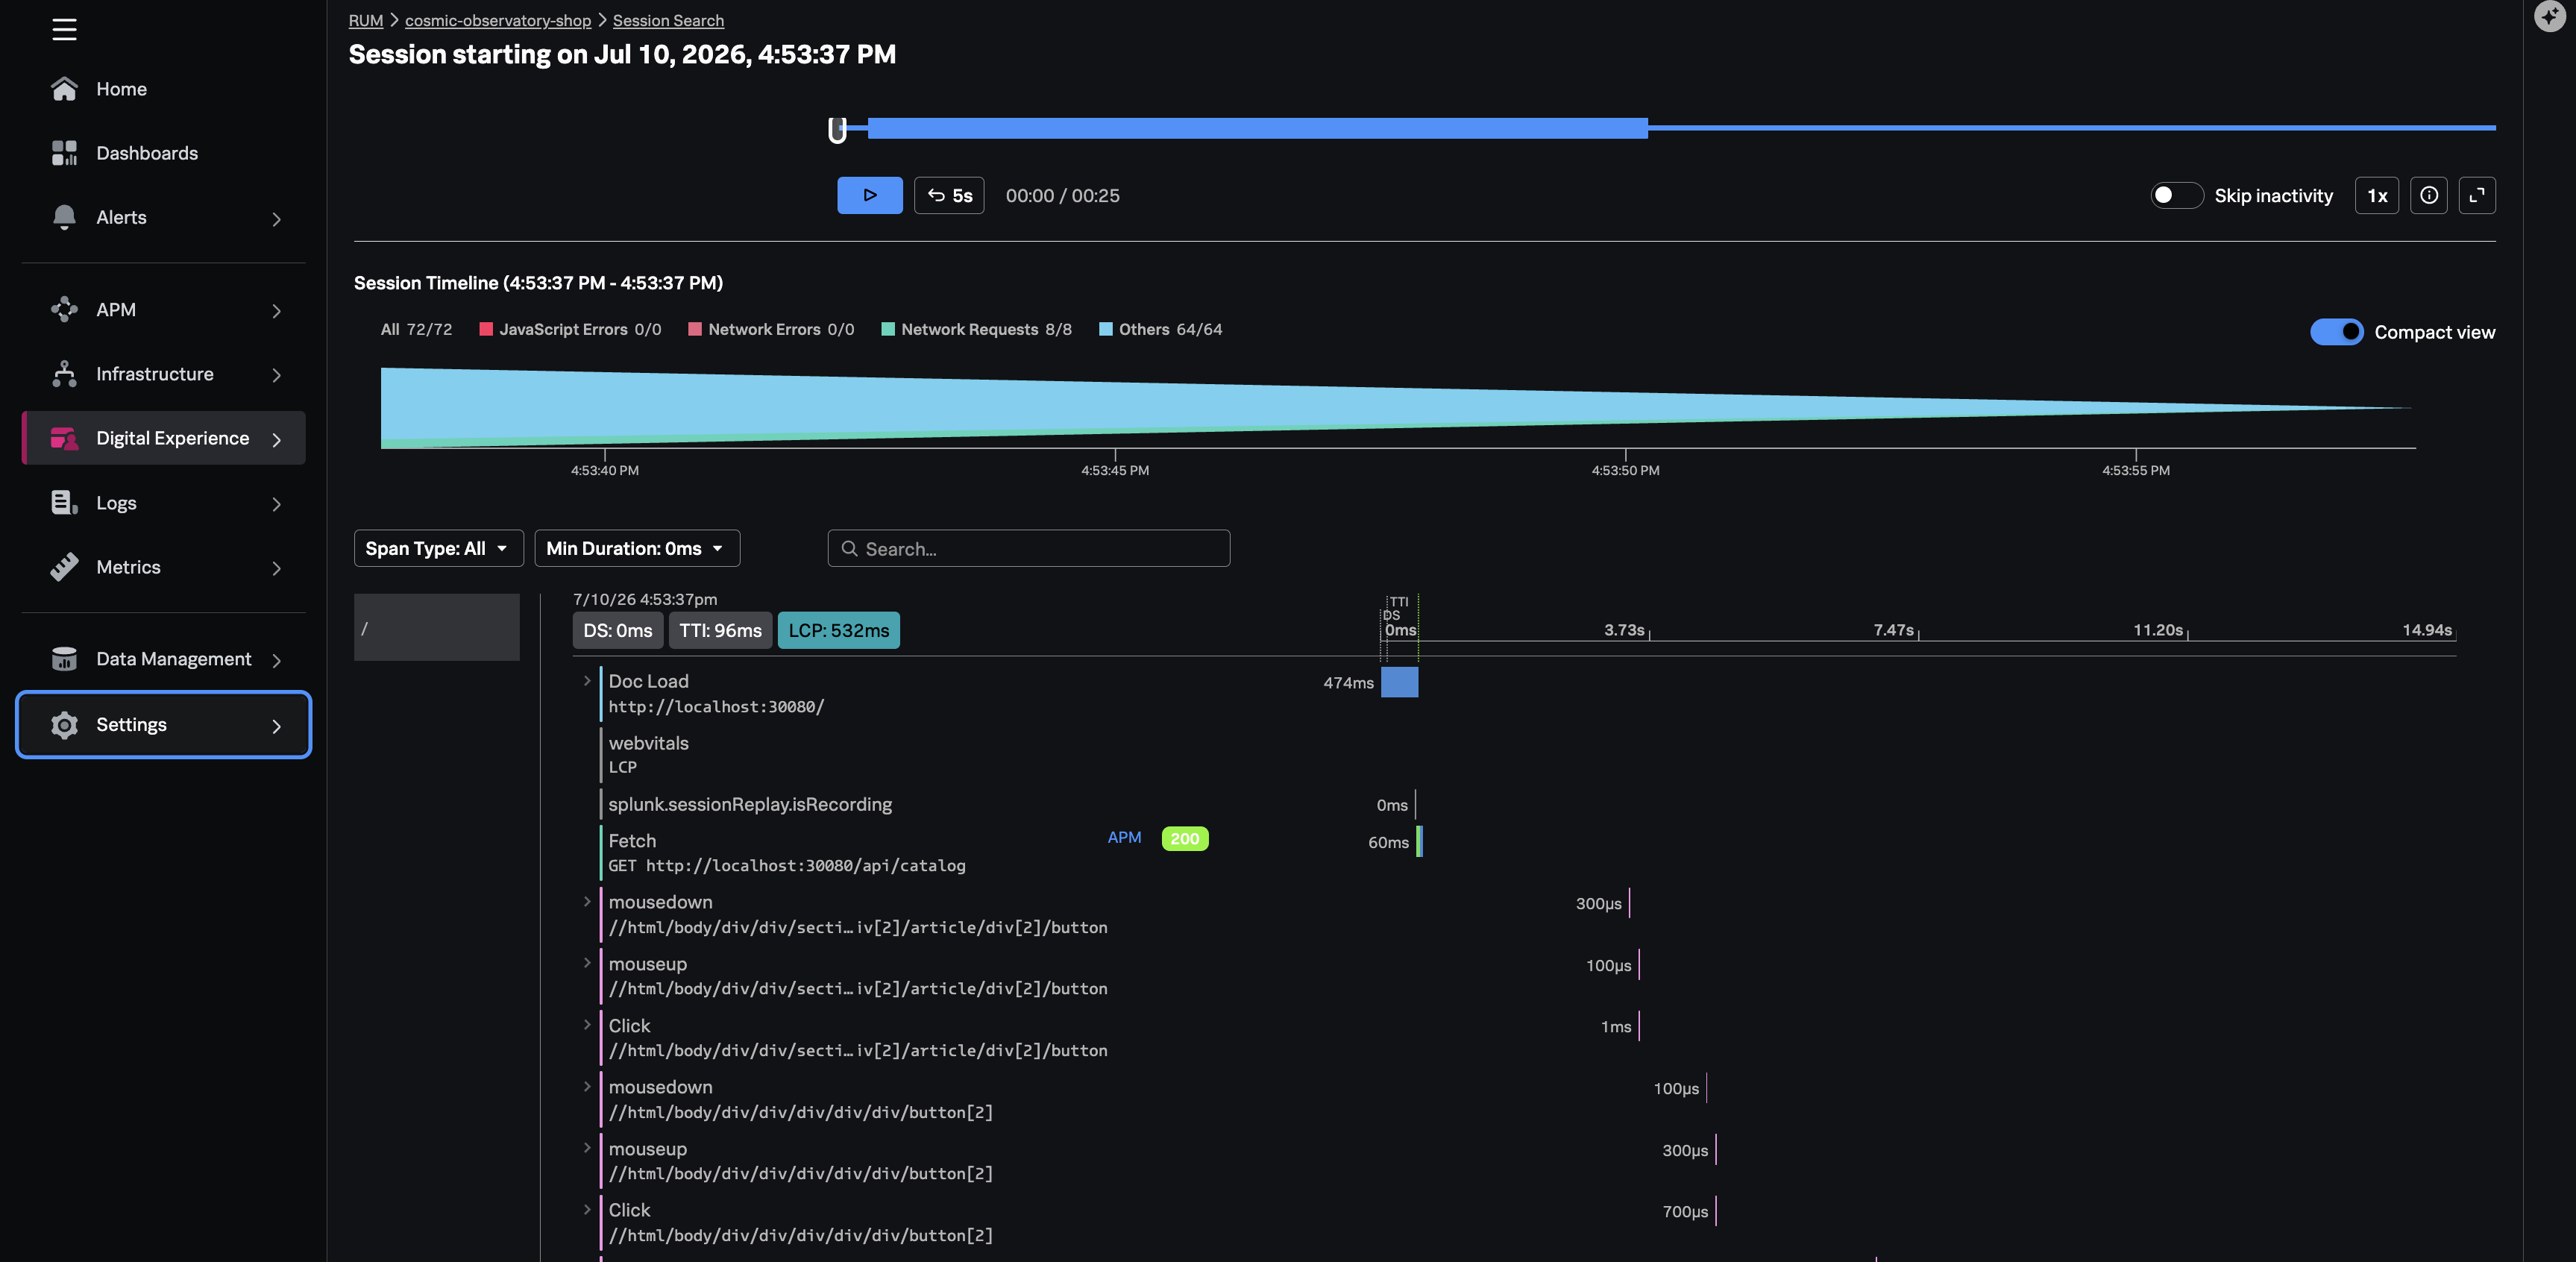
Note
The catalog path never touches the edge gateway - the catalog-api is called directly from frontend-api.
Browser → frontend NGINX → frontend-api → catalog-api
So, even with propagation breaking elsewhere, Splunk can still correlate the GET /api/catalog fetch to backend APM via Server-Timing + the frontend-api trace that includes the catalog call.
Check-Point #
Both RUM and APM show a Broken state:
We are currently not seeing APM correlation links for the other services. This is because RUM cannot link to the backend APM traces because the gateway stripped the traceparent header before it reached storefront-api. Splunk RUM relies on Server-Timing and matching trace IDs for correlation.
In the next steps, we will resolve these issues.