Fix NGINX Propagation
Explore RUM in Splunk
In this step, you’ll observe how RUM sessions appear add context to requests and how they appear in Splunk Observability Cloud. This is the “problem state” of how the APM issue reflects in RUM.
The RUM Request Path #
Note
Allow 2–5 minutes after deploy for RUM data to appear..
- Navigate yo the app in the browser http://localhost:30080
- Refresh the browser session using Command + Shift + R
- Open browser DevTools → Network tab
- Place an order
- In the Network tab, inspect a
POST /api/ordersrequest - Confirm the request includes a
traceparentheader (injected by Splunk RUM)
Example header:
text
traceparent: 00-2476afefb1c010fa965d0e96d09c76c4-03d3d28b2b0f6290-01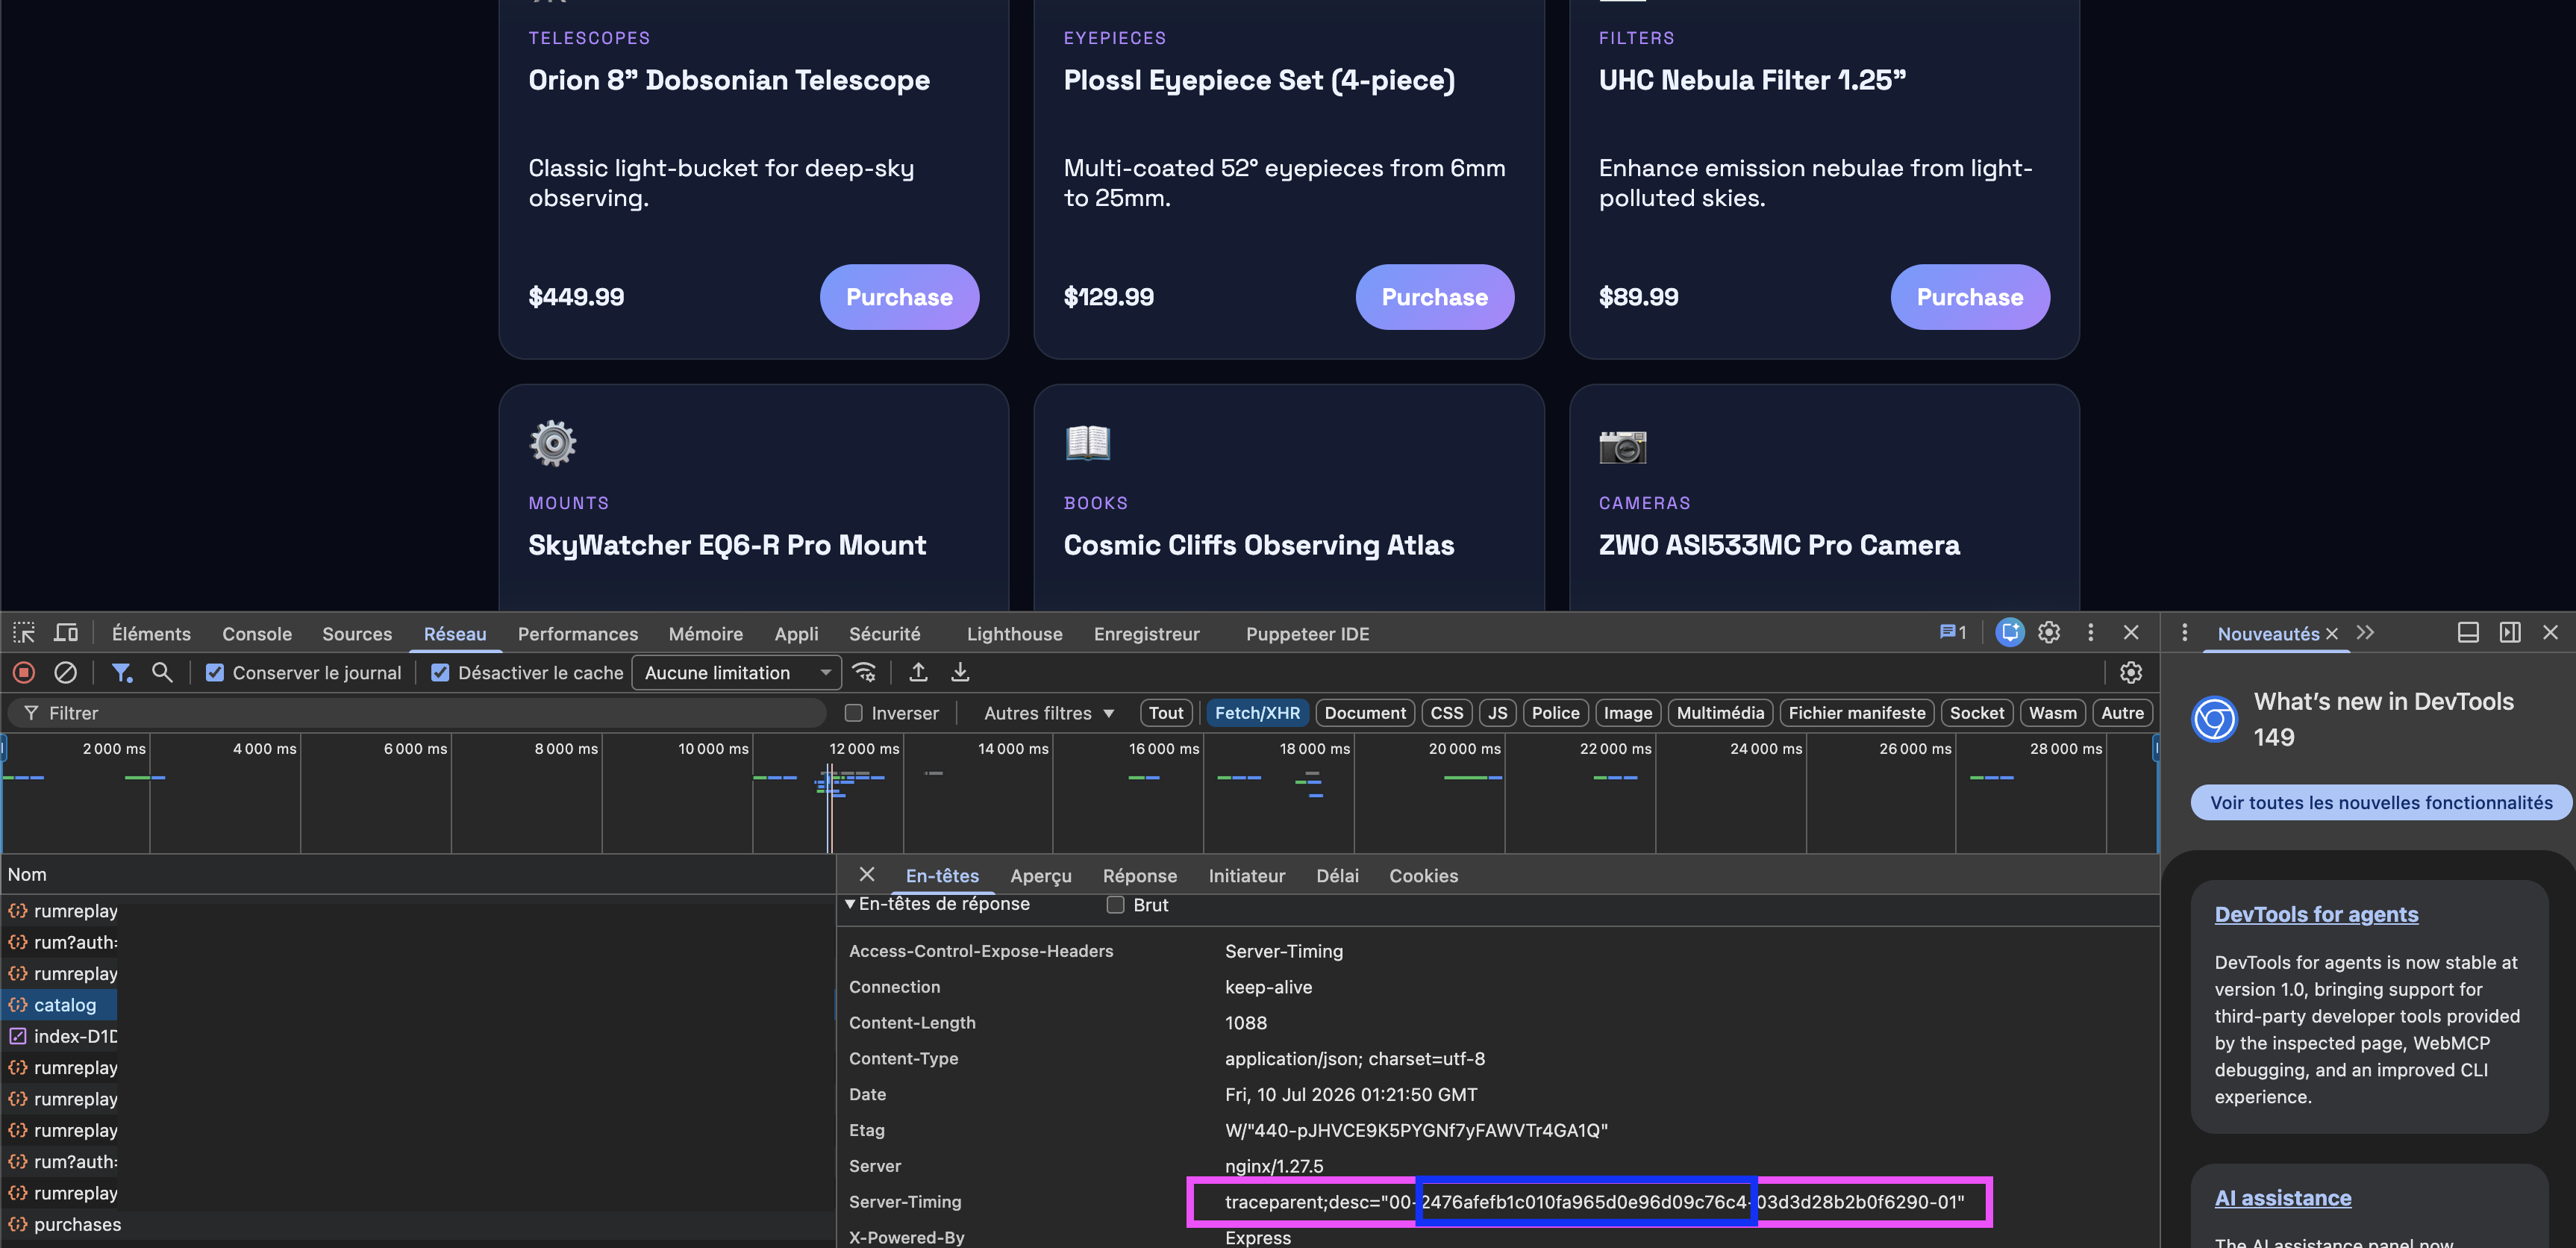
Note
Copy the traceID value (highlighted in blue) - we will use this in the next step.
The browser appears to be correcly instrumented and processing requests as expected.
Observe in Splunk RUM #
- Navigate to Digital Experience → Session Search
- Filter Environment →
workshop-$INSTANCE - Open a recent session
- Locate
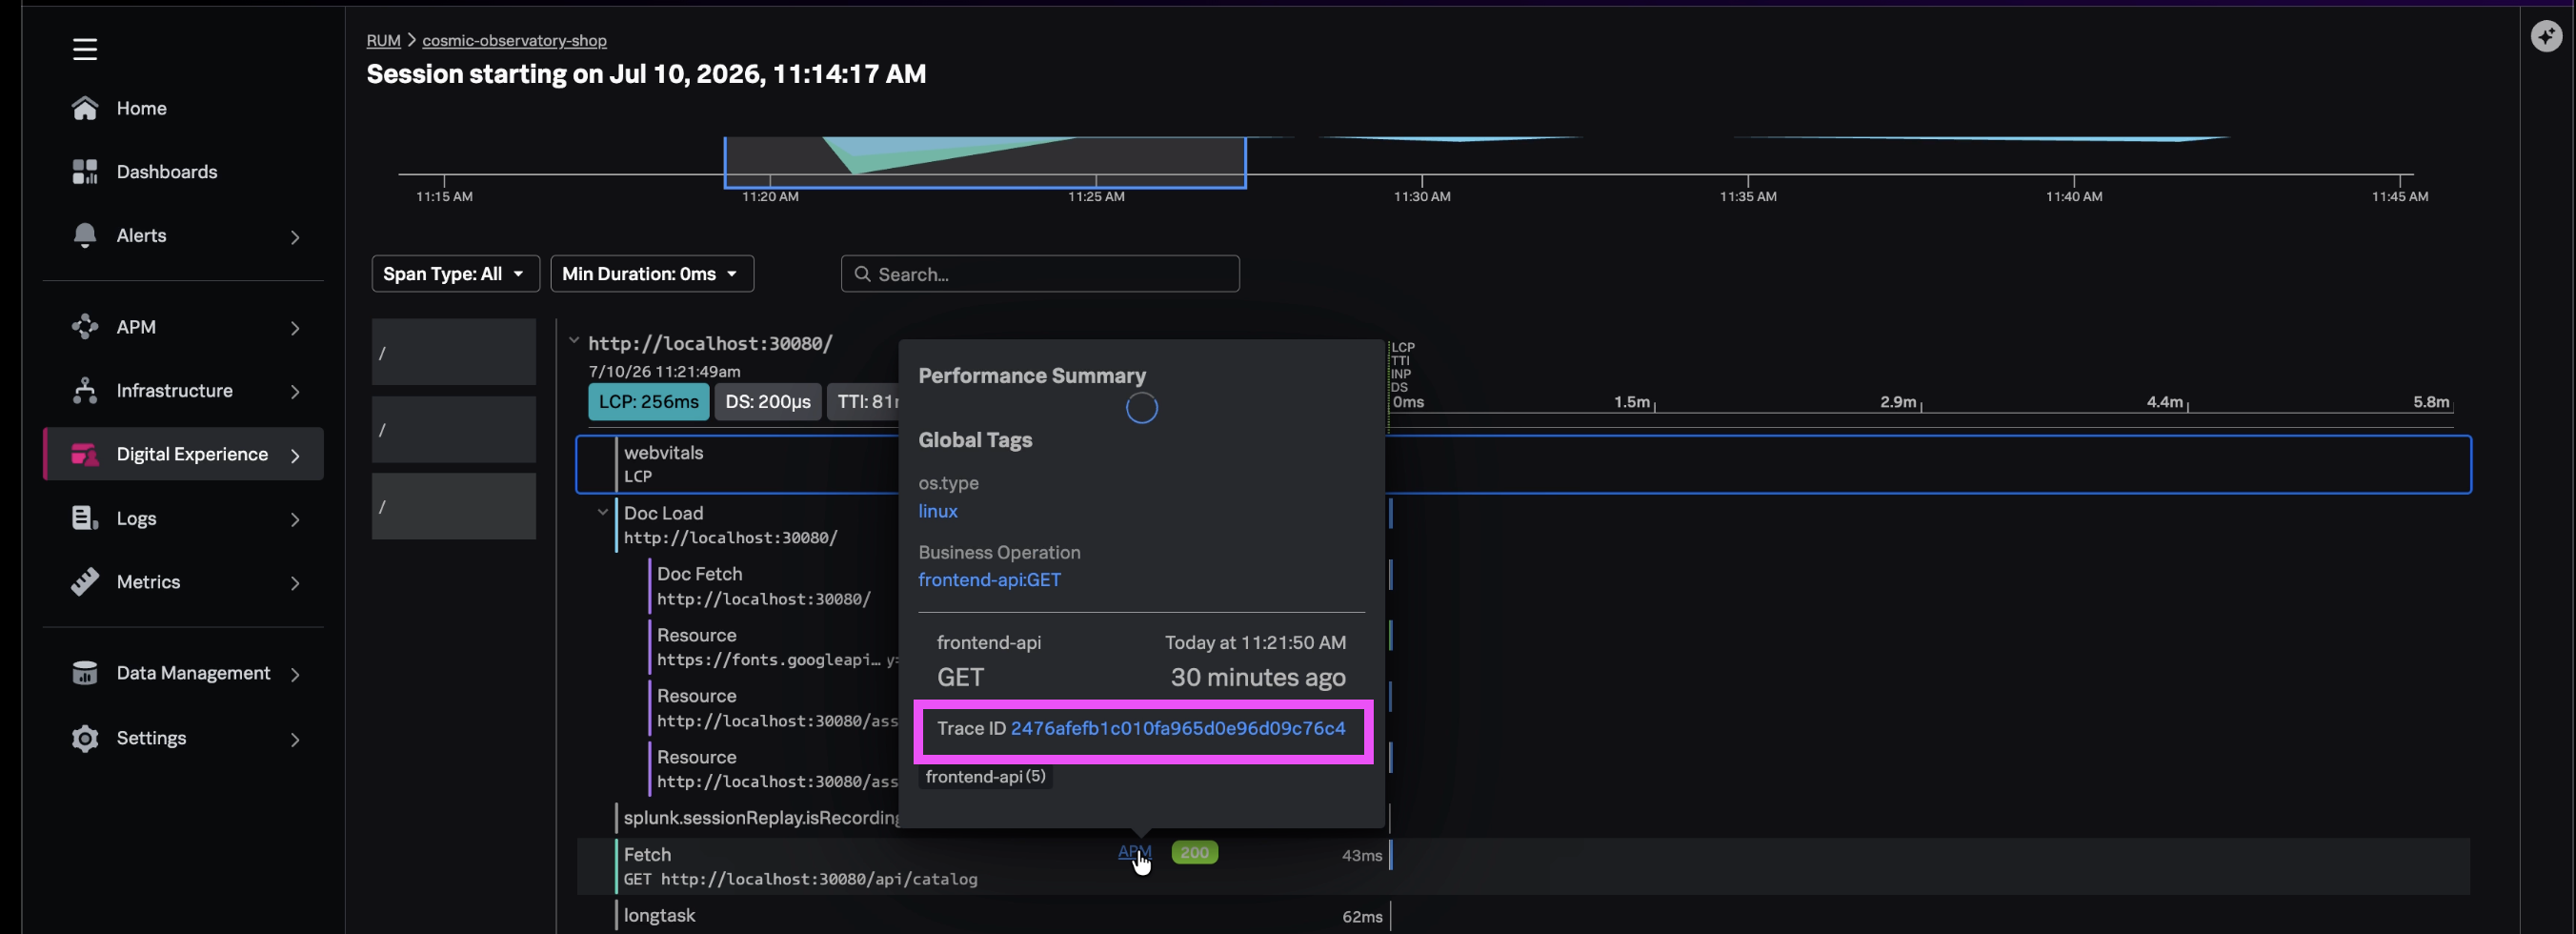
fetchrequests - You will see an APM correlation link for ‘api/catalog`.
- Hover over the hyperlink to view correlated trace details