

Fix NGINX Propagation
Explore APM in Splunk
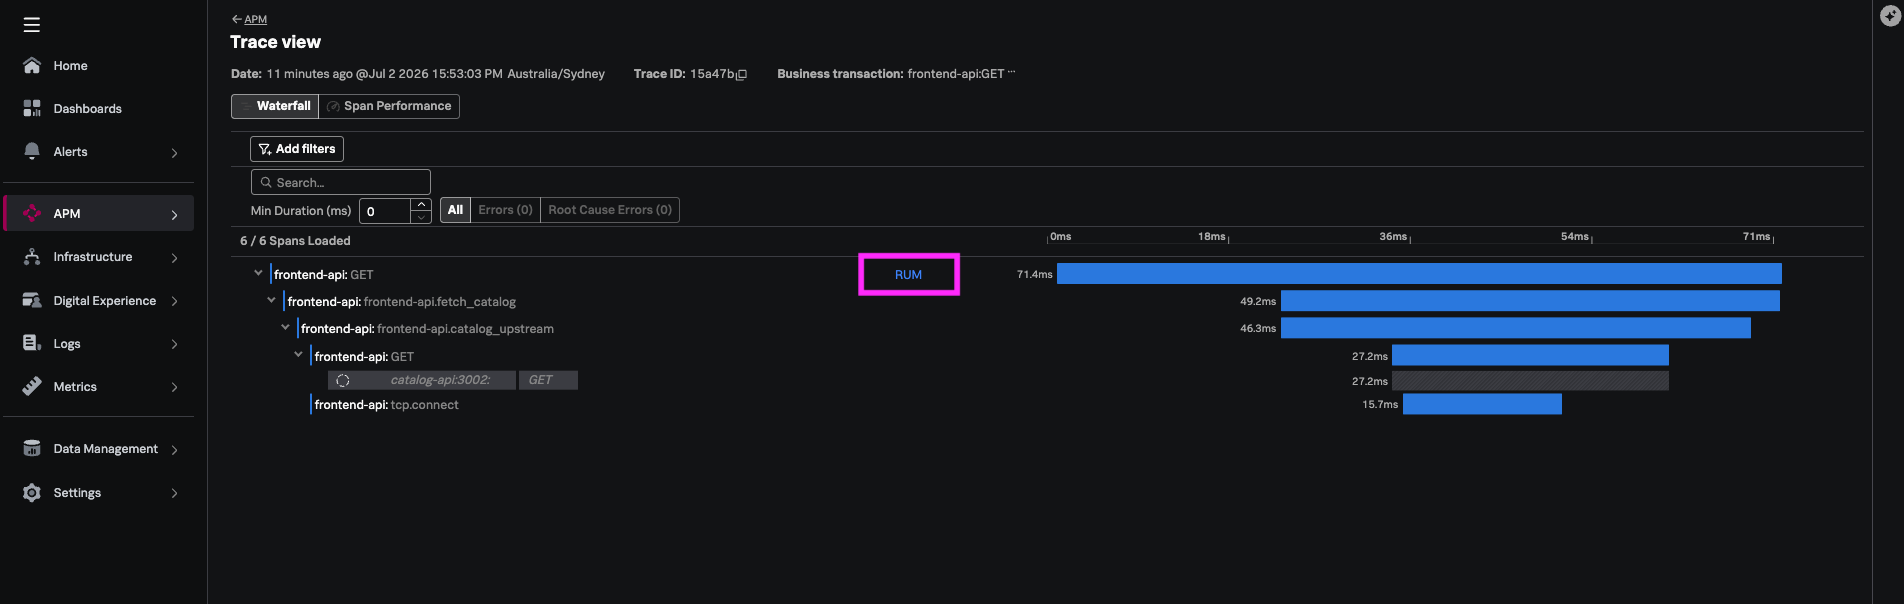
In this step, you’ll observe how the previously disconnected traces appear in Splunk Observability Cloud. This is the “Post NGINX Fix” applied state.
text
Browser (RUM span)
  → Frontend NGINX
    → Edge Gateway NGINX     ← Fix #1: trace headers Fixed
      → Order API
        → Catalog API        ← direct HTTP
        → Payment Gateway    ← break #2: strips headers to payment-api
          → Payment API
            → RabbitMQ       ← break #3: no trace context in message
              → Fulfillment Worker  ← orphan root trace
Check Splunk #
- Navigate to APM → Trace Analyzer
- Paste the traceID value copied from the traceparent in the step before
- You will see an APM trace for ‘api/frontend-api`.
1. Confirm the trace exists #
In APM → Trace Analyzer view, paste the traceID value copied from the traceparent above.

2. Confirm partial correlation in Traces #
The frontend span should share a trace ID with the browser/RUM session after this fix.
Check-Point #
We are currently not seeing APM correlation links for the other services. This is because RUM cannot link to the backend APM traces because the gateway stripped the traceparent header before it reached storefront-api. Splunk RUM relies on Server-Timing and matching trace IDs for correlation.
In the next steps, we will resolve these issues.