E2E Correlation
Explore APM in Splunk
In this step, you will review what the full APM end-to-end correlation looks like in Splunk Observability Cloud.
Verify in Splunk APM #
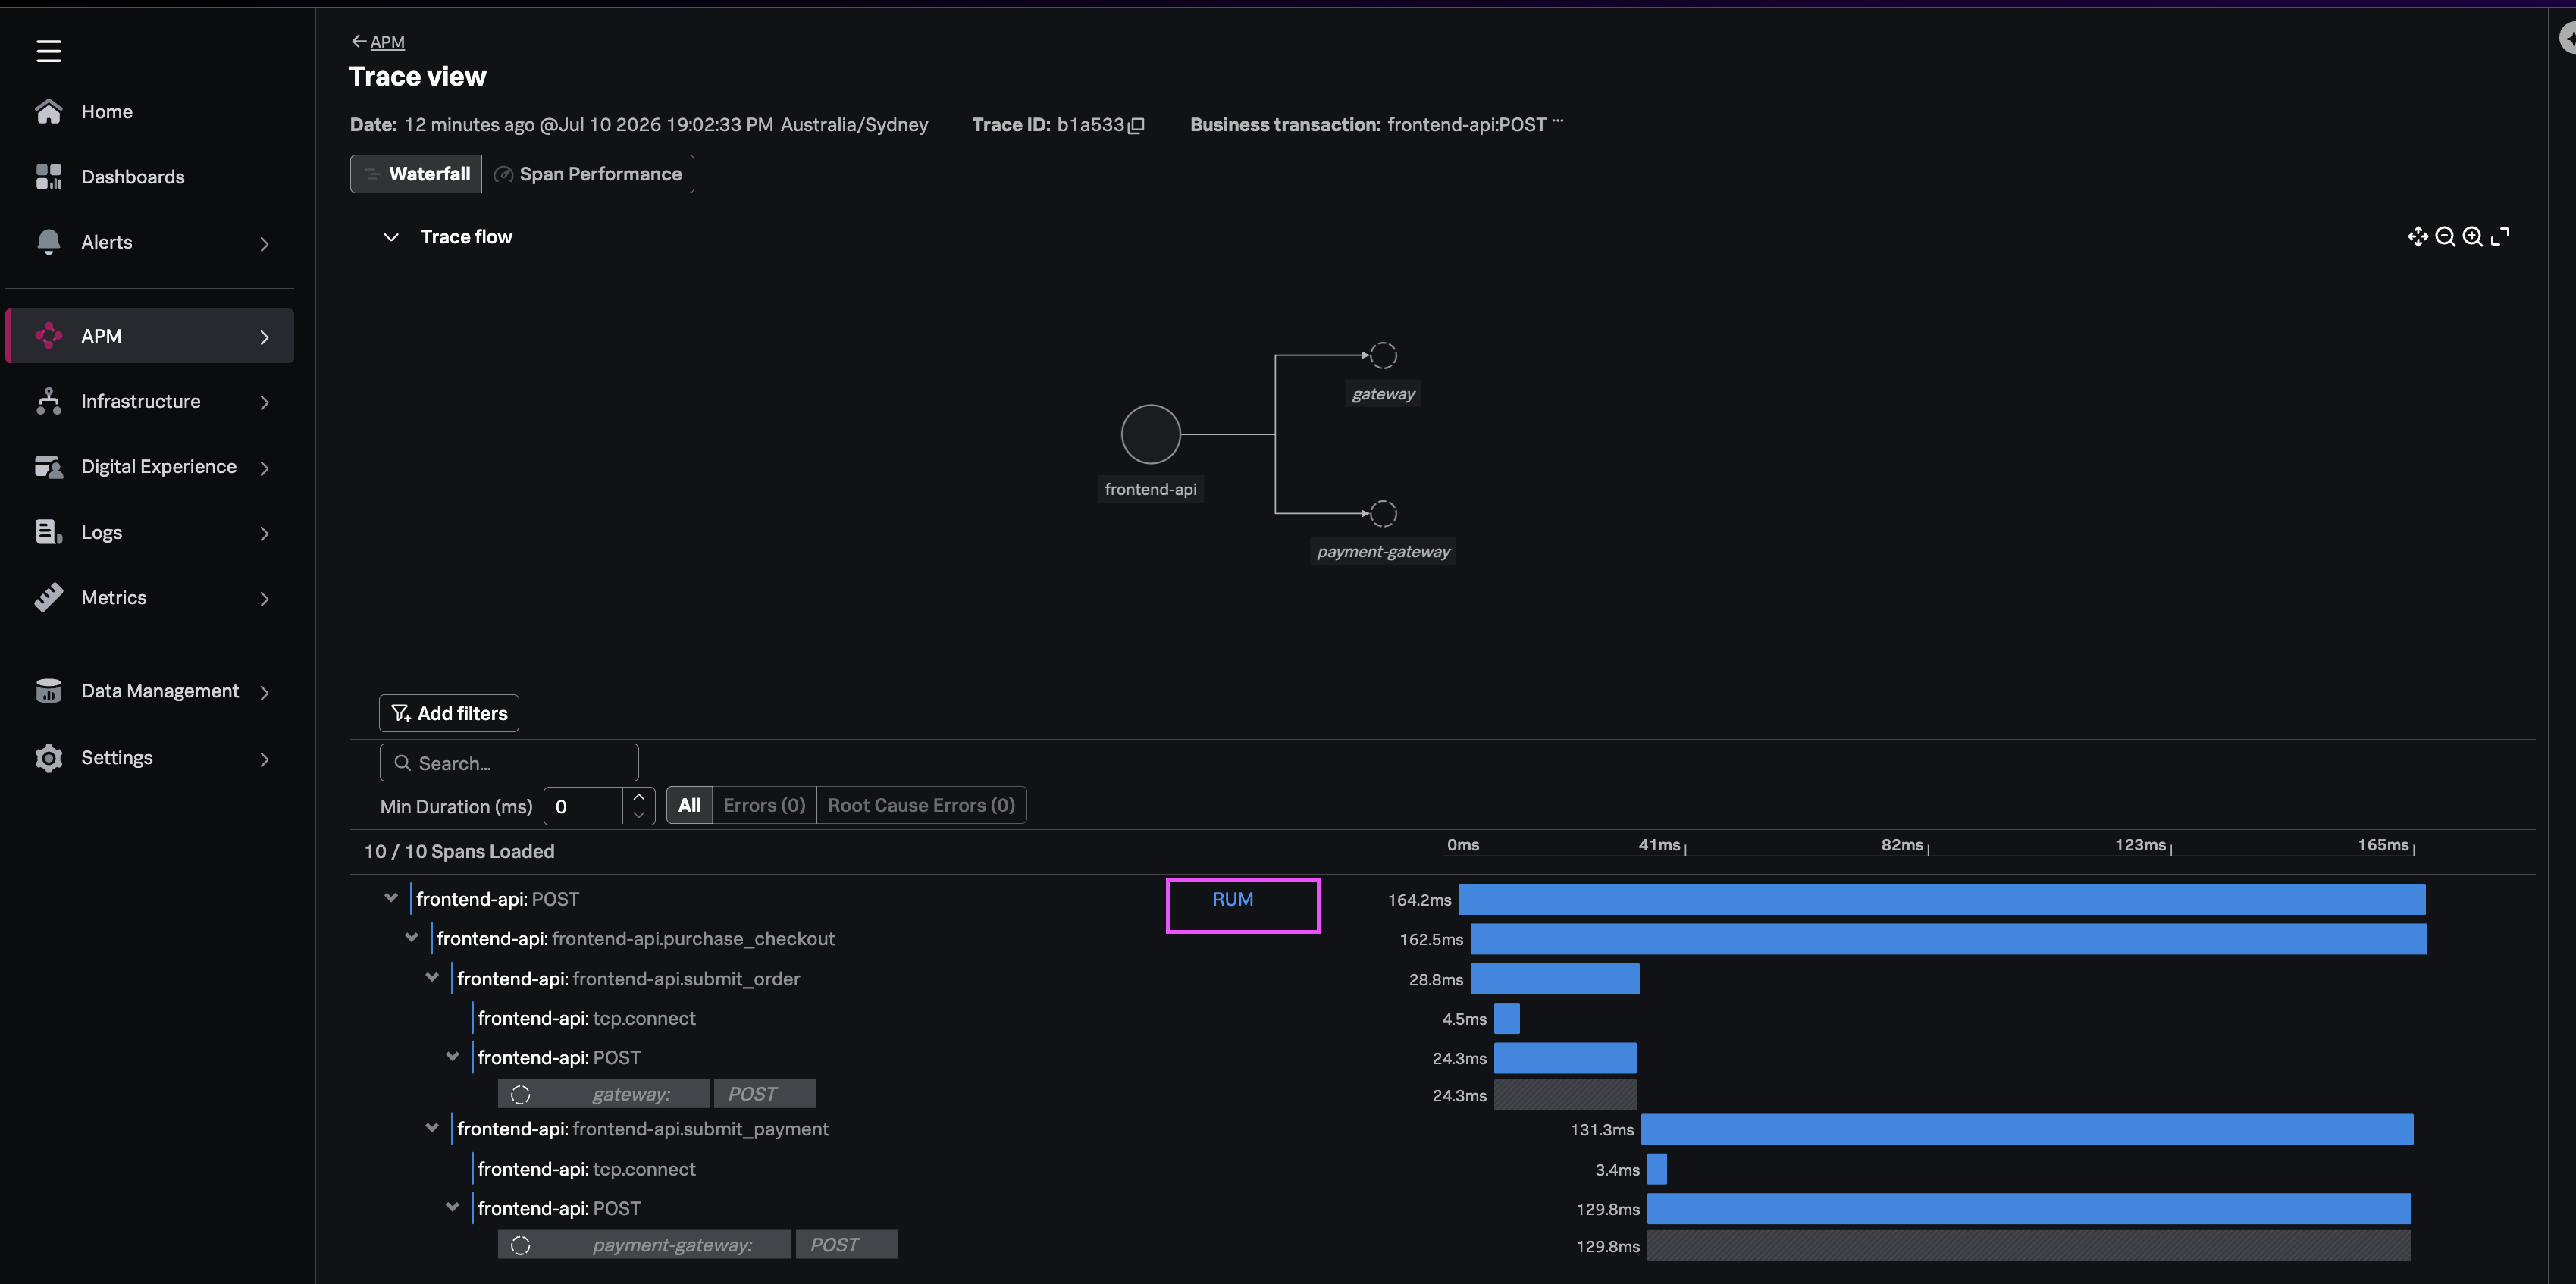
Explore Trace #
- From RUM session - Open the trace linked from RUM
OR (paste the trace ID from the
traceparentheader or completed purchase request in the UI)
You will see a RUM correlation hyperlink that will take you to the RUM session from previous step.
Explore Service Map #
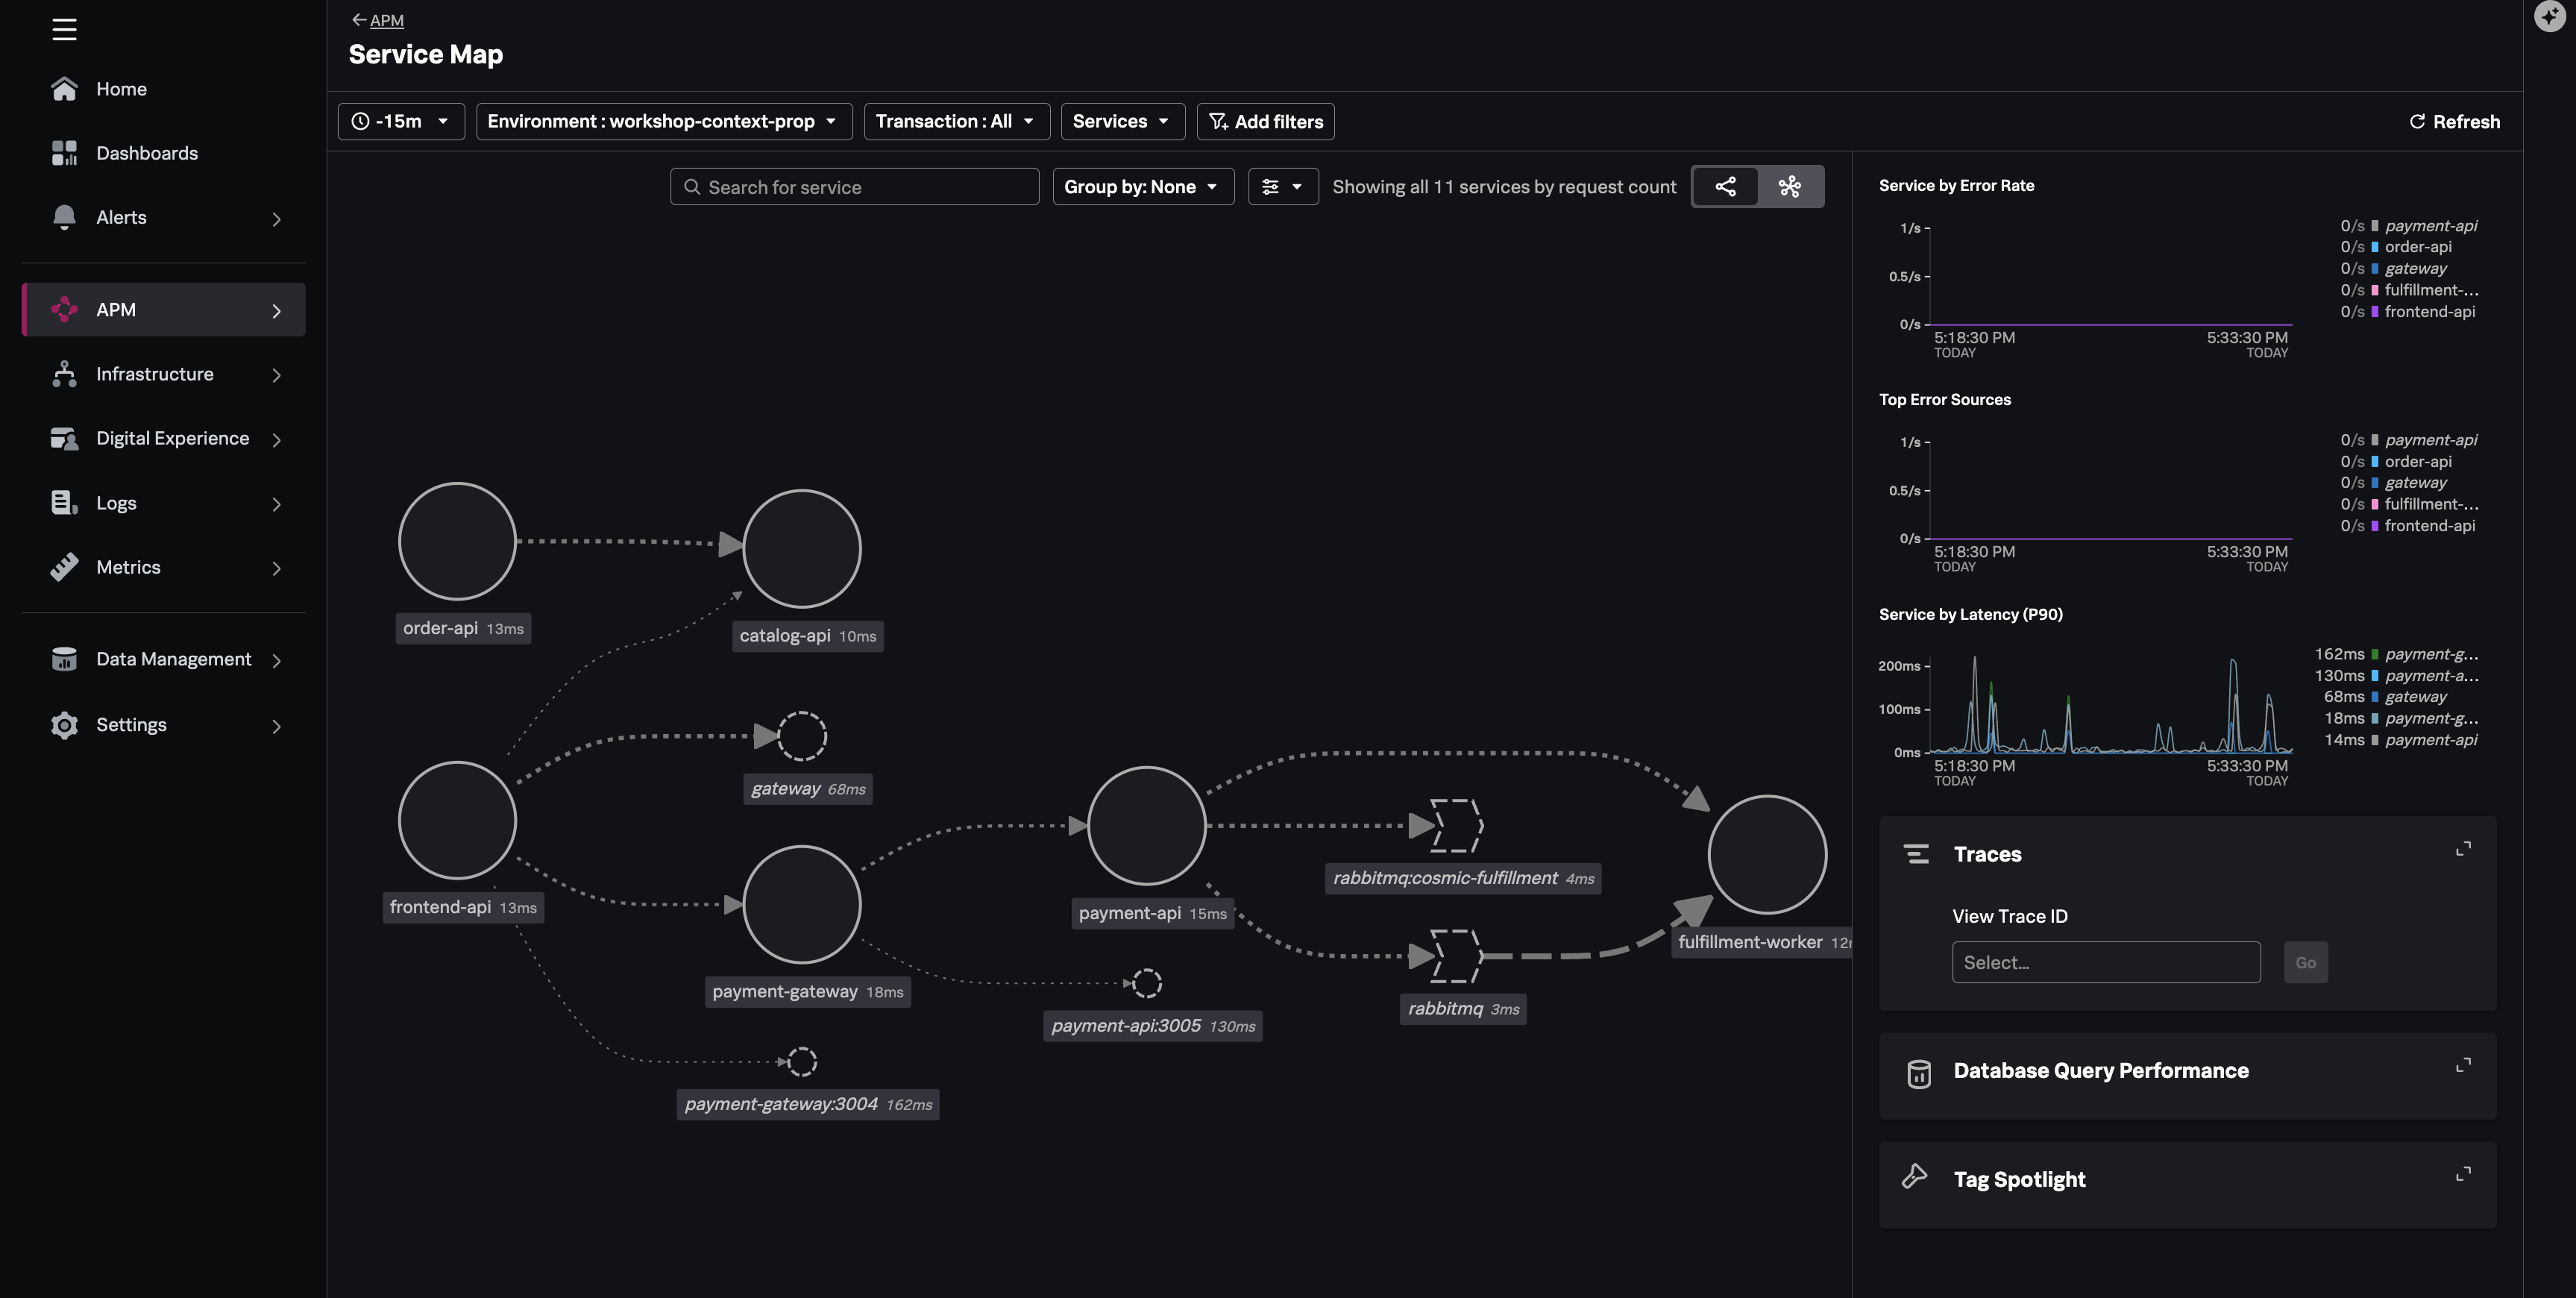
- Navigate to APM → Service Map
- Filter environment:
workshop-$INSTANCE - Confirm all services appear with traffic edges:
frontend-api→catalog-apifrontend-api→order-api(via gateway)frontend-api→payment-gateway→payment-apipayment-api→fulfillment-worker(via RabbitMQ)
This shows the expected E2E correlation across all the service and infrastructure layers.