

Distributed Tracing for AWS Lambda Functions
Splunk APM, Lambda Functions & Traces
The Lambda functions should be generating a sizeable amount of trace data, which we would need to take a look at. Through the combination of environment variables and the OpenTelemetry Lambda layer configured in the resource definition for our Lambda functions, we should now be ready to view our functions and traces in Splunk APM.
View your Environment name in the Splunk APM Overview #
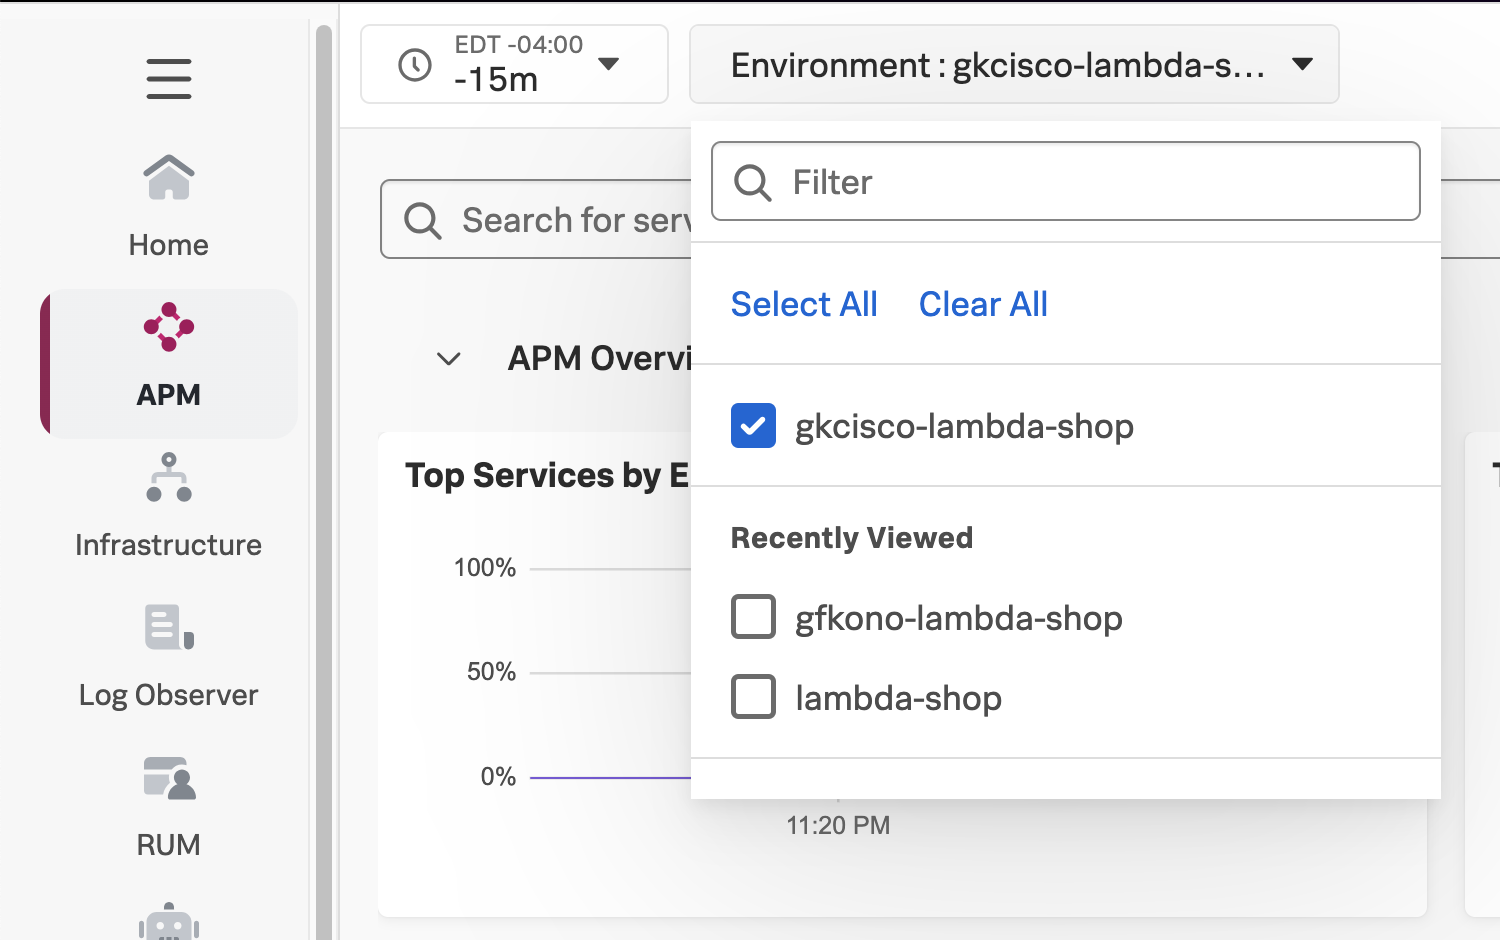
Let’s start by making sure that Splunk APM is aware of our Environment from the trace data it is receiving. This is the deployment.name we set as part of the OTEL_RESOURCE_ATTRIBUTES variable we set on our Lambda function definitions in main.tf. It was also one of the outputs from the terraform apply command we ran earlier.
In Splunk Observability Cloud:
Click on the
APMButton from the Main Menu on the left. This will take you to the Splunk APM Overview.Select your APM Environment from the
Environment:dropdown.- Your APM environment should be in the
PREFIX-lambda-shopformat, where thePREFIXis obtained from the environment variable you set in the Prerequisites section
- Your APM environment should be in the
Note
It may take a few minutes for your traces to appear in Splunk APM. Try hitting refresh on your browser until you find your environment name in the list of environments.
View your Environment’s Service Map #
Once you’ve selected your Environment name from the Environment drop down, you can take a look at the Service Map for your Lambda functions.
- Click the
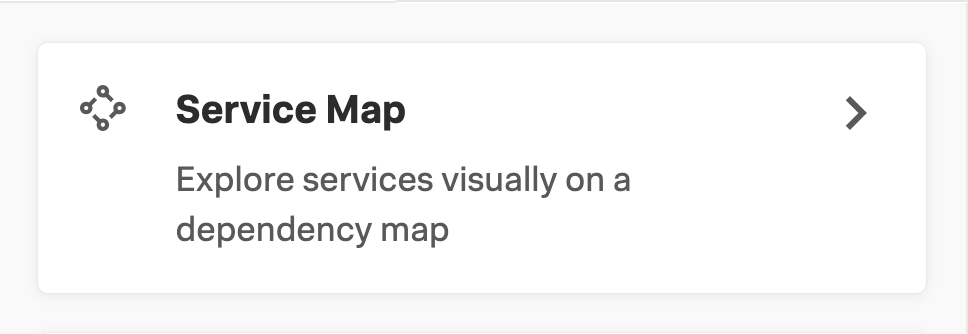
Service MapButton on the right side of the APM Overview page. This will take you to your Service Map view.
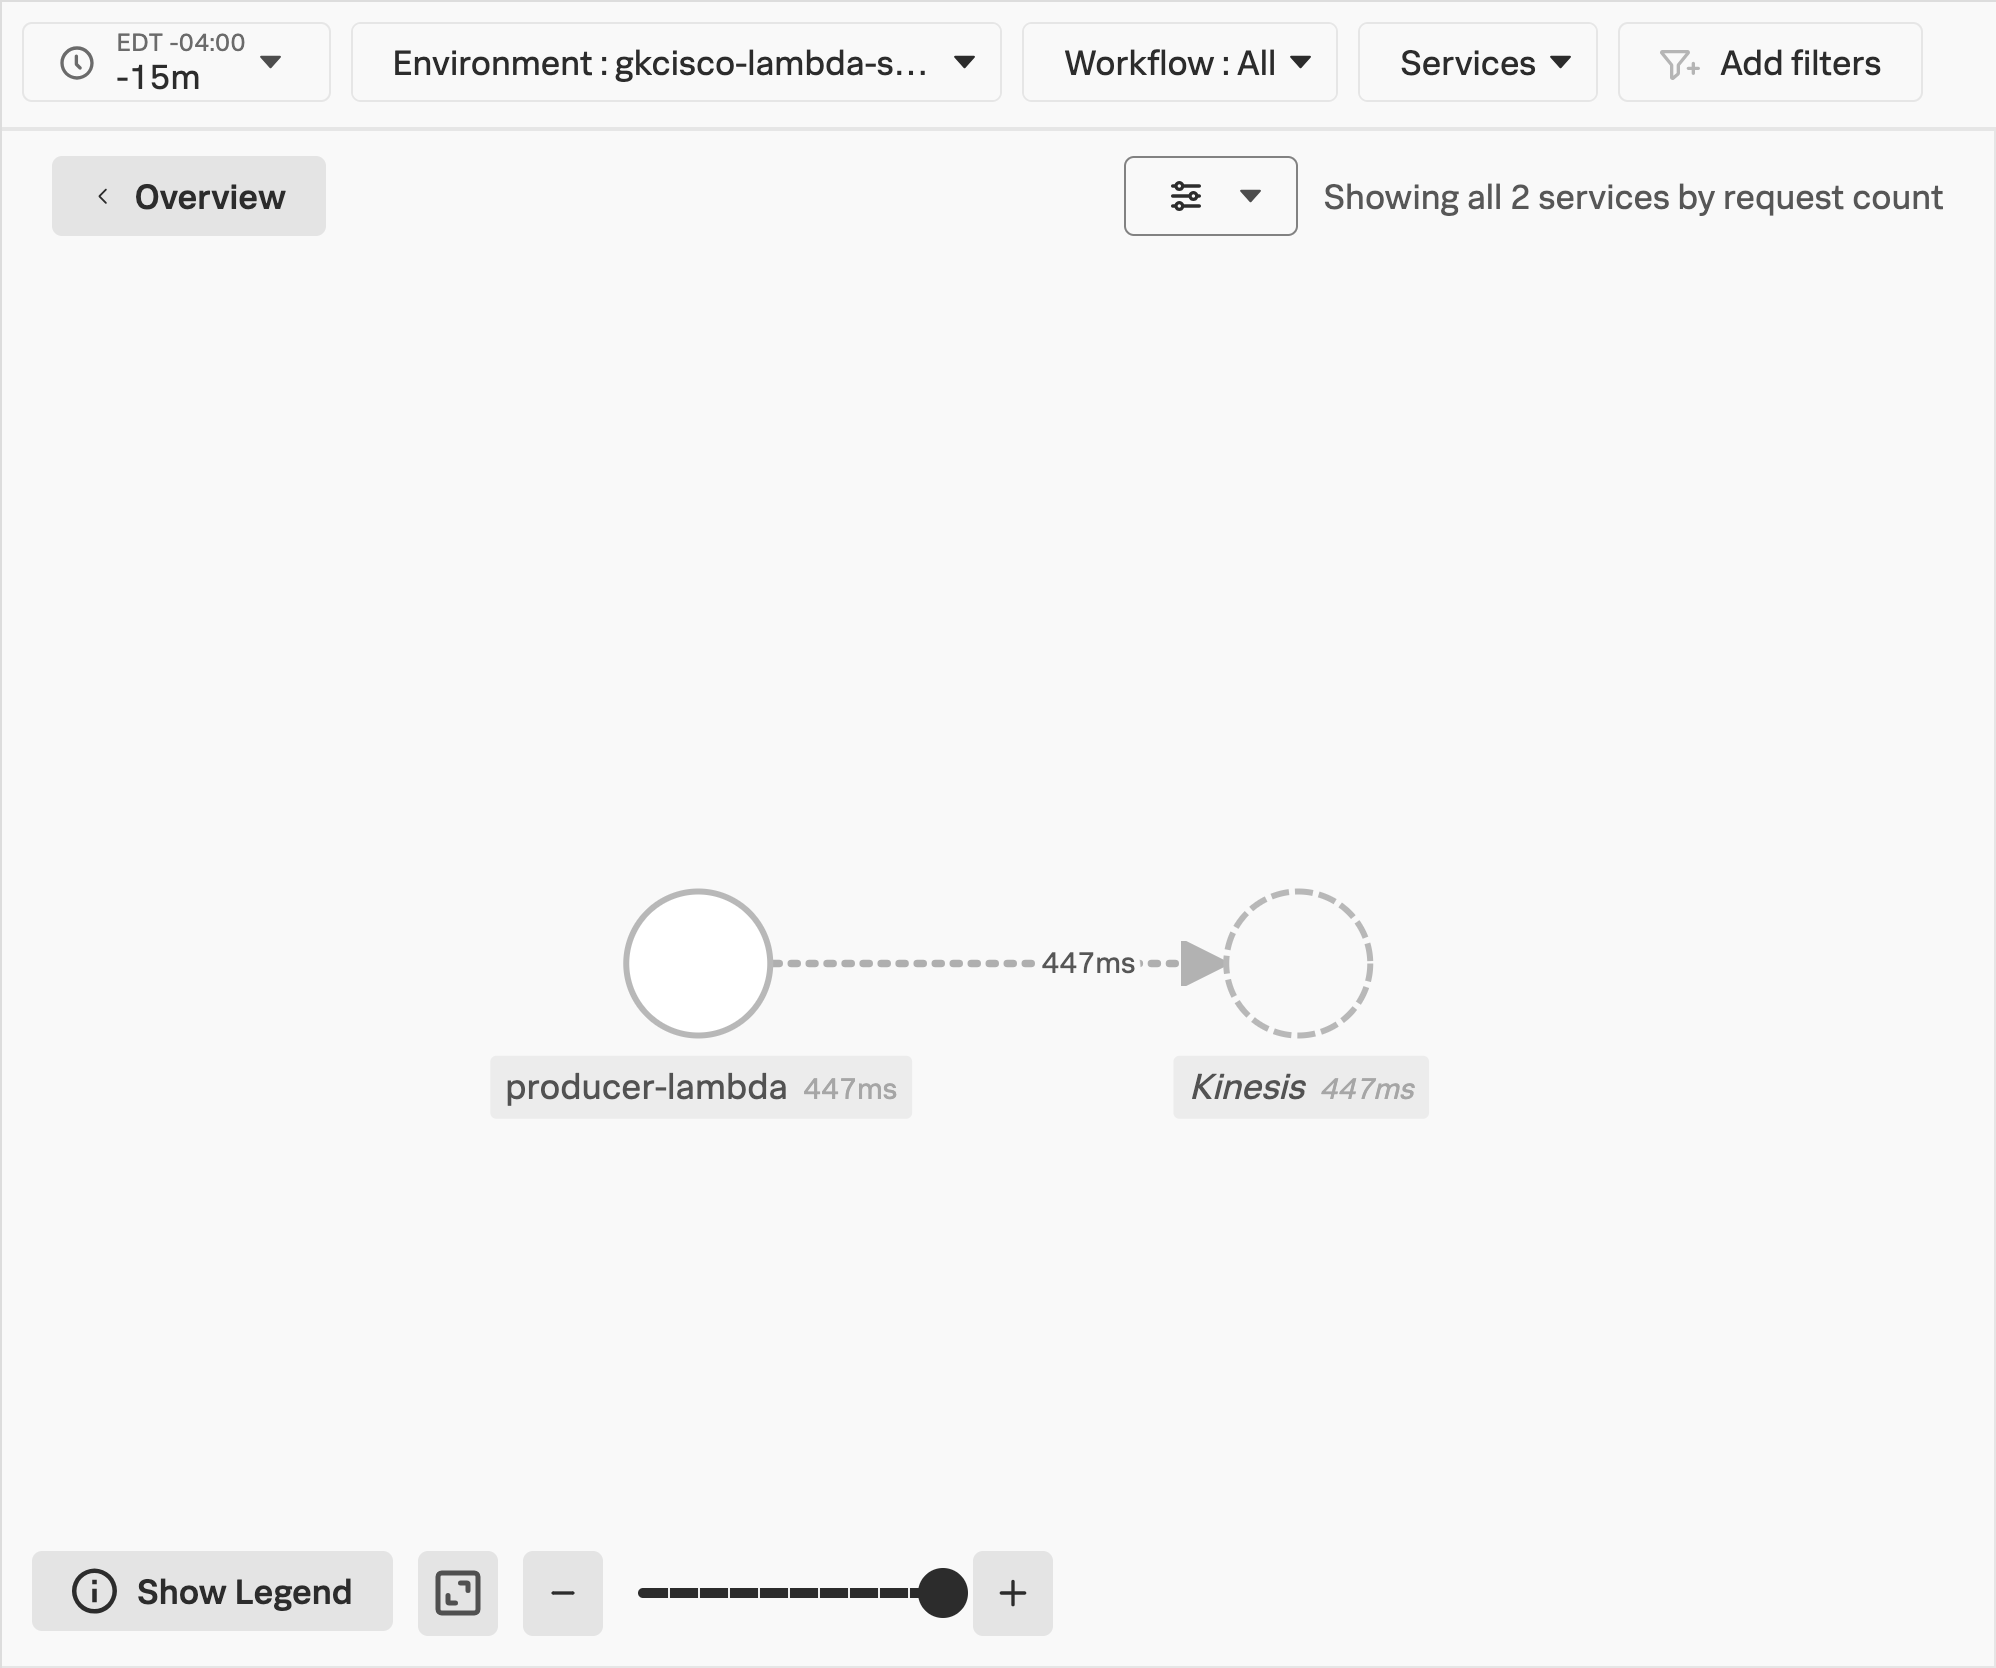
You should be able to see the producer-lambda function and the call it is making to the Kinesis Stream to put your record.
Workshop Question
What about yourconsumer-lambda function?Explore the Traces from your Lambda Functions #
- Click the
Tracesbutton to view the Trace Analyzer.
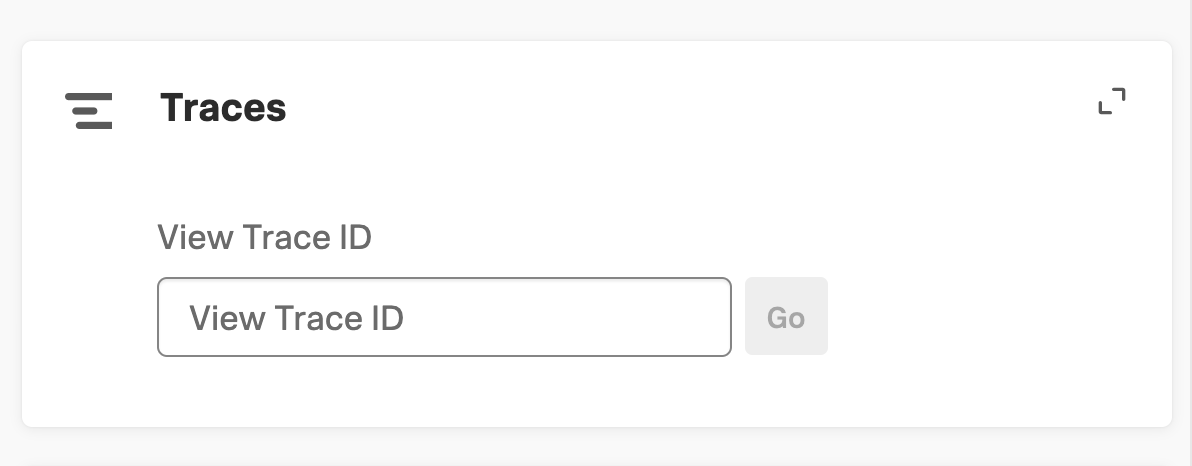
On this page, we can see the traces that have been ingested from the OpenTelemetry Lambda layer of your producer-lambda function.
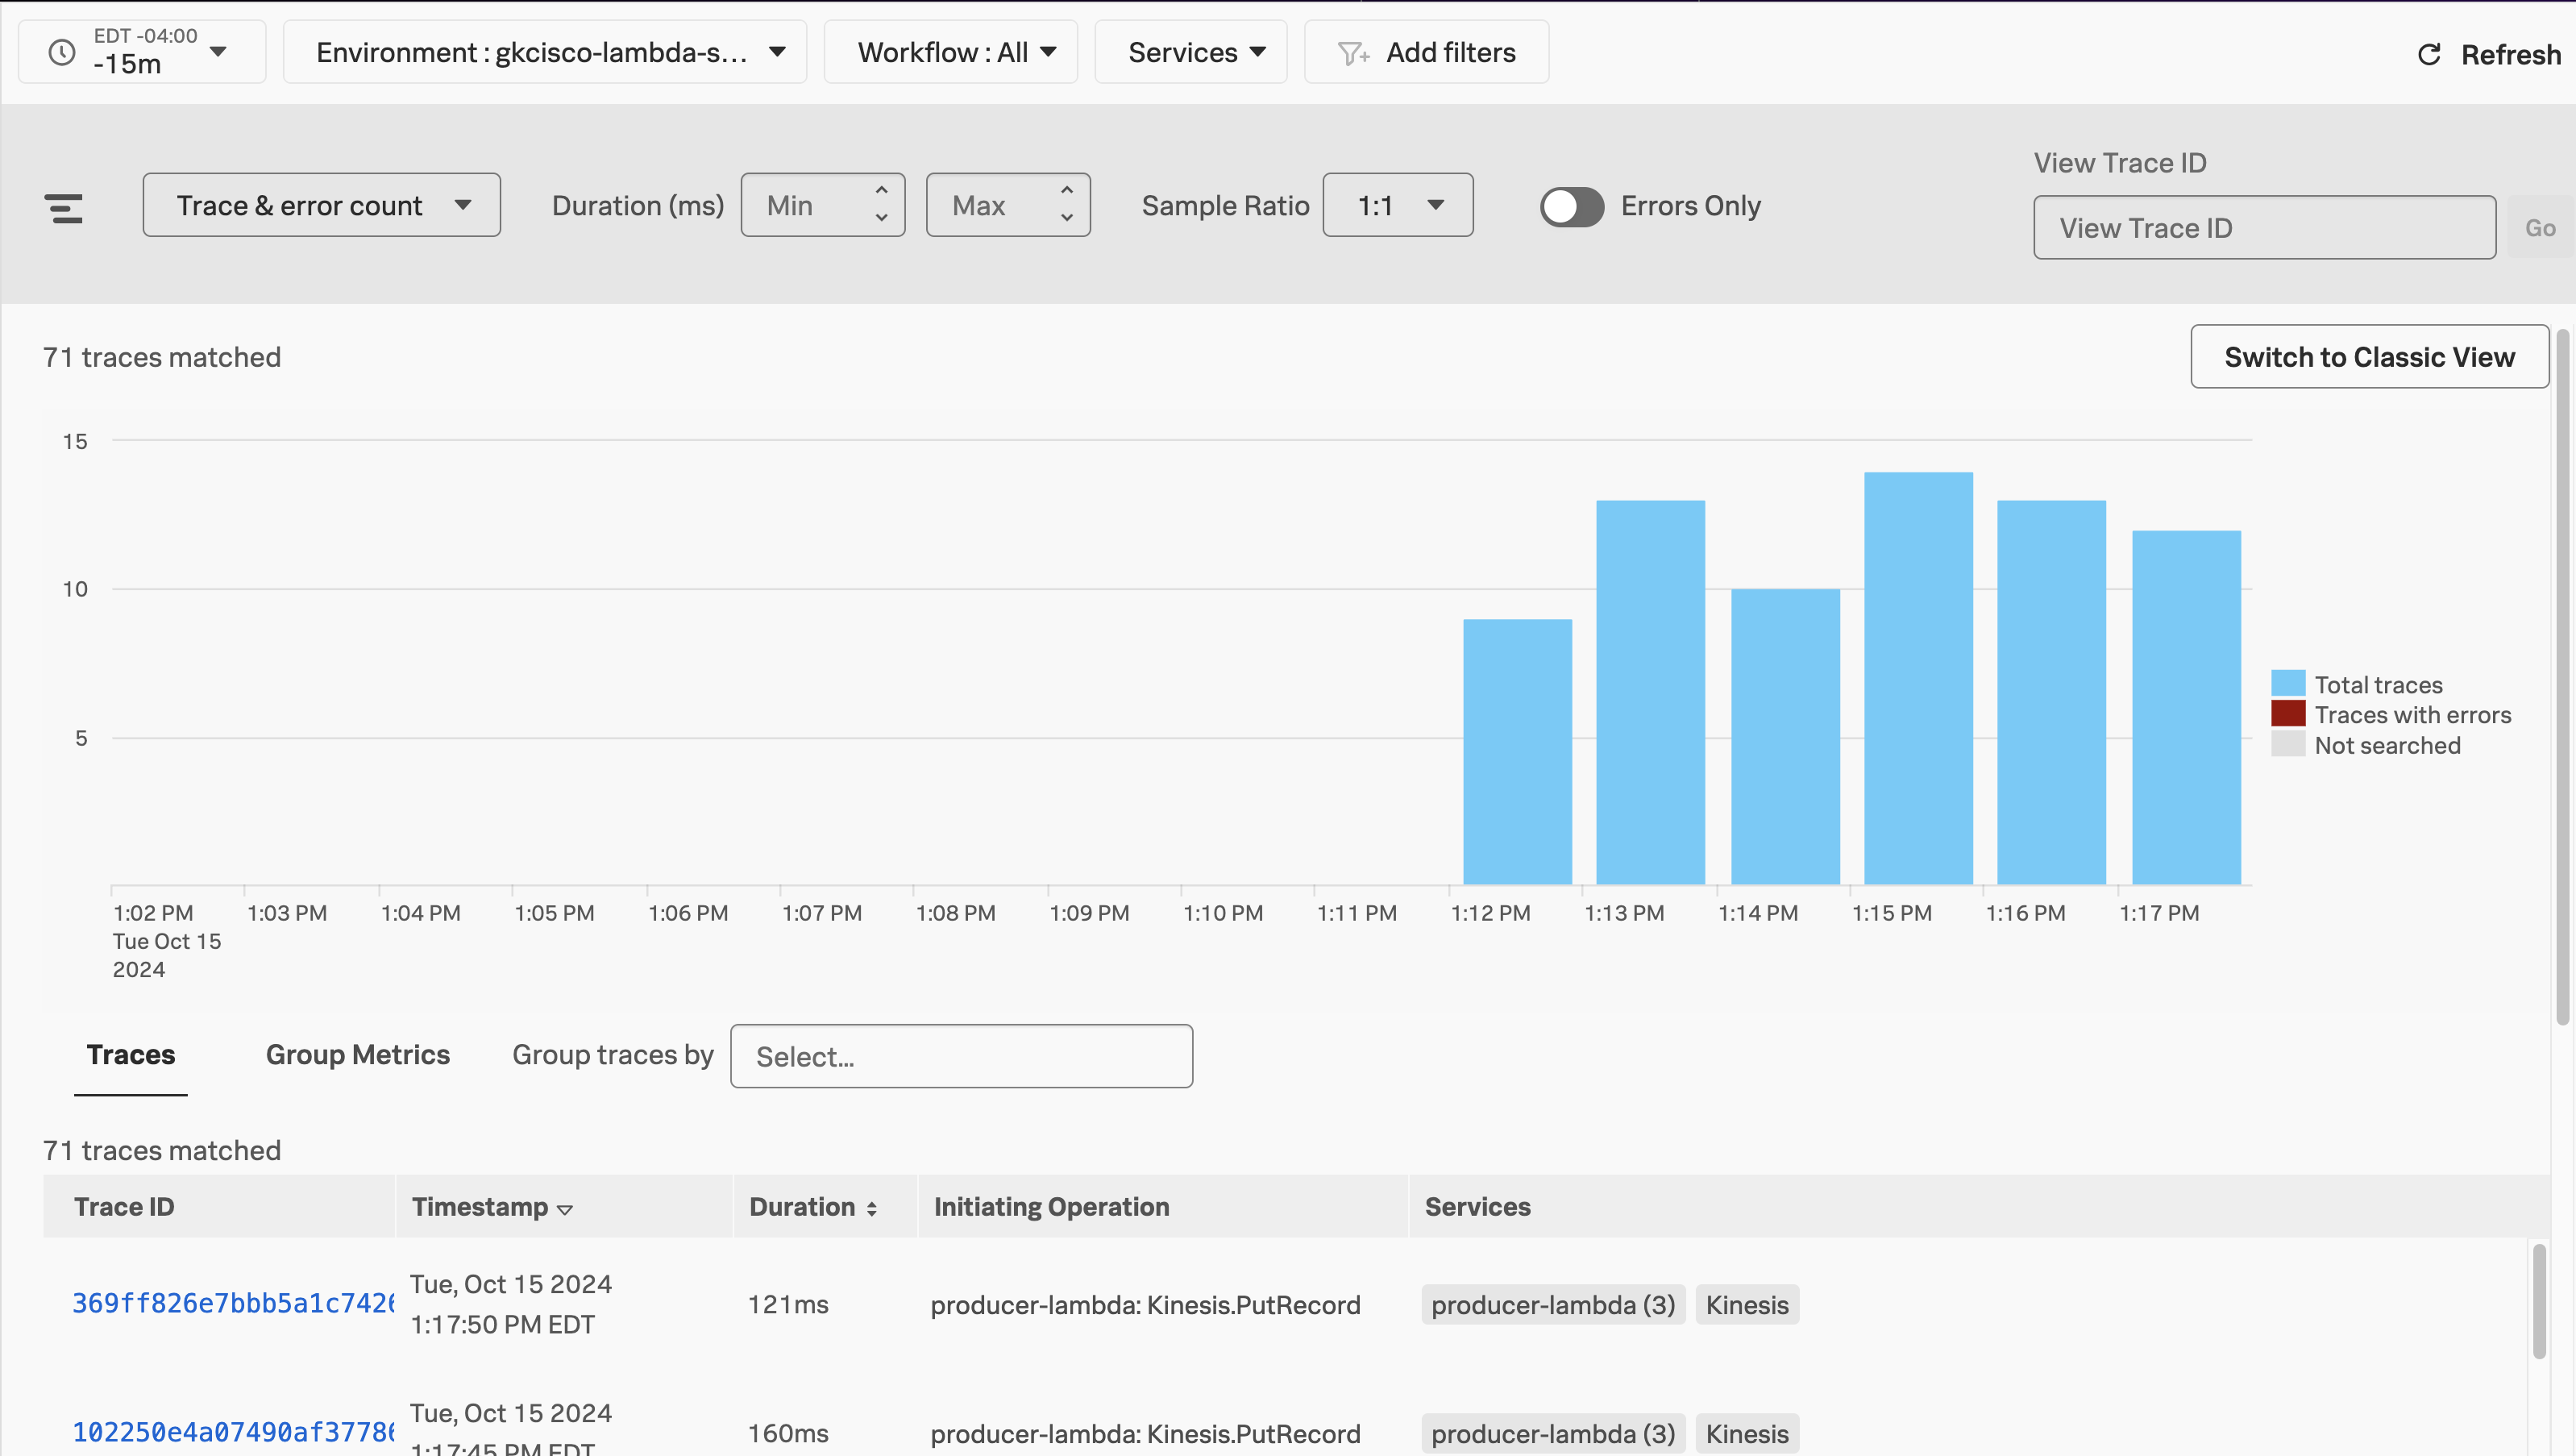
- Select a trace from the list to examine by clicking on its hyperlinked
Trace ID.
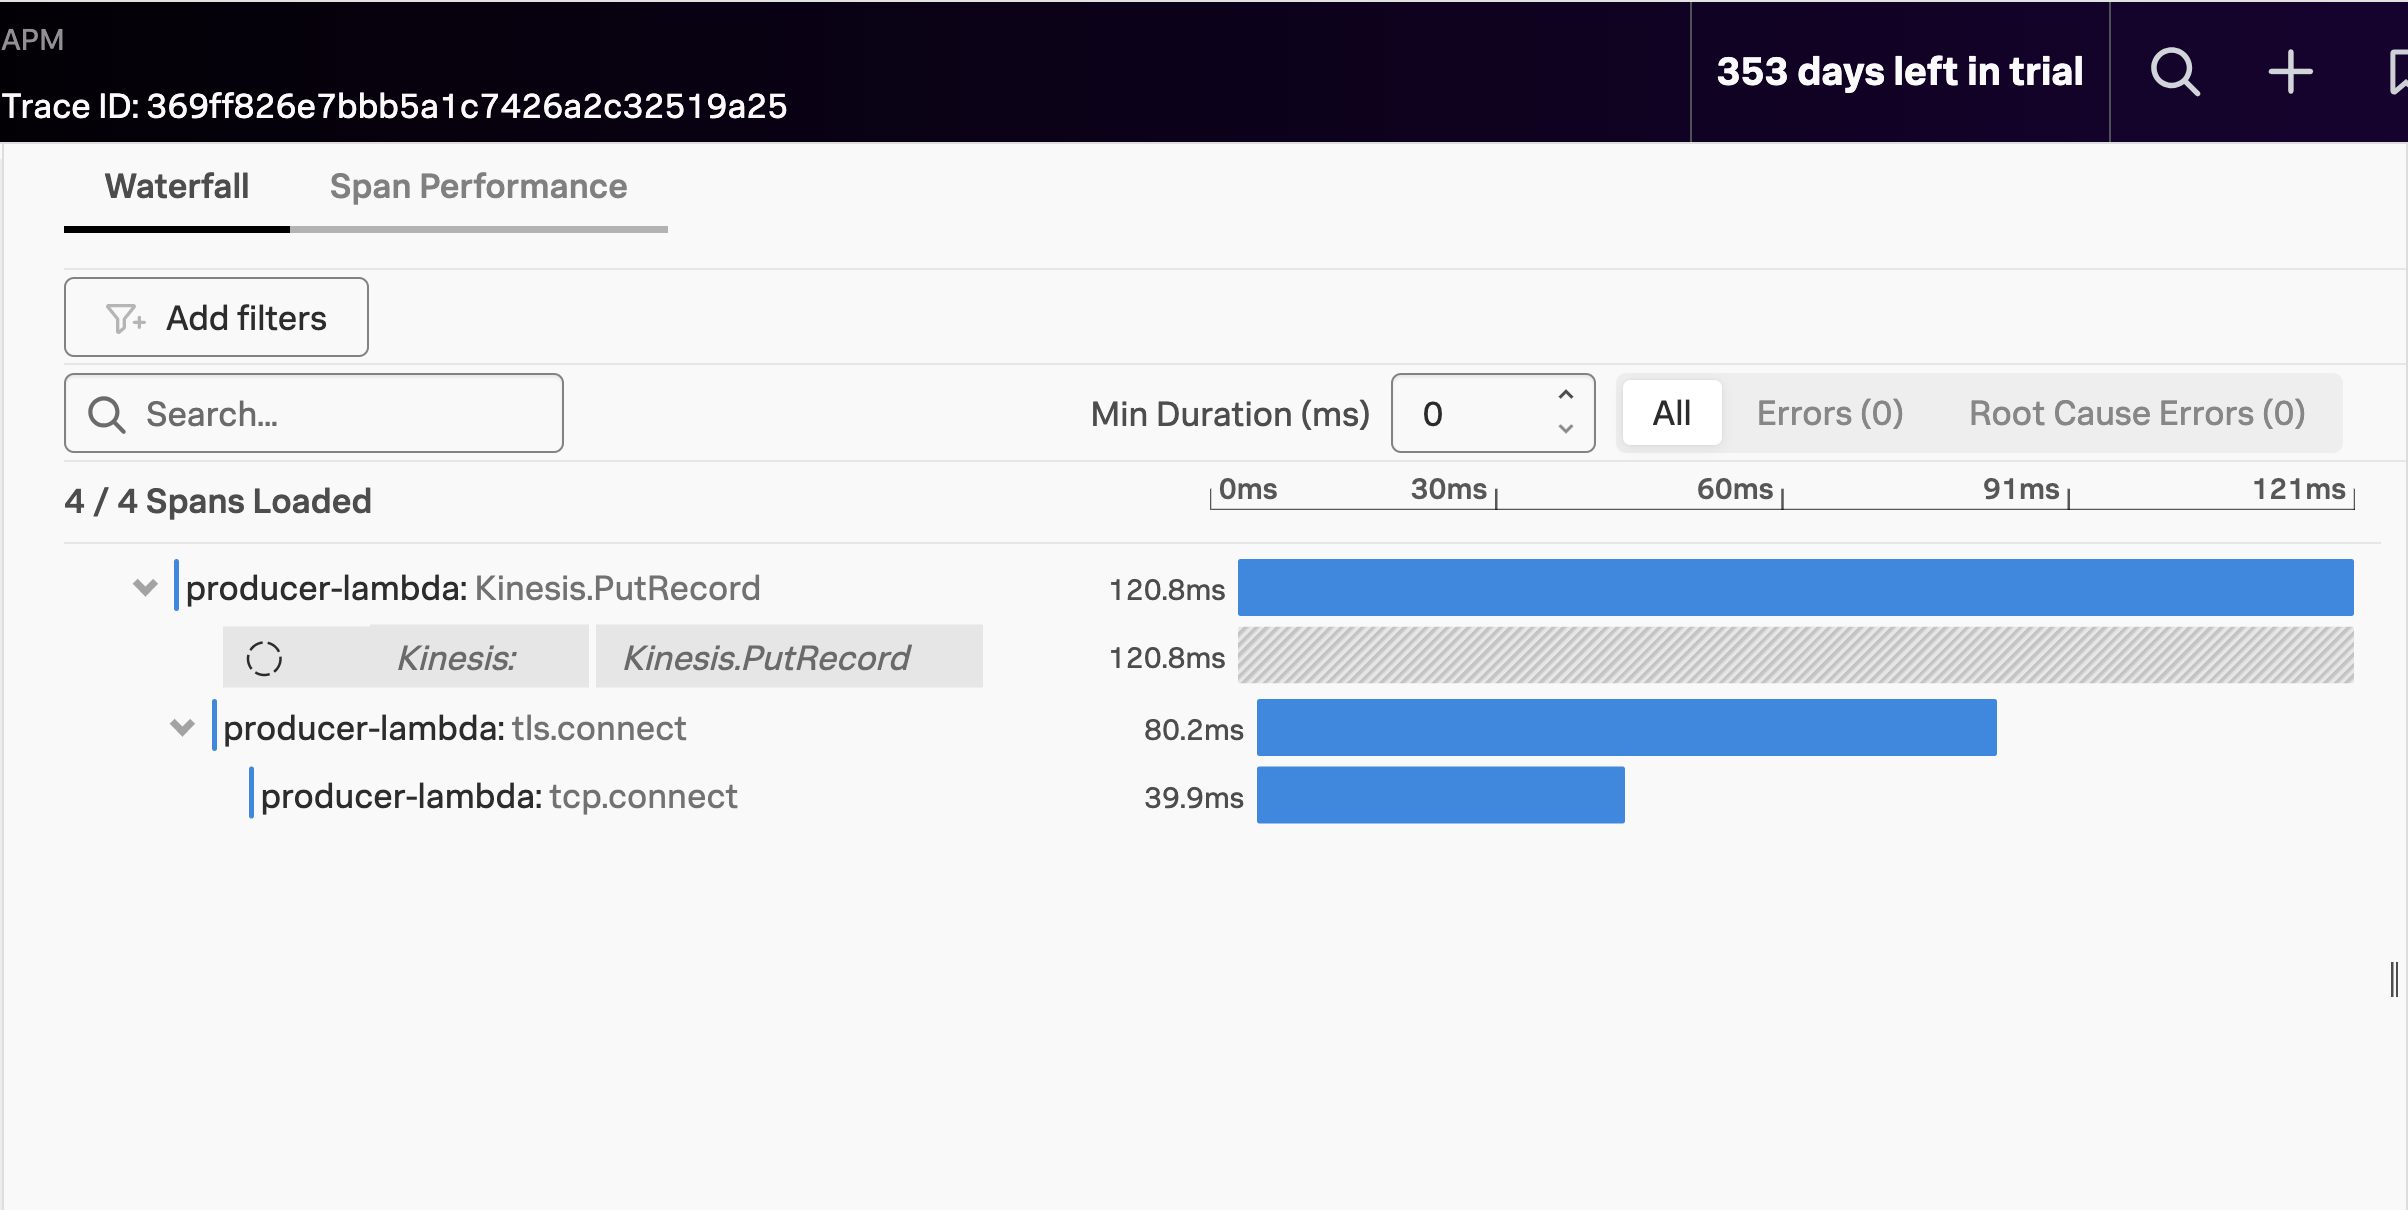
We can see that the producer-lambda function is putting a record into the Kinesis Stream. But the action of the consumer-lambda function is missing!
This is because the trace context is not being propagated. Trace context propagation is not supported out-of-the-box by Kinesis service at the time of this workshop. Our distributed trace stops at the Kinesis service, and because its context isn’t automatically propagated through the stream, we can’t see any further.
Not yet, at least…
Let’s see how we work around this in the next section of this workshop. But before that, let’s clean up after ourselves!
Clean Up #
The resources we deployed as part of this auto-instrumenation exercise need to be cleaned. Likewise, the script that was generating traffice against our producer-lambda endpoint needs to be stopped, if it’s still running. Follow the below steps to clean up.
Kill the send_message
#
If the
send_message.pyscript is still running, stop it with the follwing commands:bashfg- This brings your background process to the foreground.
- Next you can hit
[CONTROL-C]to kill the process.
Destroy all AWS resources #
Terraform is great at managing the state of our resources individually, and as a deployment. It can even update deployed resources with any changes to their definitions. But to start afresh, we will destroy the resources and redeploy them as part of the manual instrumentation portion of this workshop.
Please follow these steps to destroy your resources:
Ensure you are in the
autodirectory:bashpwd- The expected output would be ~/workshop/lambda/auto
If you are not in the
autodirectory, run the following command:bashcd ~/workshop/lambda/autoDestroy the Lambda functions and other AWS resources you deployed earlier:
bashterraform destroy- respond
yeswhen you see theEnter a value:prompt - This will result in the resources being destroyed, leaving you with a clean environment
- respond
This process will leave you with the files and directories created as a result of our activity. Do not worry about those.