Distributed Tracing for AWS Lambda Functions
Deploying Lambda Functions & Generating Trace Data
Now that we know how to apply manual instrumentation to the functions and services we wish to capture trace data for, let’s go about deploying our Lambda functions again, and generating traffic against our producer-lambda endpoint.
Initialize Terraform in the manual directory
#
Seeing as we’re in a new directory, we will need to initialize Terraform here once again.
Ensure you are in the
manualdirectory:bashpwd- The expected output would be ~/workshop/lambda/manual
If you are not in the
manualdirectory, run the following command:bashcd ~/workshop/lambda/manualRun the following command to initialize Terraform in this directory
bashterraform init
Deploy the Lambda functions and other AWS resources #
Let’s go ahead and deploy those resources again as well!
Run the terraform plan command, ensuring there are no issues.
bashterraform planFollow up with the terraform apply command to deploy the Lambda functions and other supporting resources from the main.tf file:
bashterraform applyRespond yes when you see the Enter a value: prompt
This will result in the following outputs:
bashOutputs: base_url = "https://______.amazonaws.com/serverless_stage/producer" consumer_function_name = "_____-consumer" consumer_log_group_arn = "arn:aws:logs:us-east-1:############:log-group:/aws/lambda/______-consumer" consumer_log_group_name = "/aws/lambda/______-consumer" environment = "______-lambda-shop" lambda_bucket_name = "lambda-shop-______-______" producer_function_name = "______-producer" producer_log_group_arn = "arn:aws:logs:us-east-1:############:log-group:/aws/lambda/______-producer" producer_log_group_name = "/aws/lambda/______-producer"
As you can tell, aside from the first portion of the base_url and the log gropu ARNs, the output should be largely the same as when you ran the auto-instrumentation portion of this workshop up to this same point.
Send some traffic to the producer-lambda endpoint (base_url)
#
Once more, we will send our name and superpower as a message to our endpoint. This will then be added to a record in our Kinesis Stream, along with our trace context.
Ensure you are in the
manualdirectory:bashpwd- The expected output would be ~/workshop/lambda/manual
If you are not in the
manualdirectory, run the following command:bashcd ~/workshop/lambda/manualRun the
send_message.pyscript as a background process:bashnohup ./send_message.py --name CHANGEME --superpower CHANGEME &Next, check the contents of the response.logs file for successful calls to ourproducer-lambda endpoint:
bashcat response.logsYou should see the following output among the lines printed to your screen if your message is successful:
bash{"message": "Message placed in the Event Stream: hostname-eventStream"}If unsuccessful, you will see:
bash{"message": "Internal server error"}
Info
If this occurs, ask one of the workshop facilitators for assistance.
View the Lambda Function Logs #
Let’s see what our logs look like now.
Check the producer.logs file:
bashcat producer.logsAnd the consumer.logs file:
bashcat consumer.logs
Examine the logs carefully.
Workshop Question #
Do you notice the difference?
Copy the Trace ID from the consumer.logs file
#
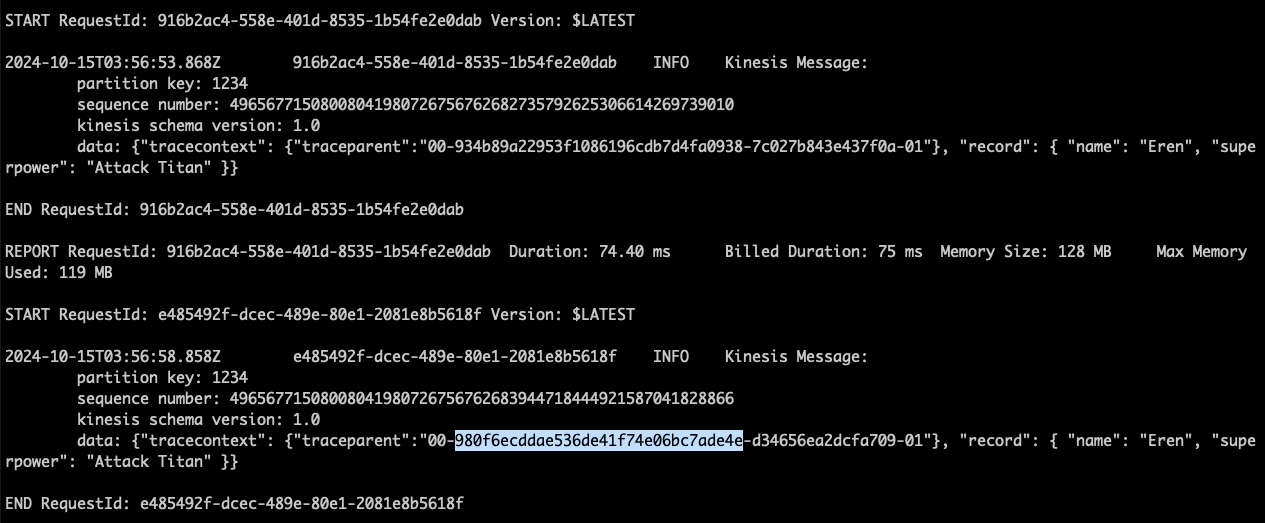
This time around, we can see that the consumer-lambda log group is logging our message as a record together with the tracecontext that we propagated.
To copy the Trace ID:
- Take a look at one of the
Kinesis Messagelogs. Within it, there is adatadictionary - Take a closer look at
datato see the nestedtracecontextdictionary - Within the
tracecontextdictionary, there is atraceparentkey-value pair - The
traceparentkey-value pair holds the Trace ID we seek- There are 4 groups of values, separated by
-. The Trace ID is the 2nd group of characters
- There are 4 groups of values, separated by
- Copy the Trace ID, and save it. We will need it for a later step in this workshop