

Distributed Tracing for AWS Lambda Functions
Splunk APM, Lambda Functions and Traces, Again!
In order to see the result of our context propagation outside of the logs, we’ll once again consult the Splunk APM UI .
View your Lambda Functions in the Splunk APM Service Map #
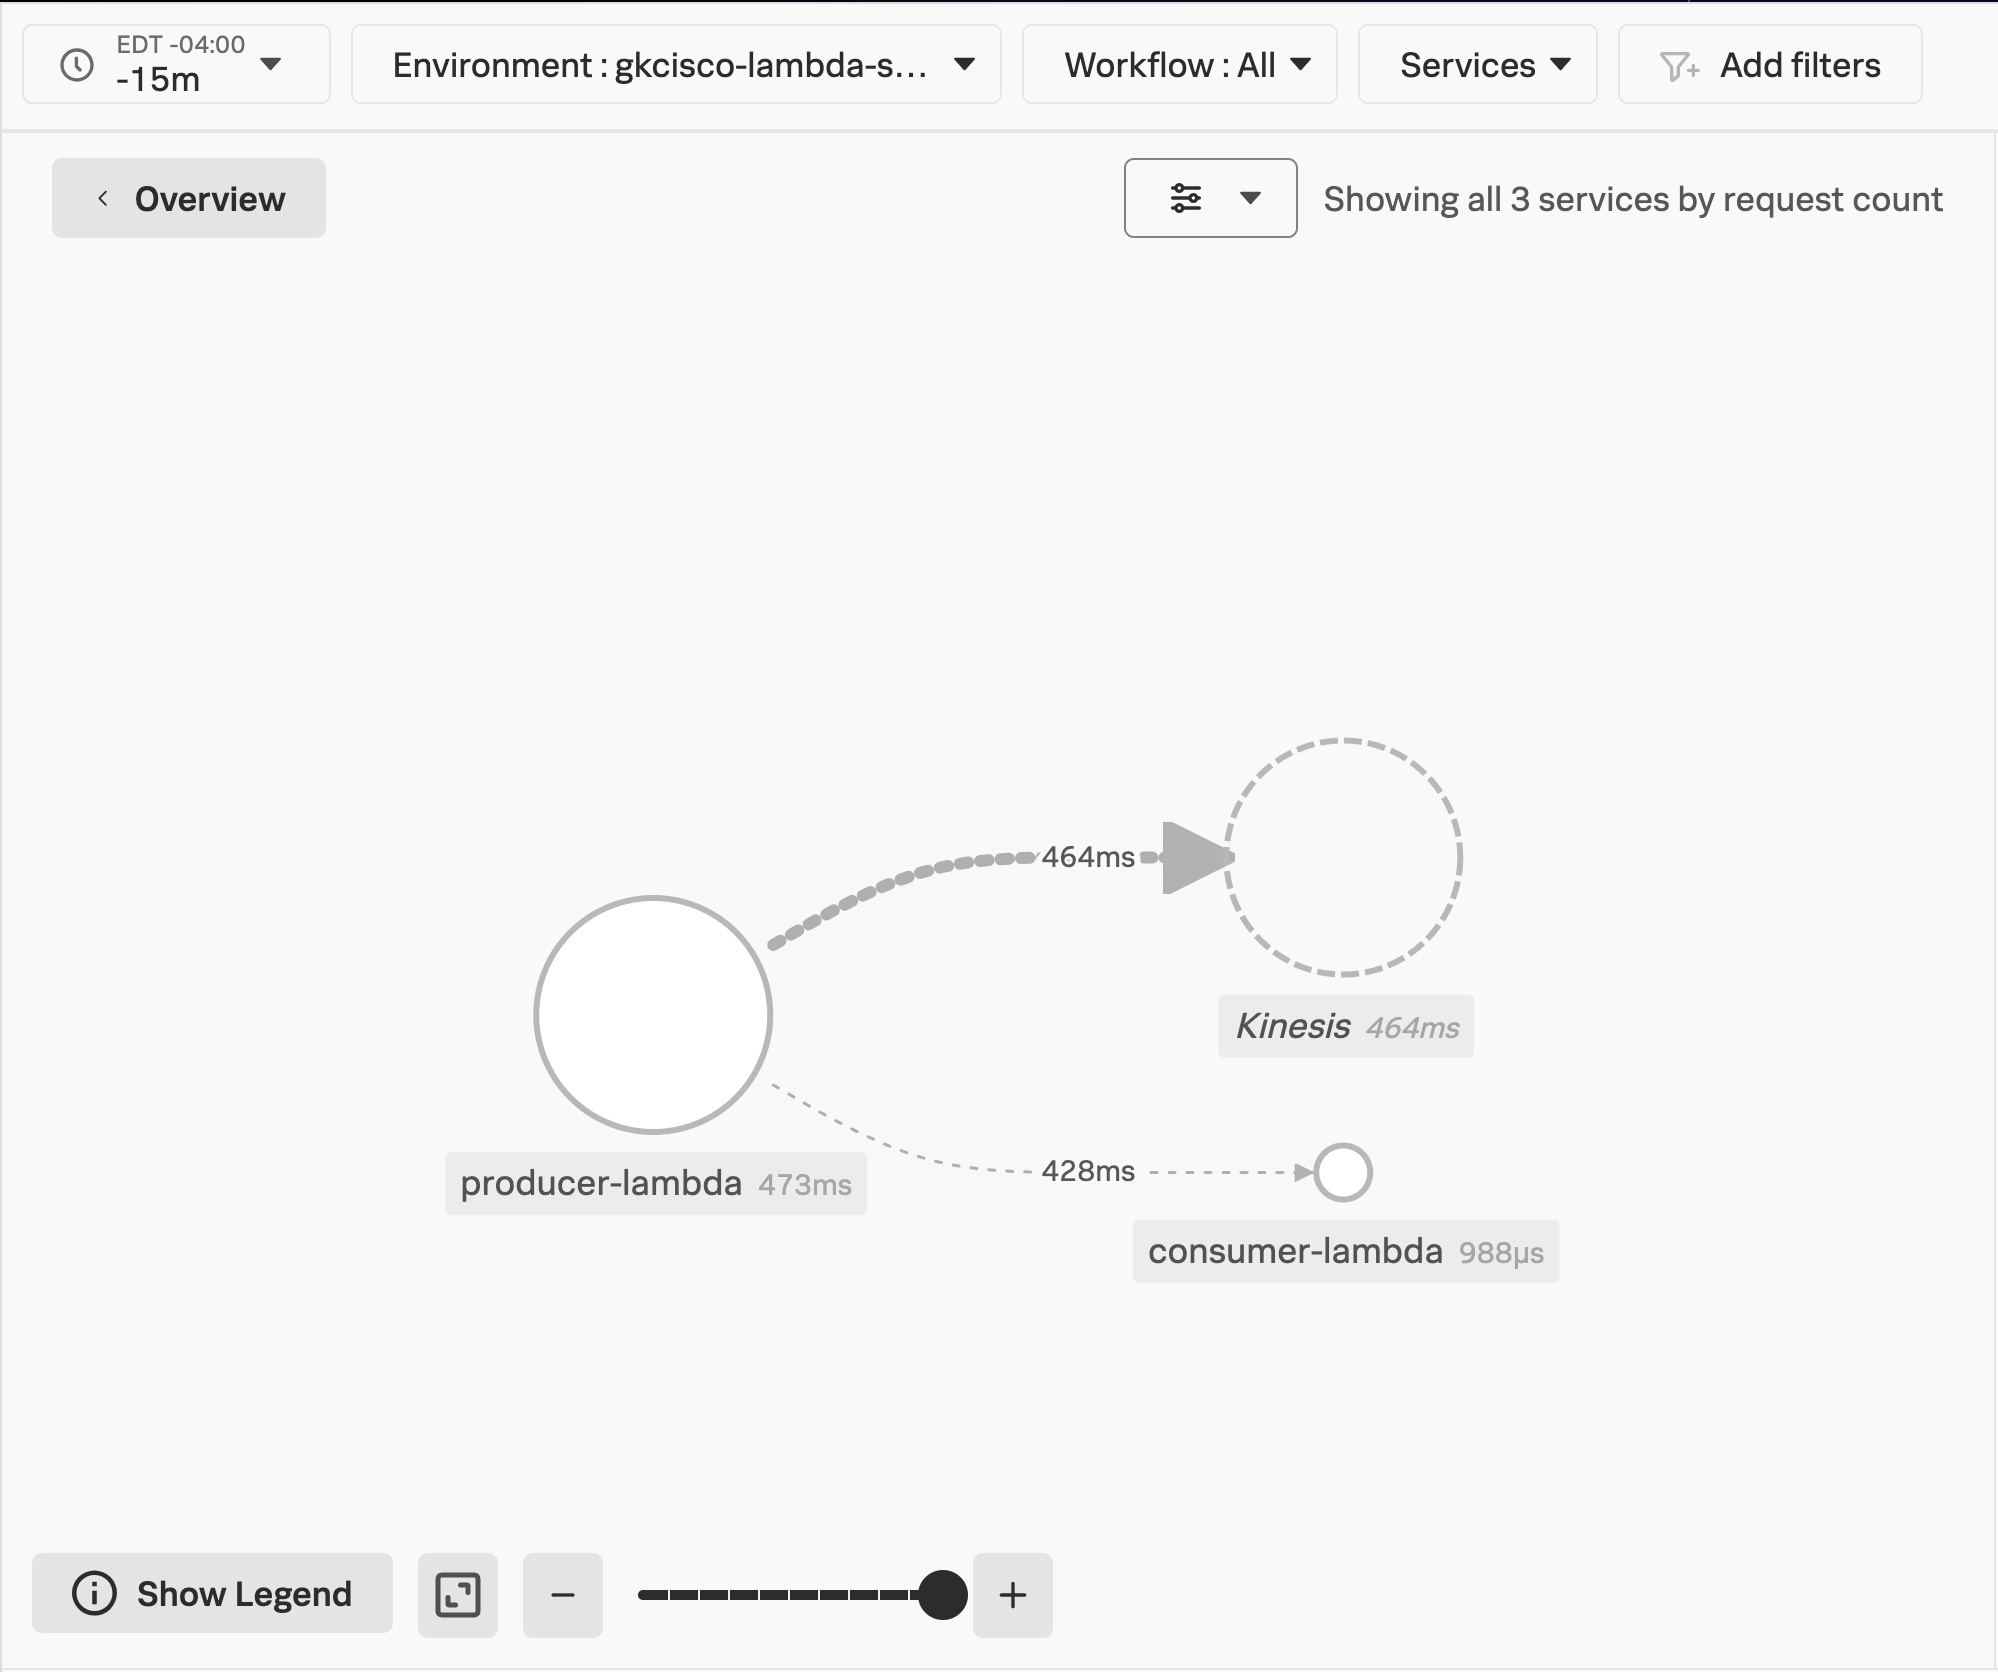
Let’s take a look at the Service Map for our environment in APM once again.
In Splunk Observability Cloud:
Click on the
APMButton in the Main Menu.Select your APM Environment from the
Environment:dropdown.Click the
Service MapButton on the right side of the APM Overview page. This will take you to your Service Map view.
Note
Reminder: It may take a few minutes for your traces to appear in Splunk APM. Try hitting refresh on your browser until you find your environment name in the list of environments.
Workshop Question
Notice the difference?- You should be able to see the
producer-lambdaandconsumer-lambdafunctions linked by the propagated context this time!
Explore a Lambda Trace by Trace ID #
Next, we will take another look at a trace related to our Environment.
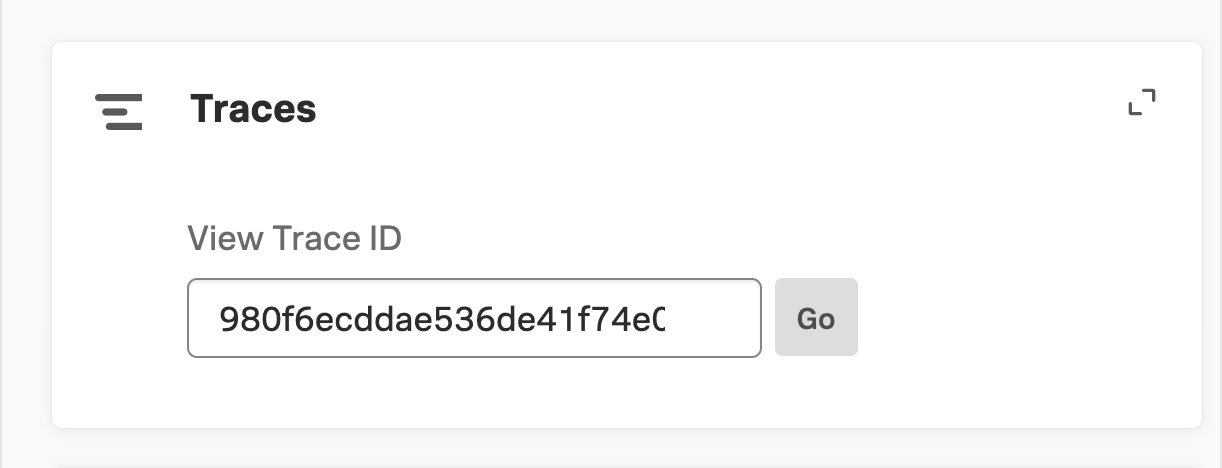
- Paste the Trace ID you copied from the consumer function’s logs into the
View Trace IDsearch box under Traces and clickGo
Note
The Trace ID was a part of the trace context that we propagated.
You can read up on two of the most common propagation standards:
Workshop Question
Which one are we using?
- The Splunk Distribution of Opentelemetry JS, which supports our NodeJS functions, defaults
to the
W3Cstandard
Workshop Question
Bonus Question: What happens if we mix and match the W3C and B3 headers?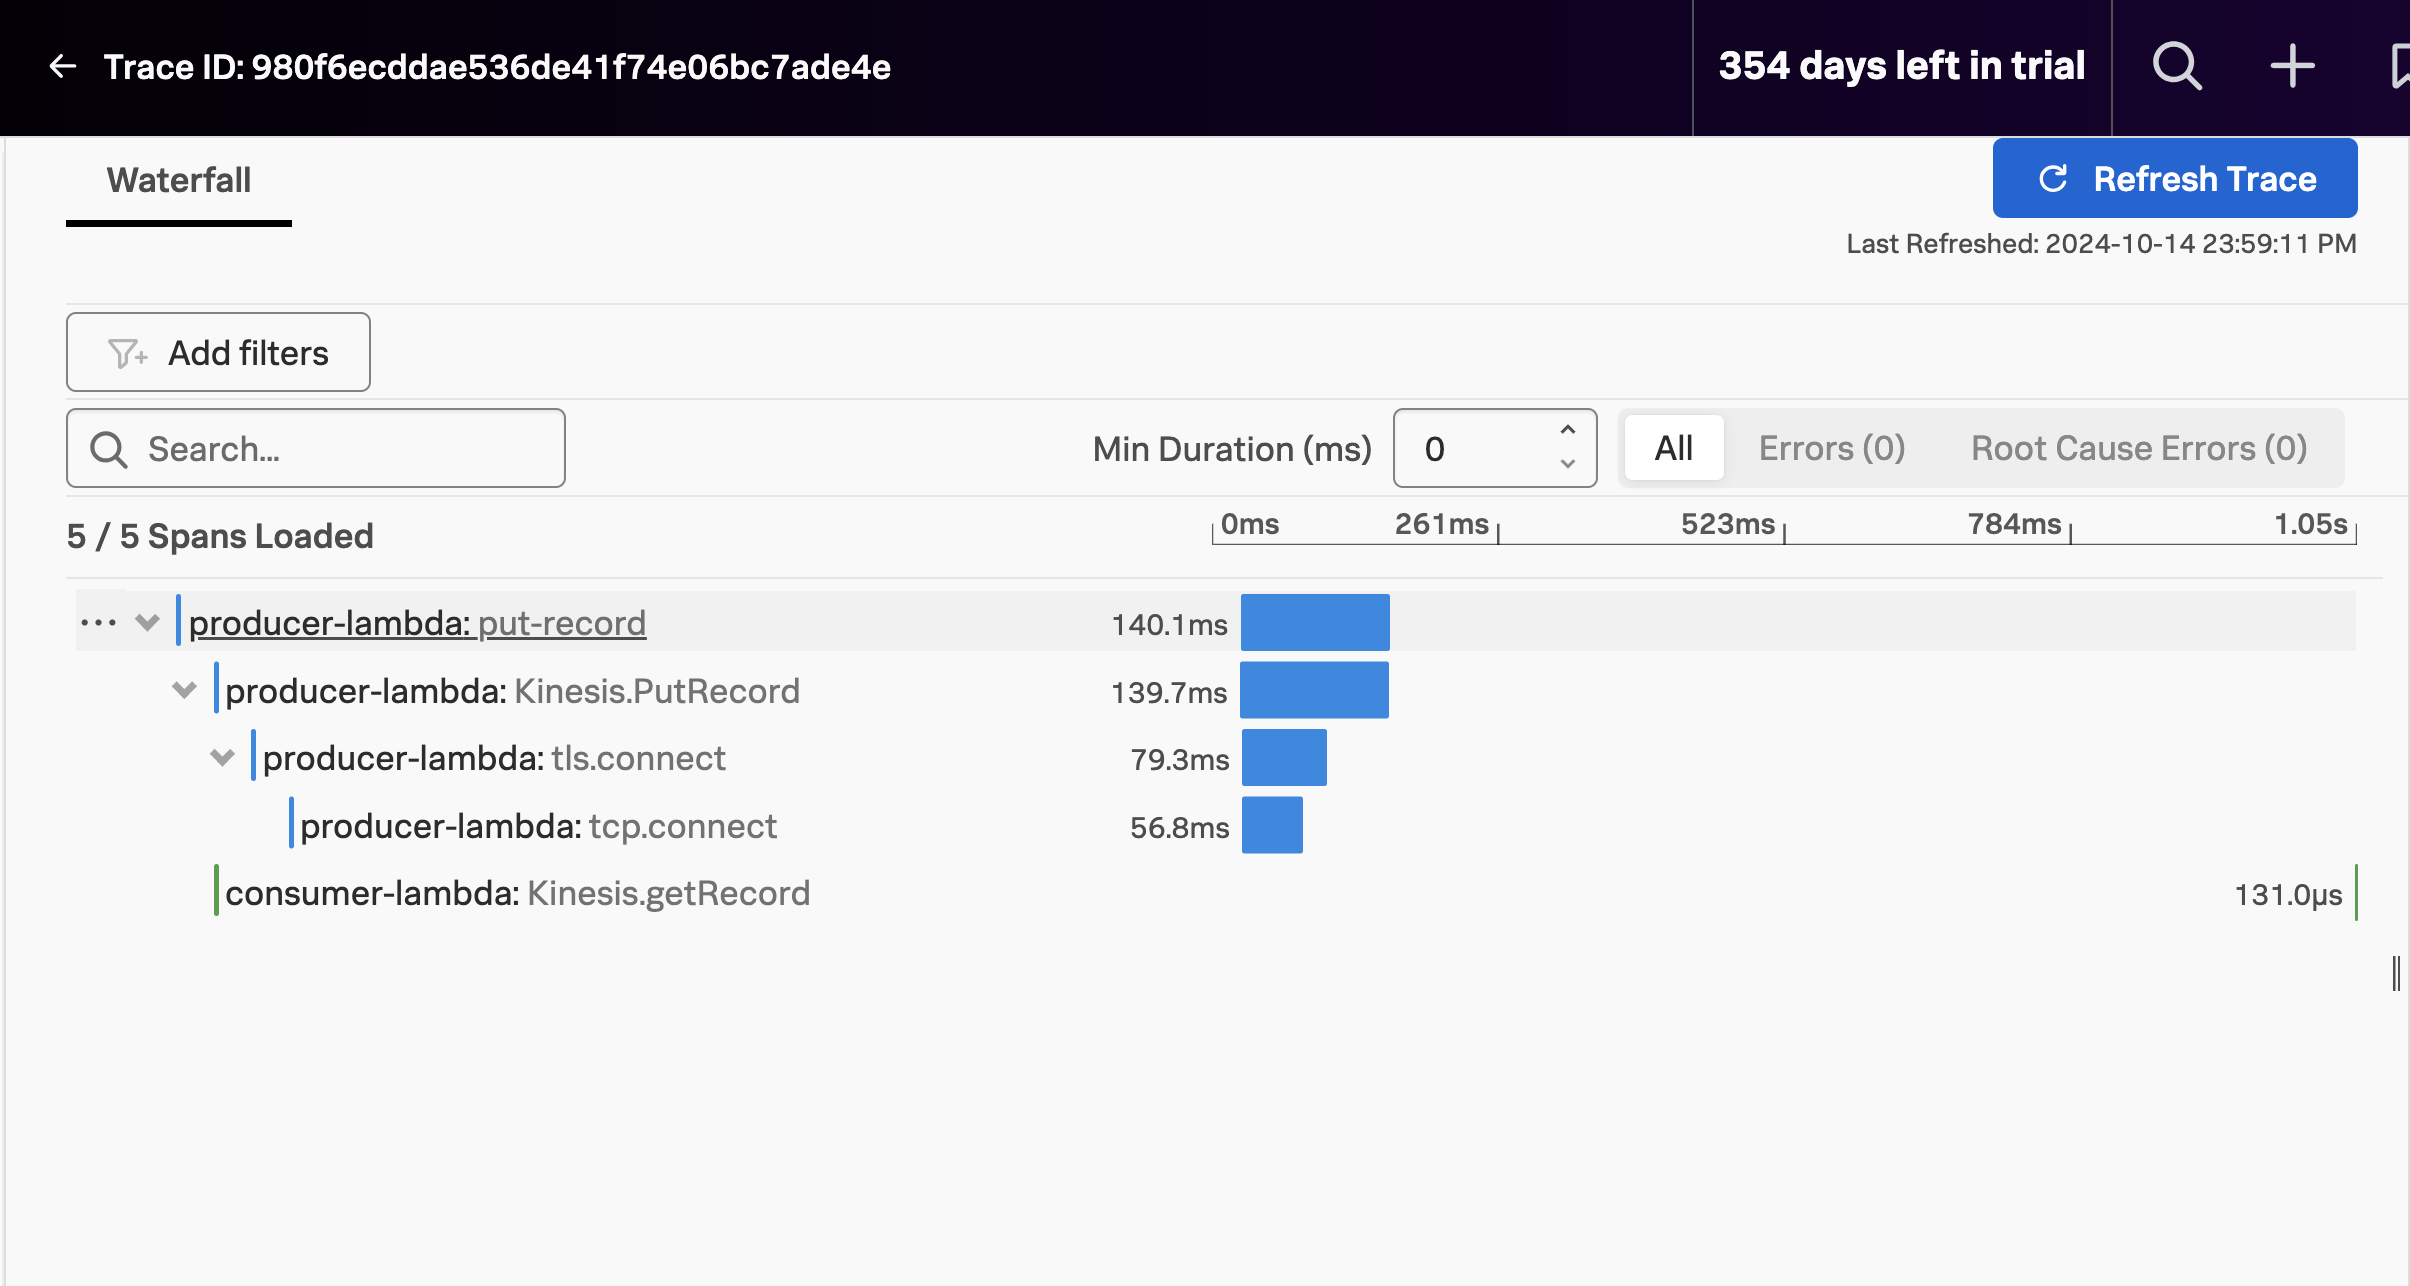
Click on the consumer-lambda span.
Workshop Question
Can you find the attributes from your message?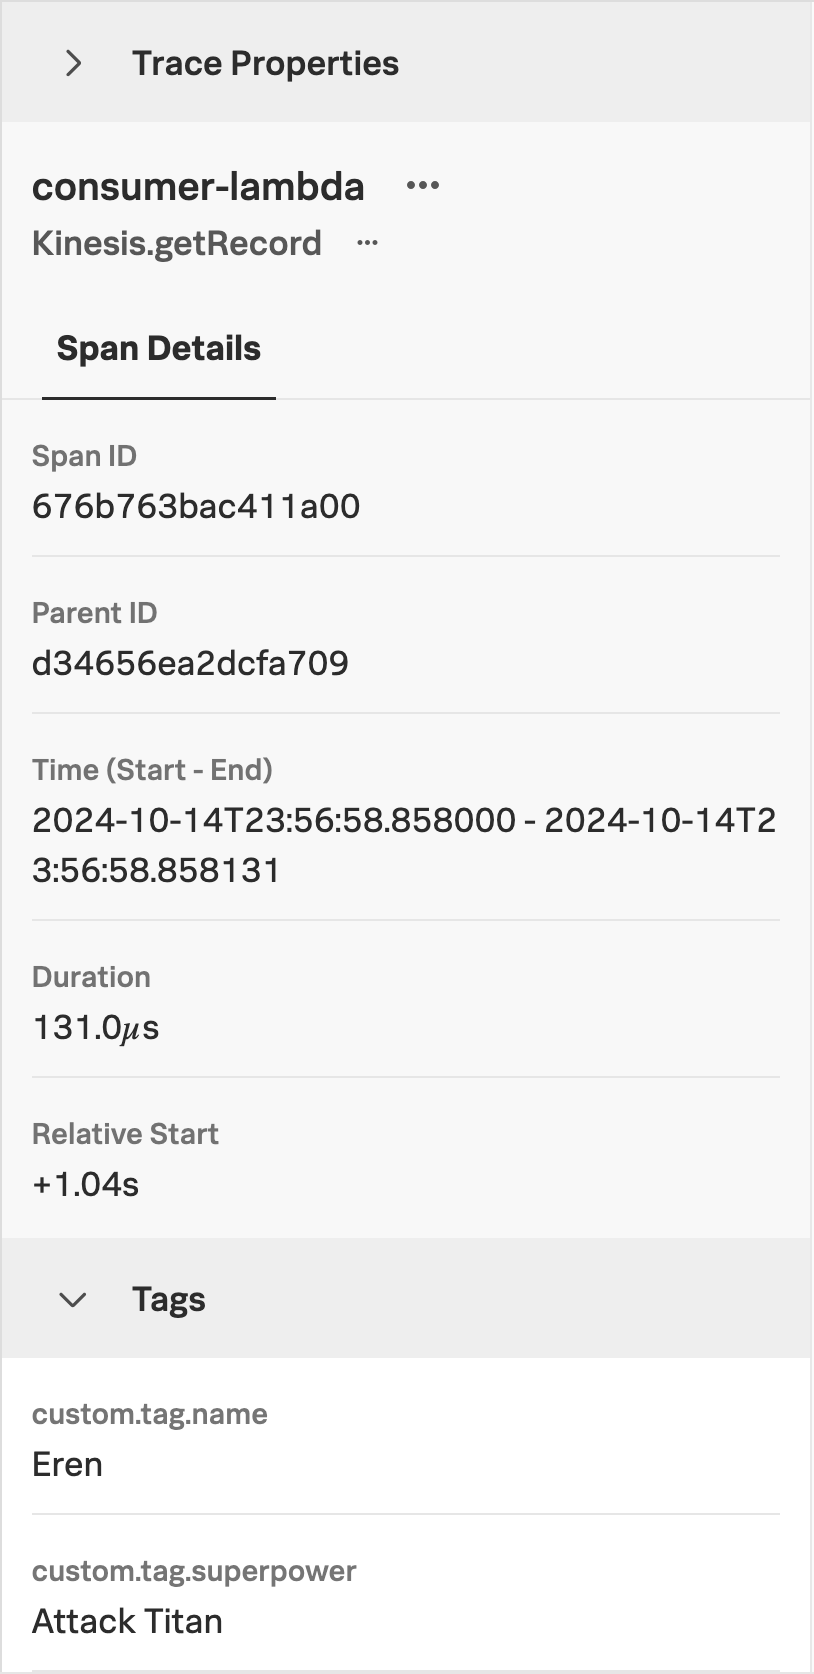
Clean Up #
We are finally at the end of our workshop. Kindly clean up after yourself!
Kill the send_message
#
If the
send_message.pyscript is still running, stop it with the follwing commands:bashfg- This brings your background process to the foreground.
- Next you can hit
[CONTROL-C]to kill the process.
Destroy all AWS resources #
Terraform is great at managing the state of our resources individually, and as a deployment. It can even update deployed resources with any changes to their definitions. But to start afresh, we will destroy the resources and redeploy them as part of the manual instrumentation portion of this workshop.
Please follow these steps to destroy your resources:
Ensure you are in the
manualdirectory:bashpwd- The expected output would be ~/workshop/lambda/manual
If you are not in the
manualdirectory, run the following command:bashcd ~/workshop/lambda/manualDestroy the Lambda functions and other AWS resources you deployed earlier:
bashterraform destroy- respond
yeswhen you see theEnter a value:prompt - This will result in the resources being destroyed, leaving you with a clean environment
- respond