Hands-On OpenTelemetry, Docker, and K8s
Instrument a .NET Application with OpenTelemetry
Download the Splunk Distribution of OpenTelemetry #
For this workshop, we’ll install the Splunk Distribution of OpenTelemetry manually rather than using the NuGet packages.
We’ll start by downloading the latest splunk-otel-dotnet-install.sh file,
which we’ll use to instrument our .NET application:
cd ~/workshop/docker-k8s-otel/helloworld

curl -sSfL https://github.com/signalfx/splunk-otel-dotnet/releases/latest/download/splunk-otel-dotnet-install.sh -O
Refer to Install the Splunk Distribution of OpenTelemetry .NET manually for further details on the installation process.
Install the Distribution #
In the terminal, install the distribution as follows
sh ./splunk-otel-dotnet-install.shDownloading v1.8.0 for linux-glibc (/tmp/tmp.m3tSdtbmge/splunk-opentelemetry-dotnet-linux-glibc-x64.zip)...Note: we may need to include the ARCHITECTURE environment when running the command above:
bashARCHITECTURE=x64 sh ./splunk-otel-dotnet-install.sh
Activate the Instrumentation #
Next, we can activate the OpenTelemetry instrumentation:
. $HOME/.splunk-otel-dotnet/instrument.shSet the Deployment Environment #
Let’s set the deployment environment, to ensure our data flows into its own environment within Splunk Observability Cloud:
export OTEL_RESOURCE_ATTRIBUTES=deployment.environment=otel-$INSTANCERun the Application with Instrumentation #
We can run the application as follows:
dotnet runA Challenge For You #
How can we see what traces are being exported by the .NET application from our Linux instance?
Access the Application #
Once the application is running, use a second SSH terminal and access it using curl:
curl http://localhost:8080/helloAs before, it should return Hello, World!.
If you enabled trace logging, you should see a trace written the console or collector logs such as the following:
info: Program[0]
/hello endpoint invoked anonymously
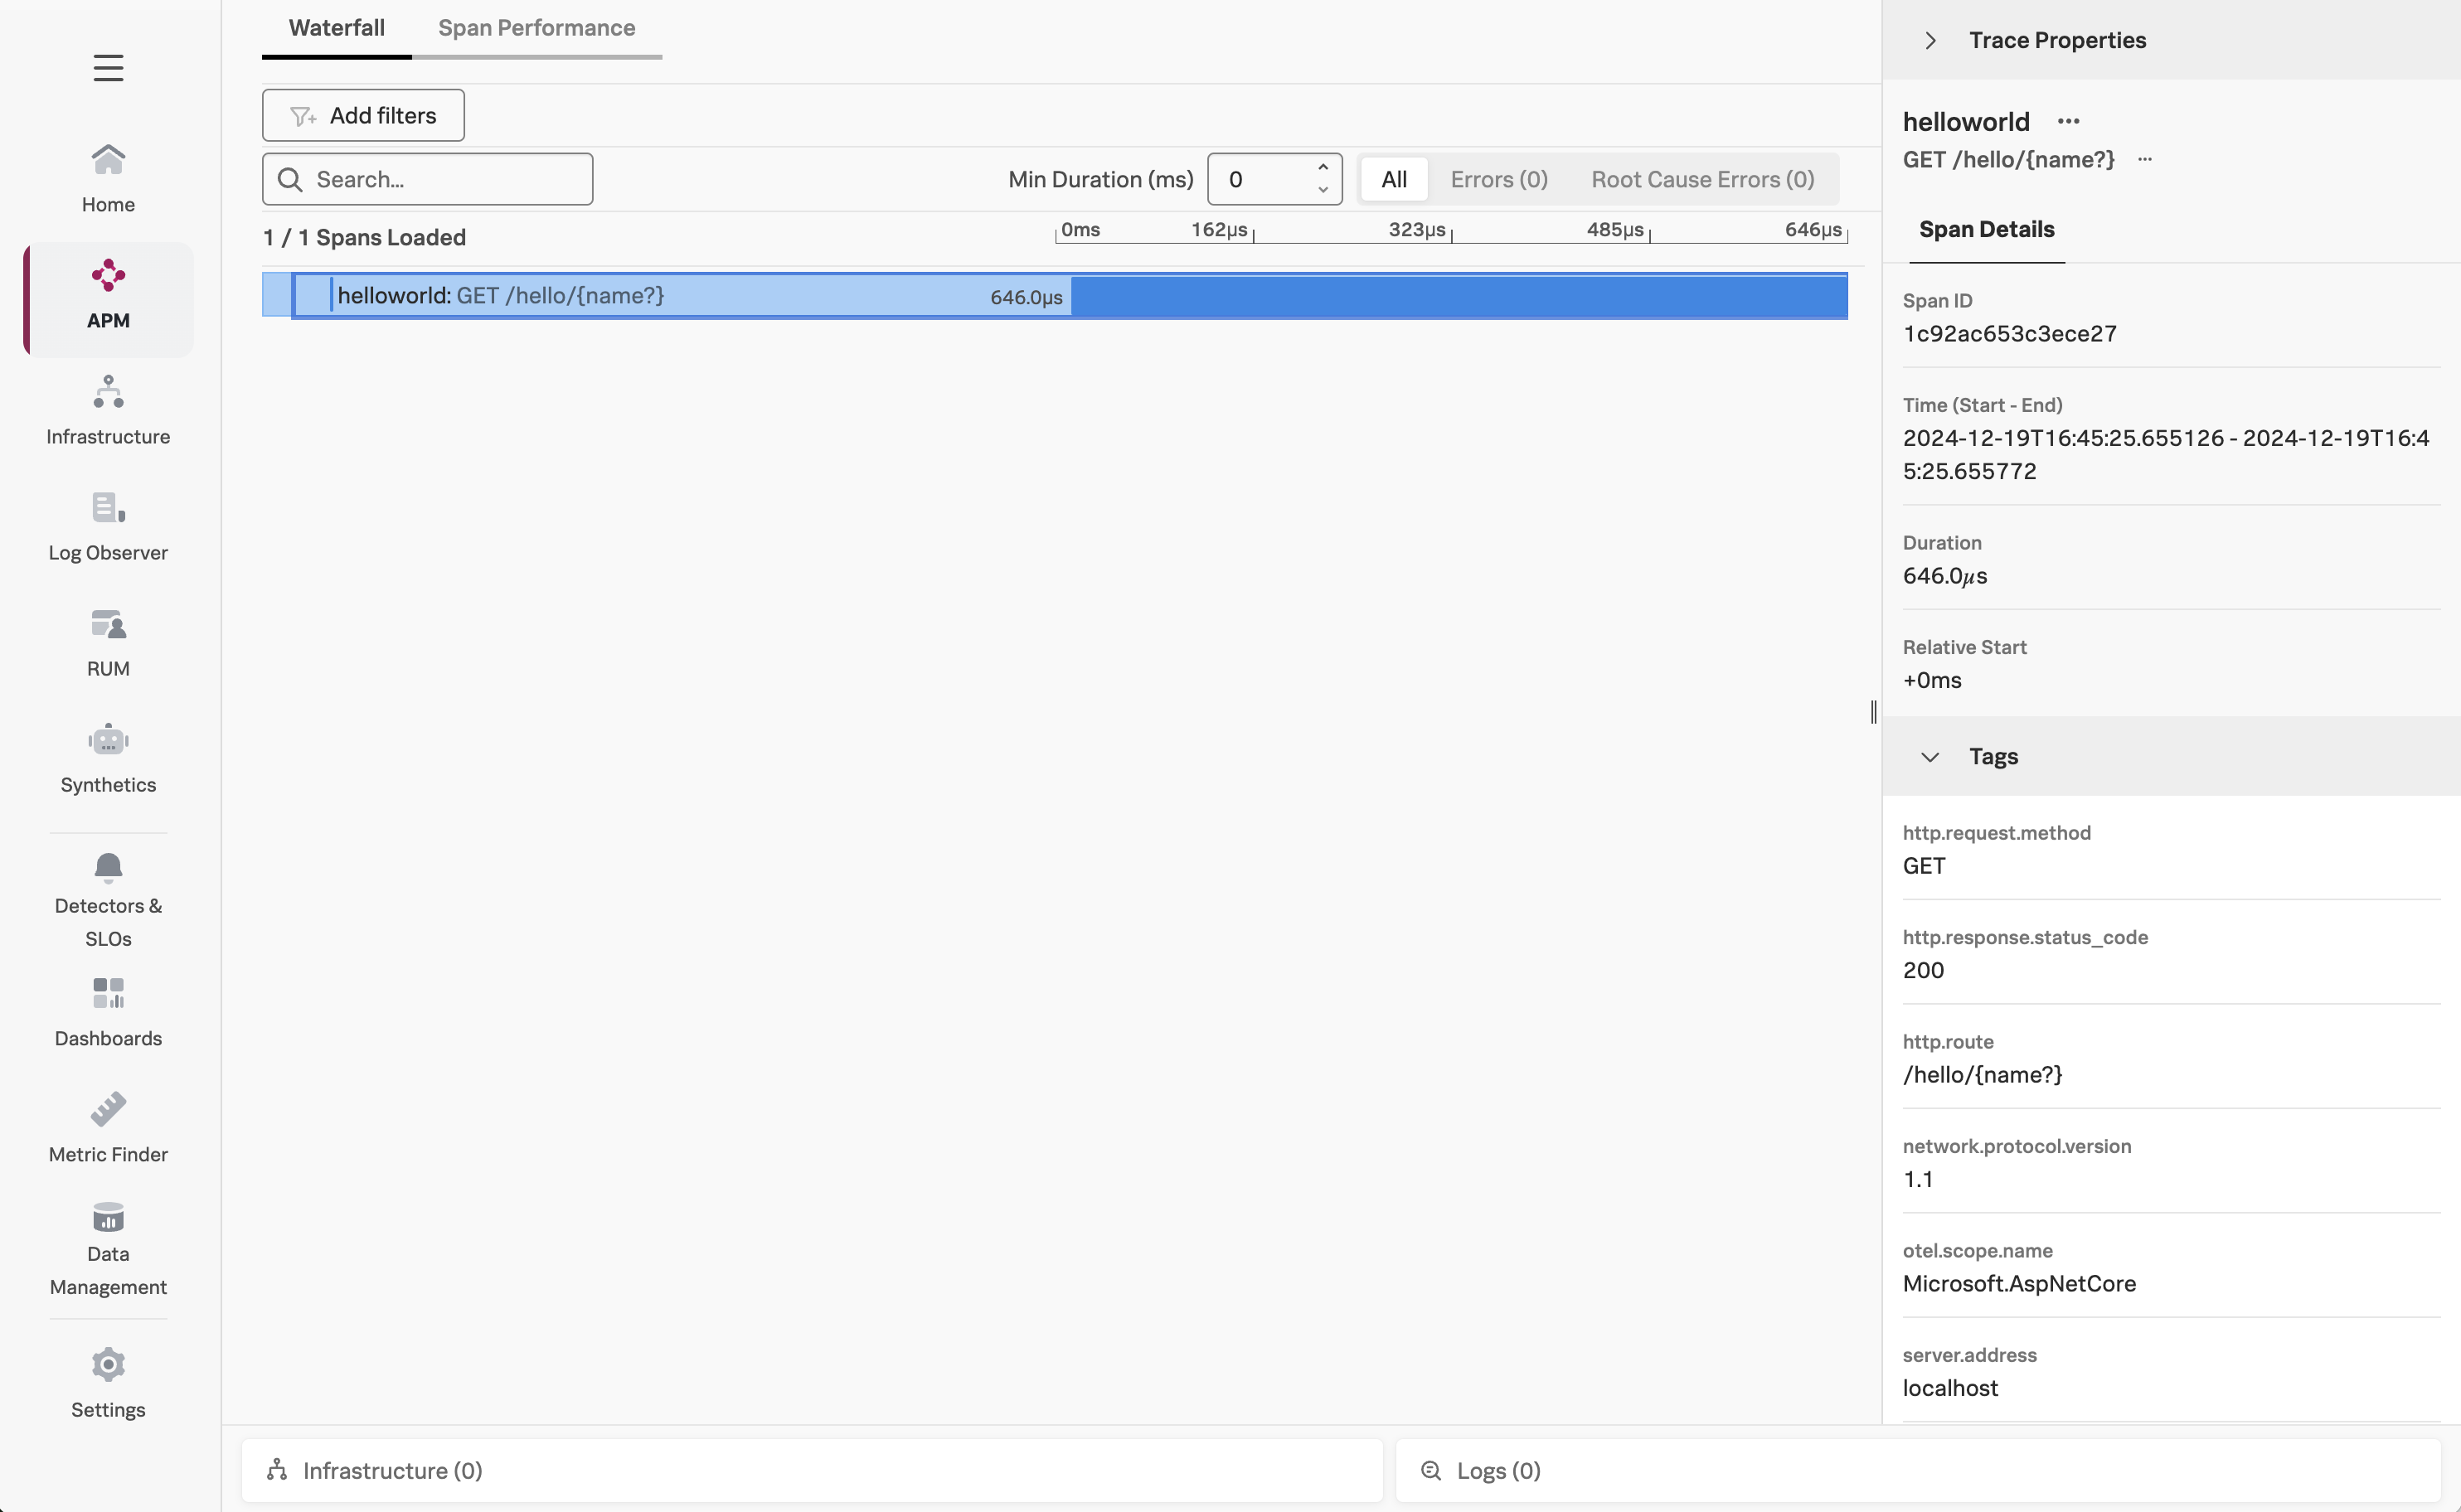
Activity.TraceId: c7bbf57314e4856447508cd8addd49b0
Activity.SpanId: 1c92ac653c3ece27
Activity.TraceFlags: Recorded
Activity.ActivitySourceName: Microsoft.AspNetCore
Activity.DisplayName: GET /hello/{name?}
Activity.Kind: Server
Activity.StartTime: 2024-12-20T00:45:25.6551267Z
Activity.Duration: 00:00:00.0006464
Activity.Tags:
server.address: localhost
server.port: 8080
http.request.method: GET
url.scheme: http
url.path: /hello
network.protocol.version: 1.1
user_agent.original: curl/7.81.0
http.route: /hello/{name?}
http.response.status_code: 200
Resource associated with Activity:
splunk.distro.version: 1.8.0
telemetry.distro.name: splunk-otel-dotnet
telemetry.distro.version: 1.8.0
service.name: helloworld
os.type: linux
os.description: Ubuntu 22.04.5 LTS
os.build_id: 6.8.0-1021-aws
os.name: Ubuntu
os.version: 22.04
host.name: derek-1
host.id: 20cf15fcc7054b468647b73b8f87c556
process.owner: splunk
process.pid: 16997
process.runtime.description: .NET 8.0.11
process.runtime.name: .NET
process.runtime.version: 8.0.11
container.id: 2
telemetry.sdk.name: opentelemetry
telemetry.sdk.language: dotnet
telemetry.sdk.version: 1.9.0
deployment.environment: otel-derek-1View your application in Splunk Observability Cloud #
Now that the setup is complete, let’s confirm that traces are sent to Splunk Observability Cloud. Note that when the application is deployed for the first time, it may take a few minutes for the data to appear.
Navigate to APM, then use the Environment dropdown to select your environment (i.e. otel-instancename).
If everything was deployed correctly, you should see helloworld displayed in the list of services:
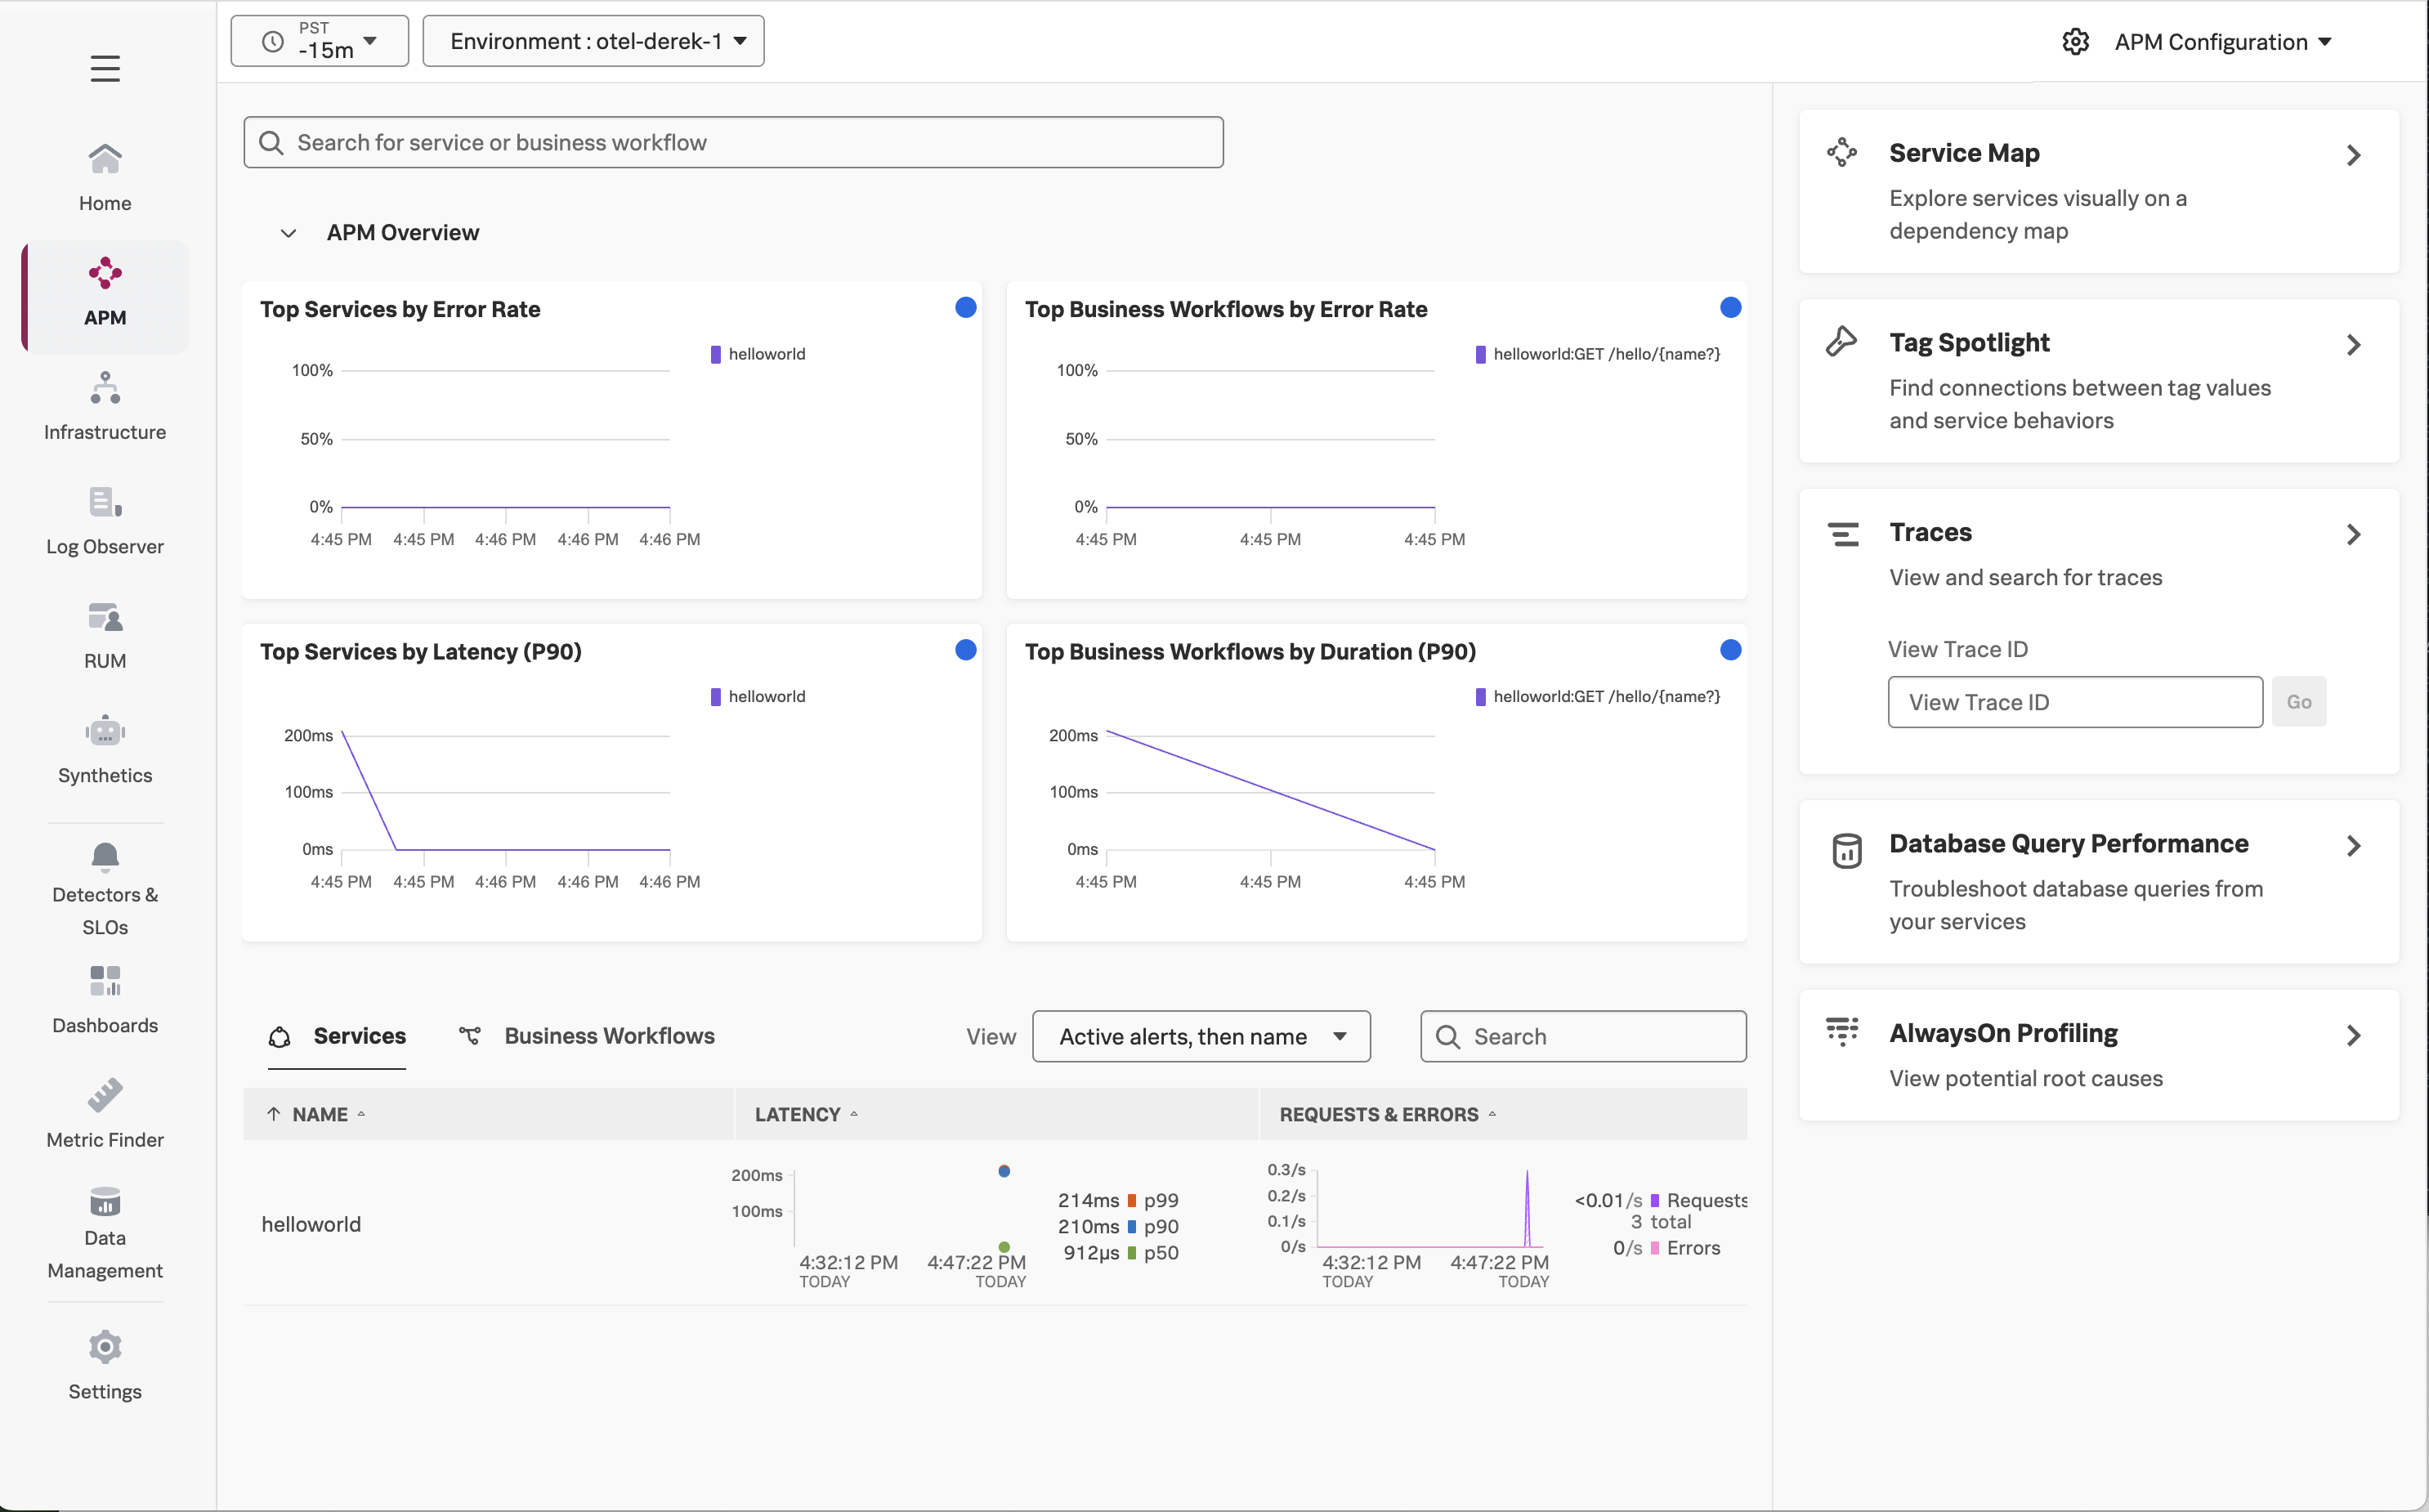
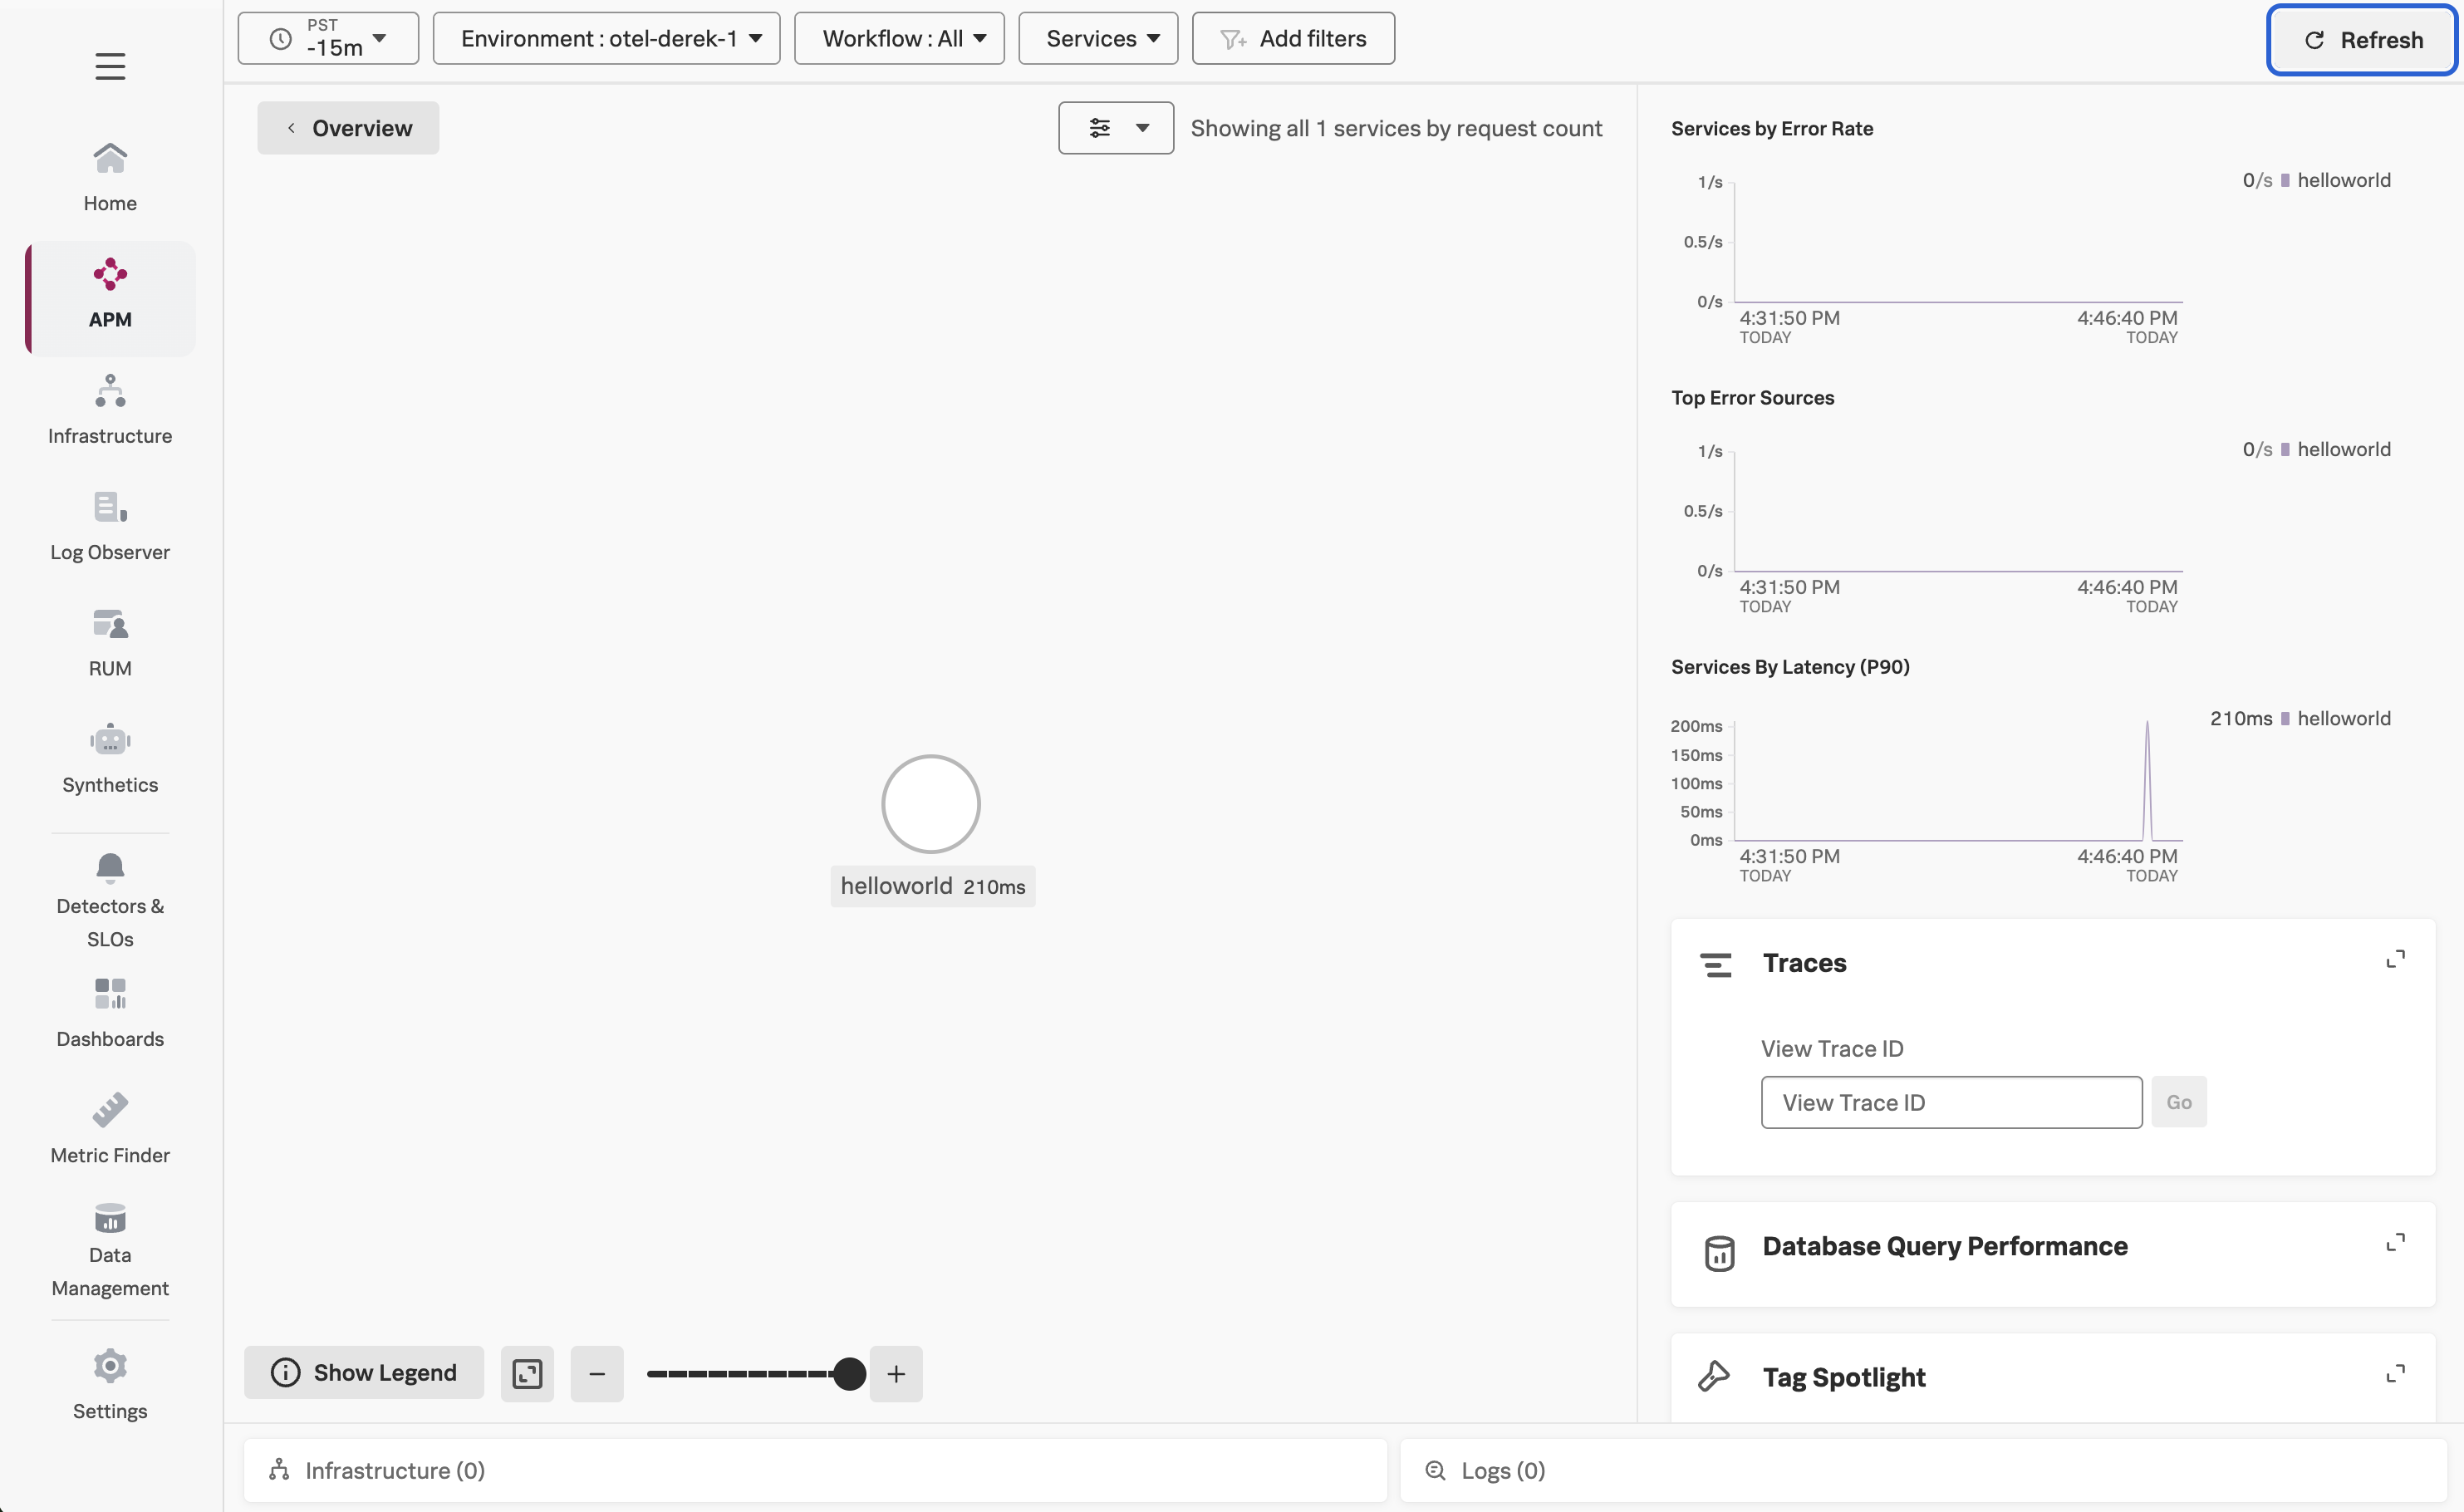
Click on Service Map on the right-hand side to view the service map.
Next, click on Traces on the right-hand side to see the traces captured for this application.
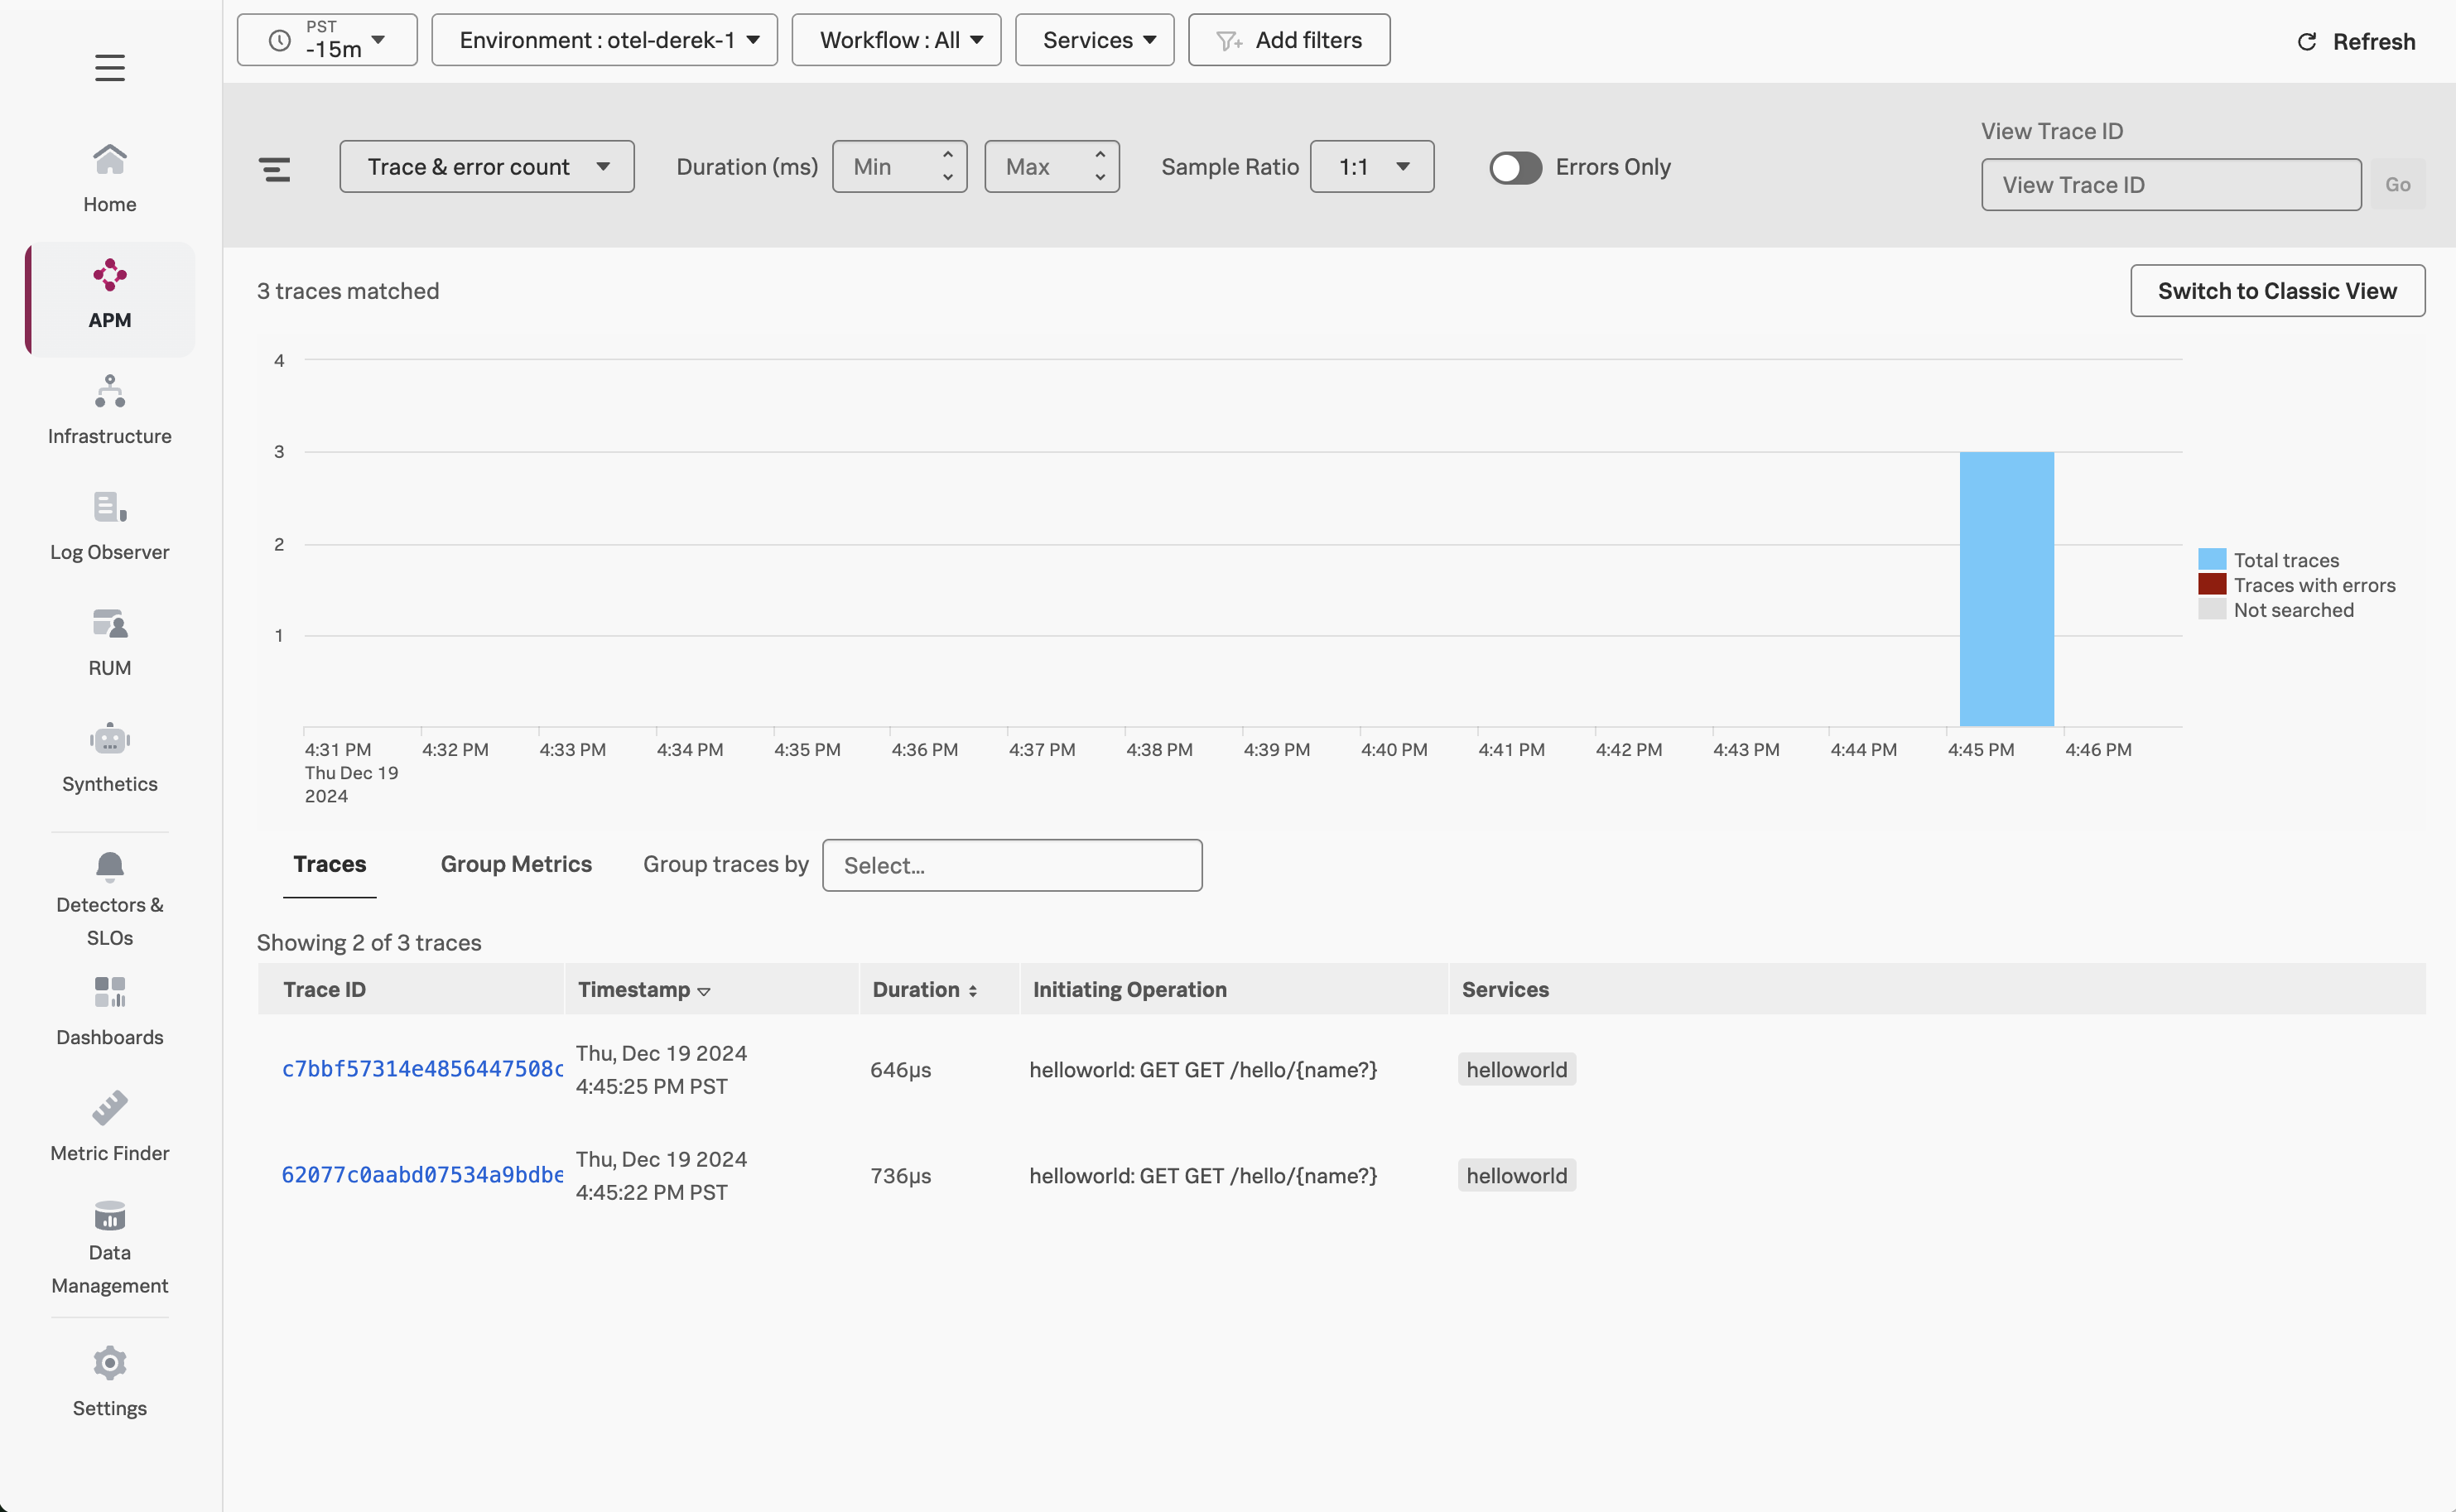
An individual trace should look like the following:
Press Ctrl + C to quit your Helloworld app before moving to the next step.