

Update Pipeline and Visualize Metrics
Aggregate and Drop a High-Cardinality Dimension
Now that you have added the dimensions to your pipeline, you will chart the metric to see how you can use these dimensions for grouping and filtering. Then you will use Metrics Pipeline Management to aggregate the metric and drop the noisy auditID dimension, reducing your cardinality without making any changes to the Ingest Processor Pipeline.
Exercise: Review the New Dimensions
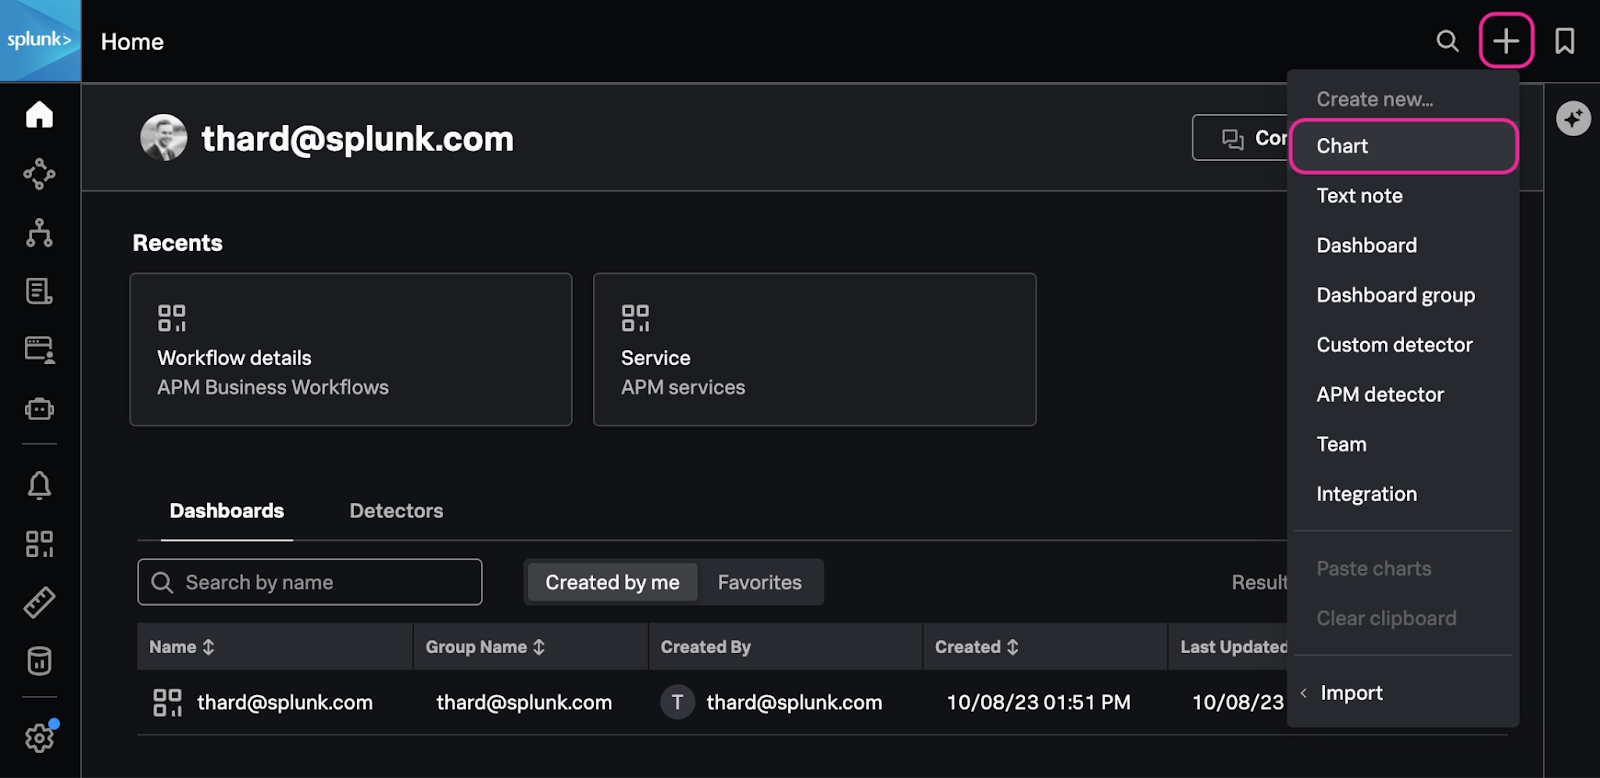
1. If you closed the chart you created in the previous section, in the upper-right corner, click the + Icon → Chart to create a new chart.
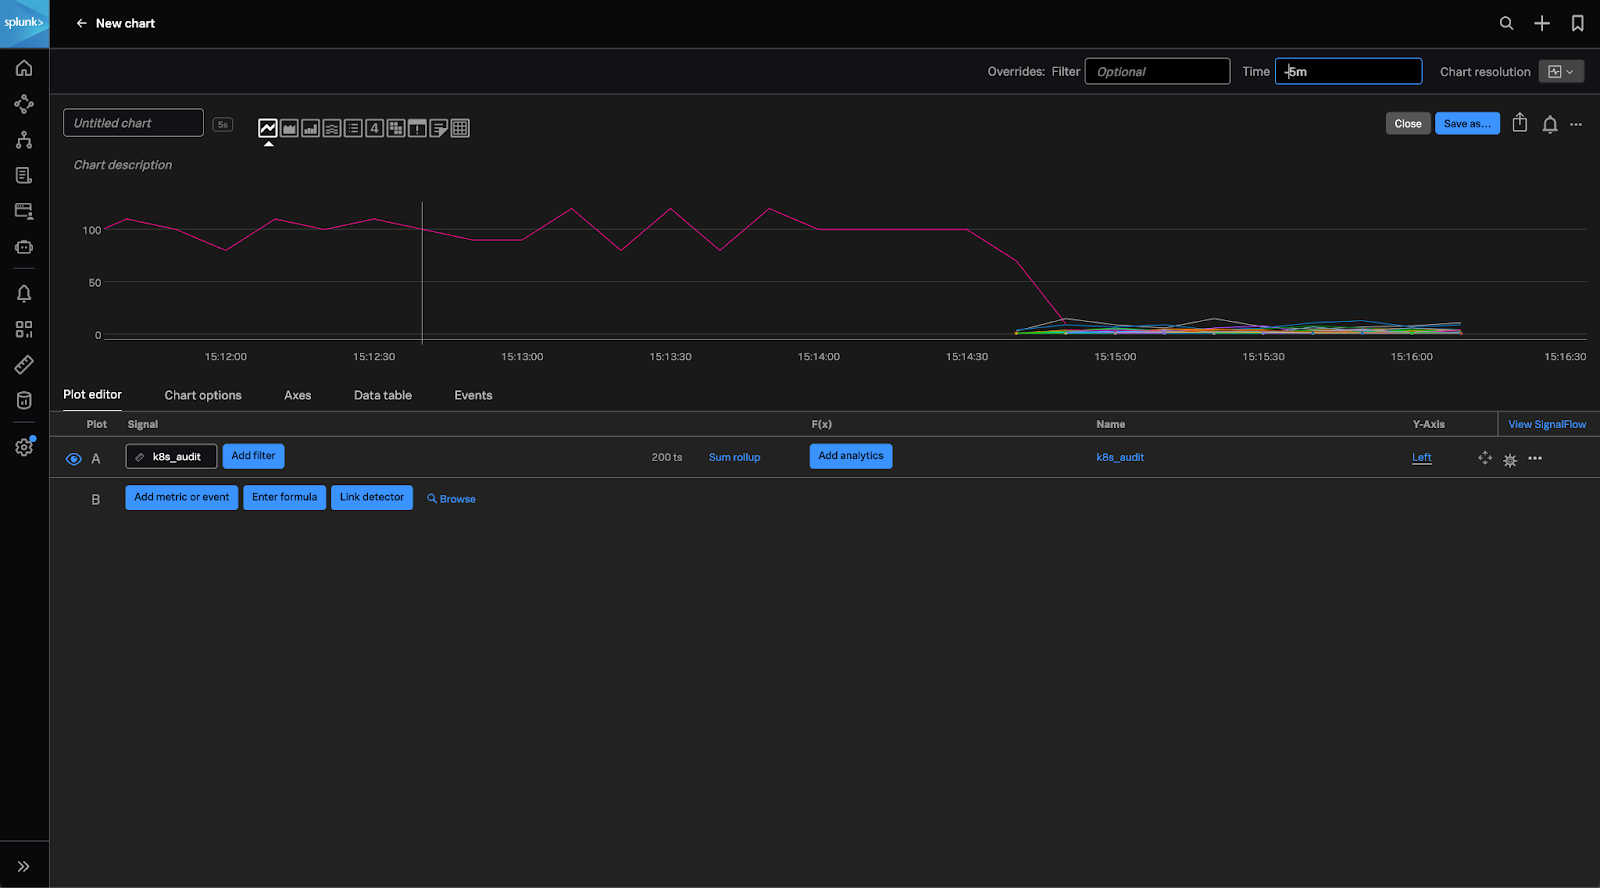
2. In the Plot Editor of the newly created chart enter the name of the metric you created in your Ingest Processor Pipeline (k8s_audit_UNIQUE_FIELD) in the metric name field.
3. Notice the change from one to many metrics, which happened when you updated the pipeline to include the dimensions. Because the auditID dimension is unique on every Kubernetes audit event, every metric data point now creates its own MTS. This is a cardinality explosion, and while the metric is technically more detailed, all of those single-use time series inflate your utilization without providing any value you can actually chart or alert on.
Note
Exercise: Aggregate and Drop the auditID Dimension
You will now use Metrics Pipeline Management to create an aggregation rule that rolls your metric up into a new, lower-cardinality metric that no longer includes the unique auditID dimension. You will then drop the raw, high-cardinality metric that you no longer need.
1. In Splunk Observability Cloud, navigate to Metrics → Pipeline Automation.
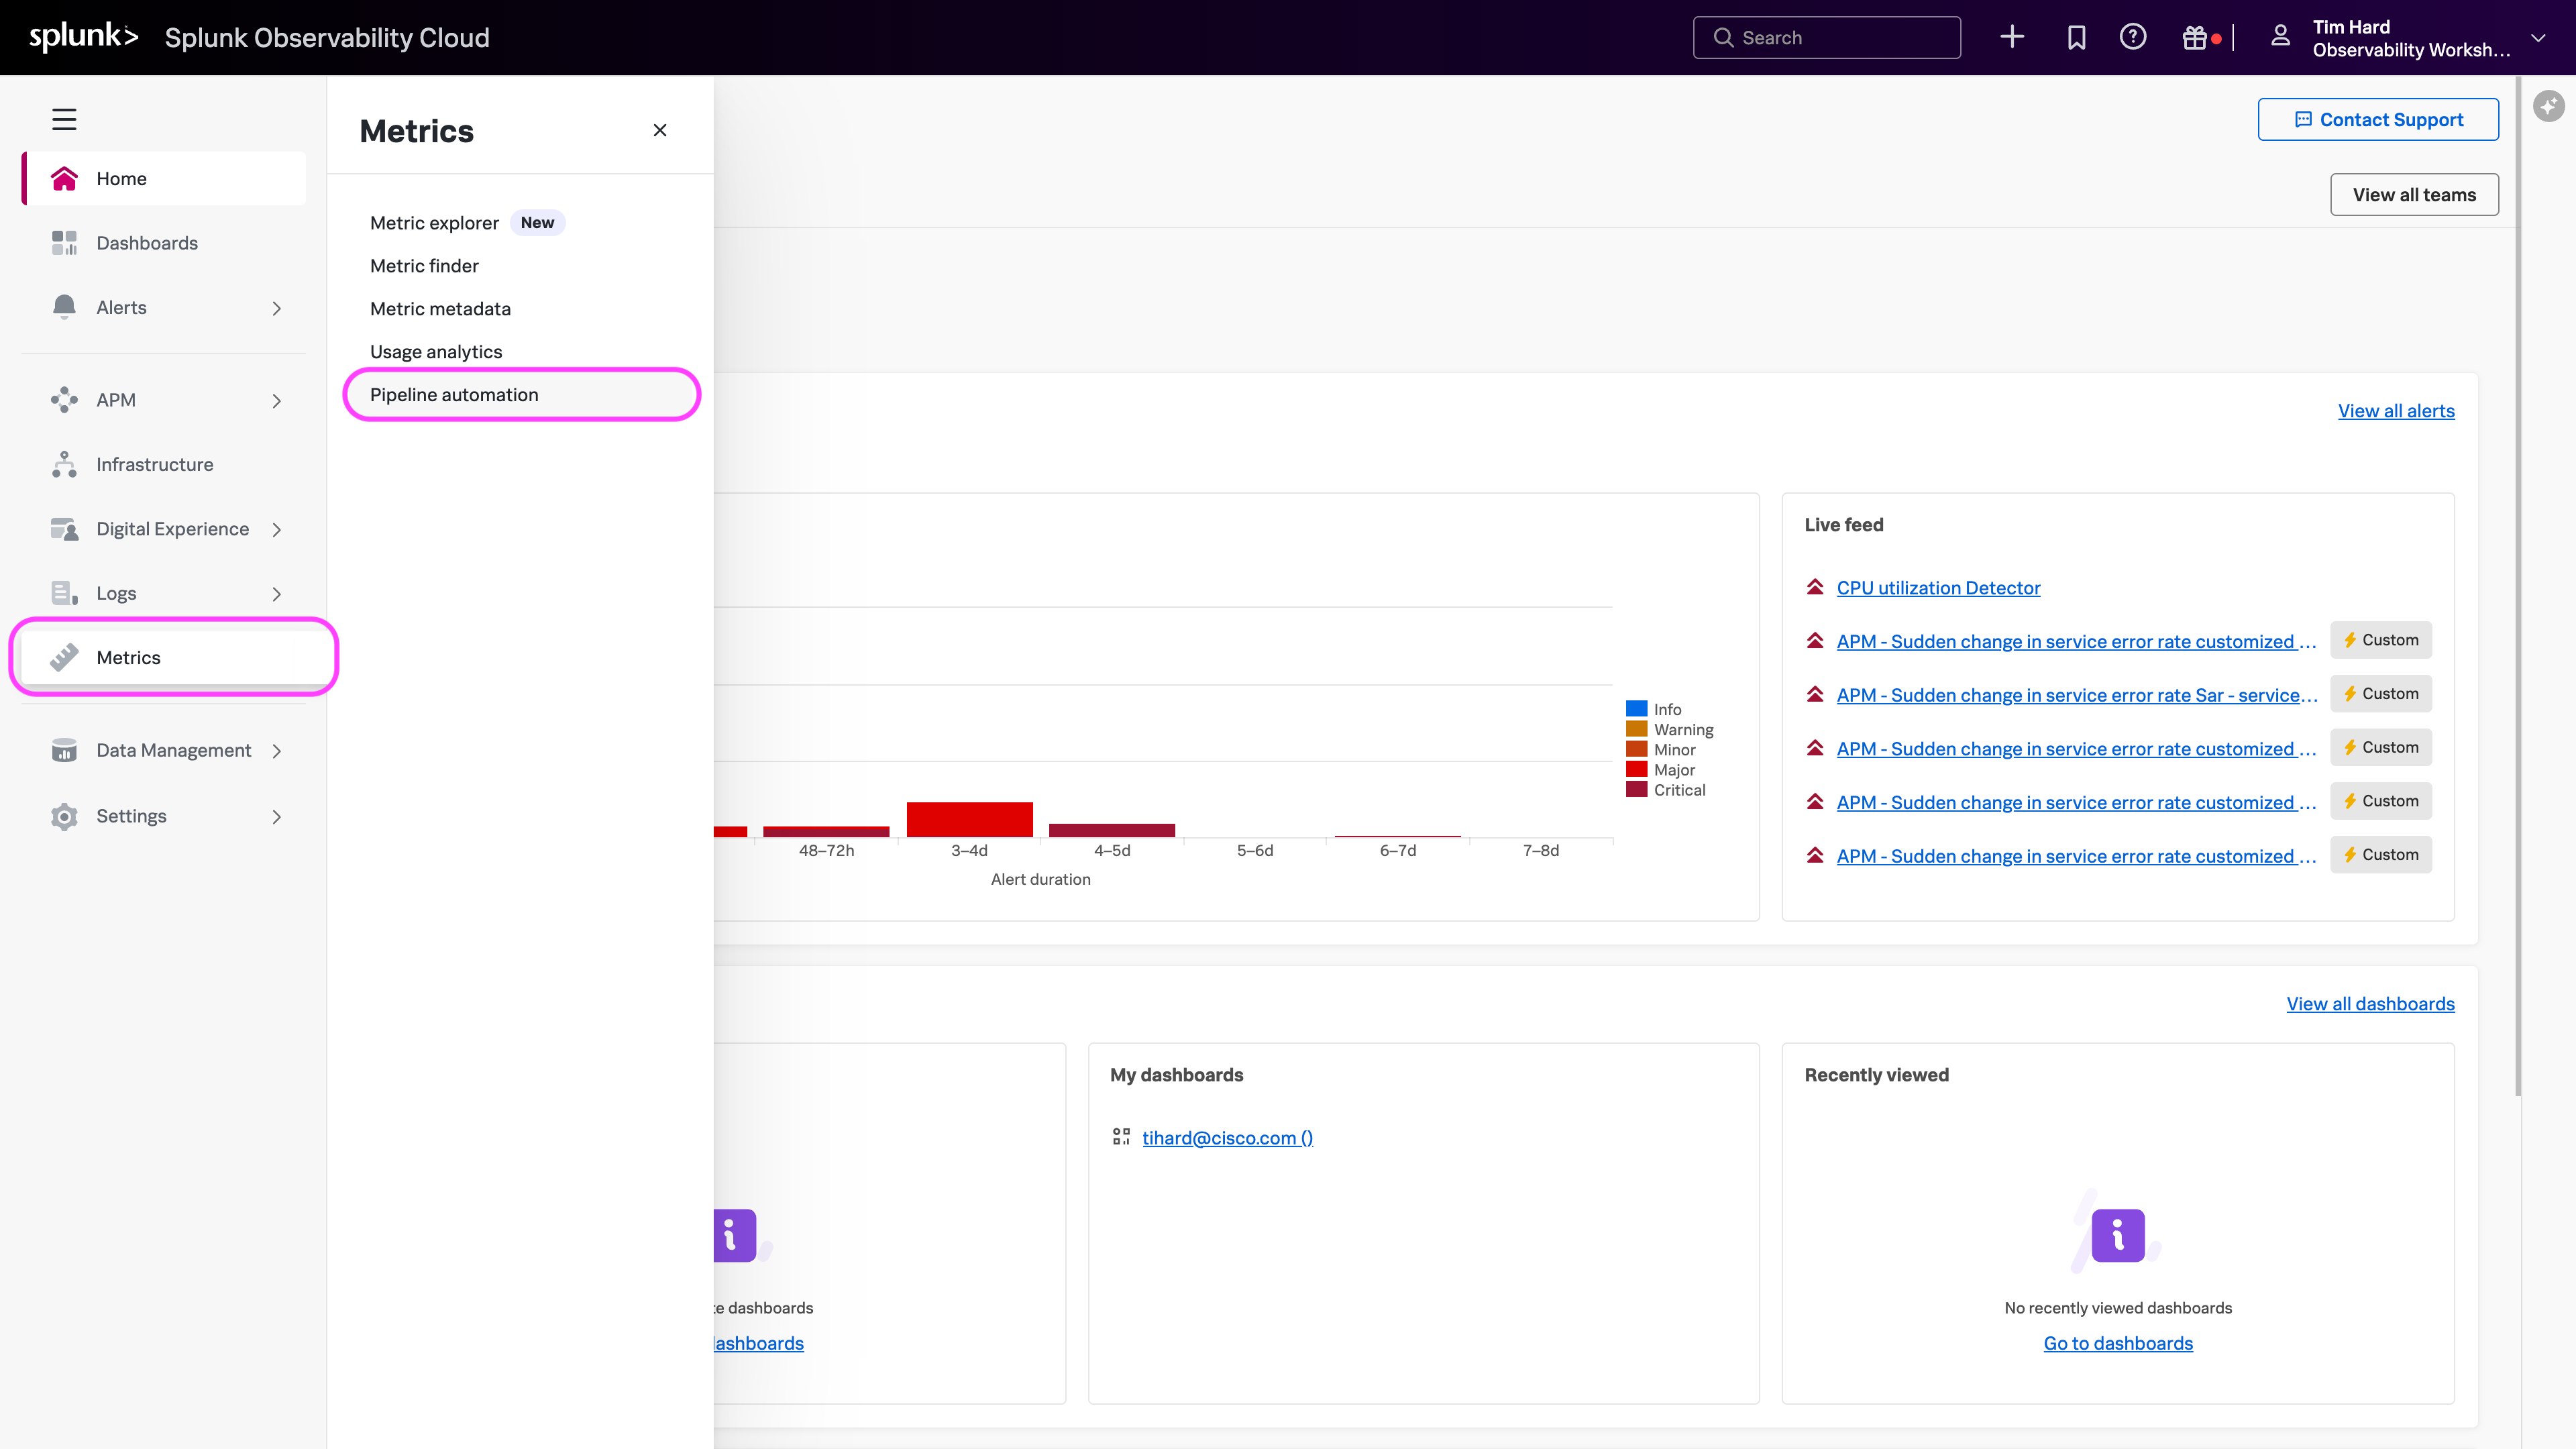
2. Select Pipeline Management in the row across the top of the page.
3. On the Pipeline Management page, click the Choose a metric button.
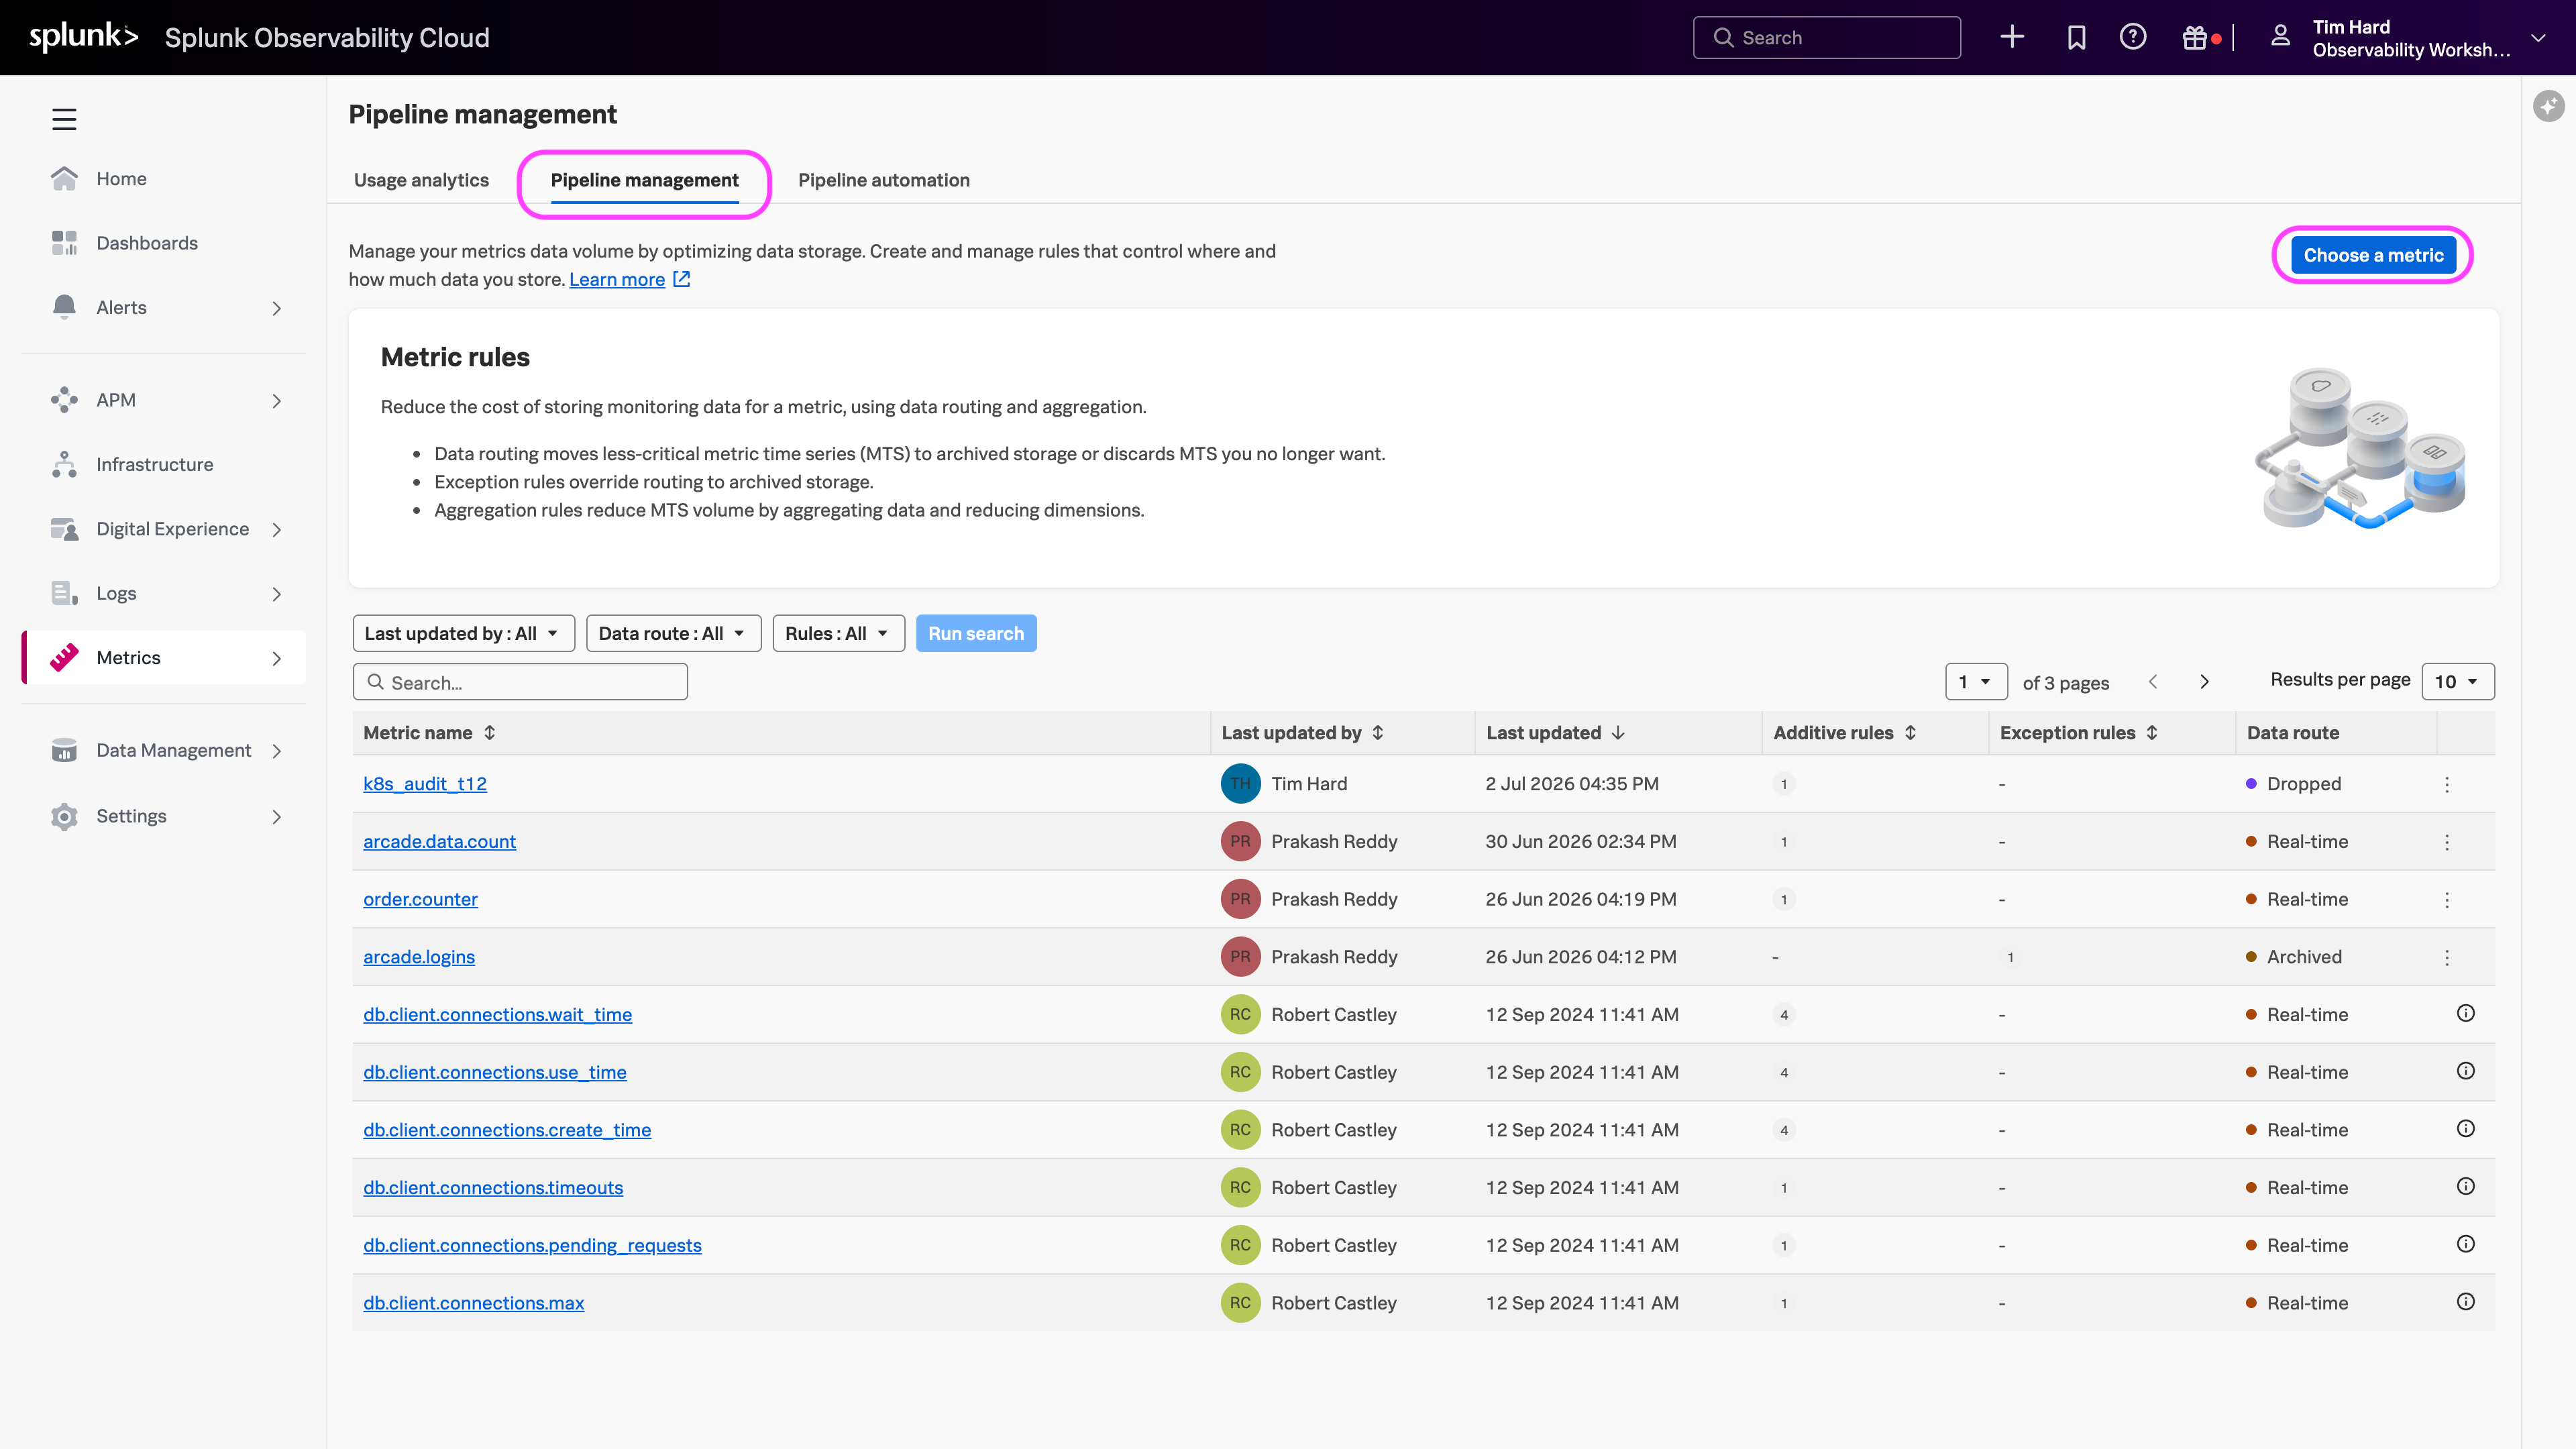
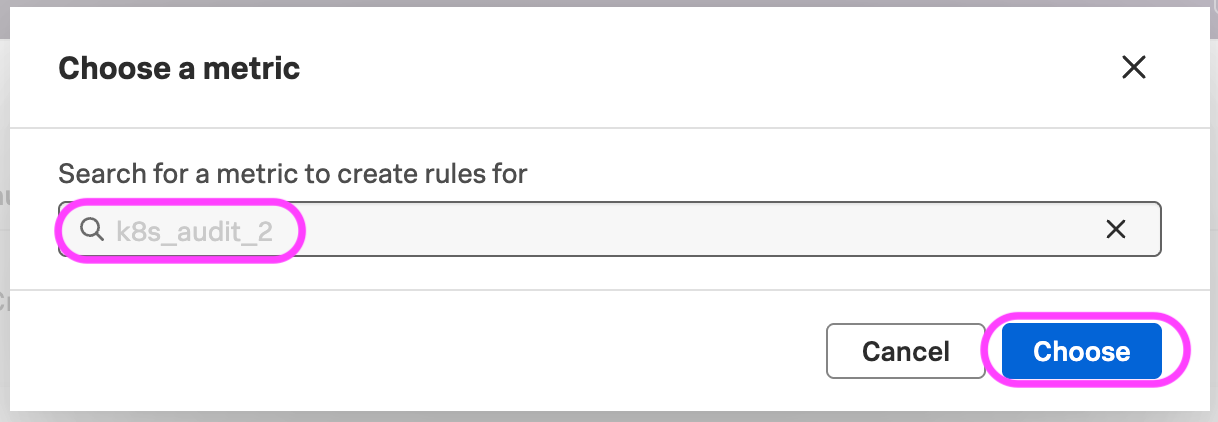
4. In the Choose a metric pop-up, enter the name of the metric you created in the Ingest Processor Pipeline (for example, k8s_audit_2) and click Choose.
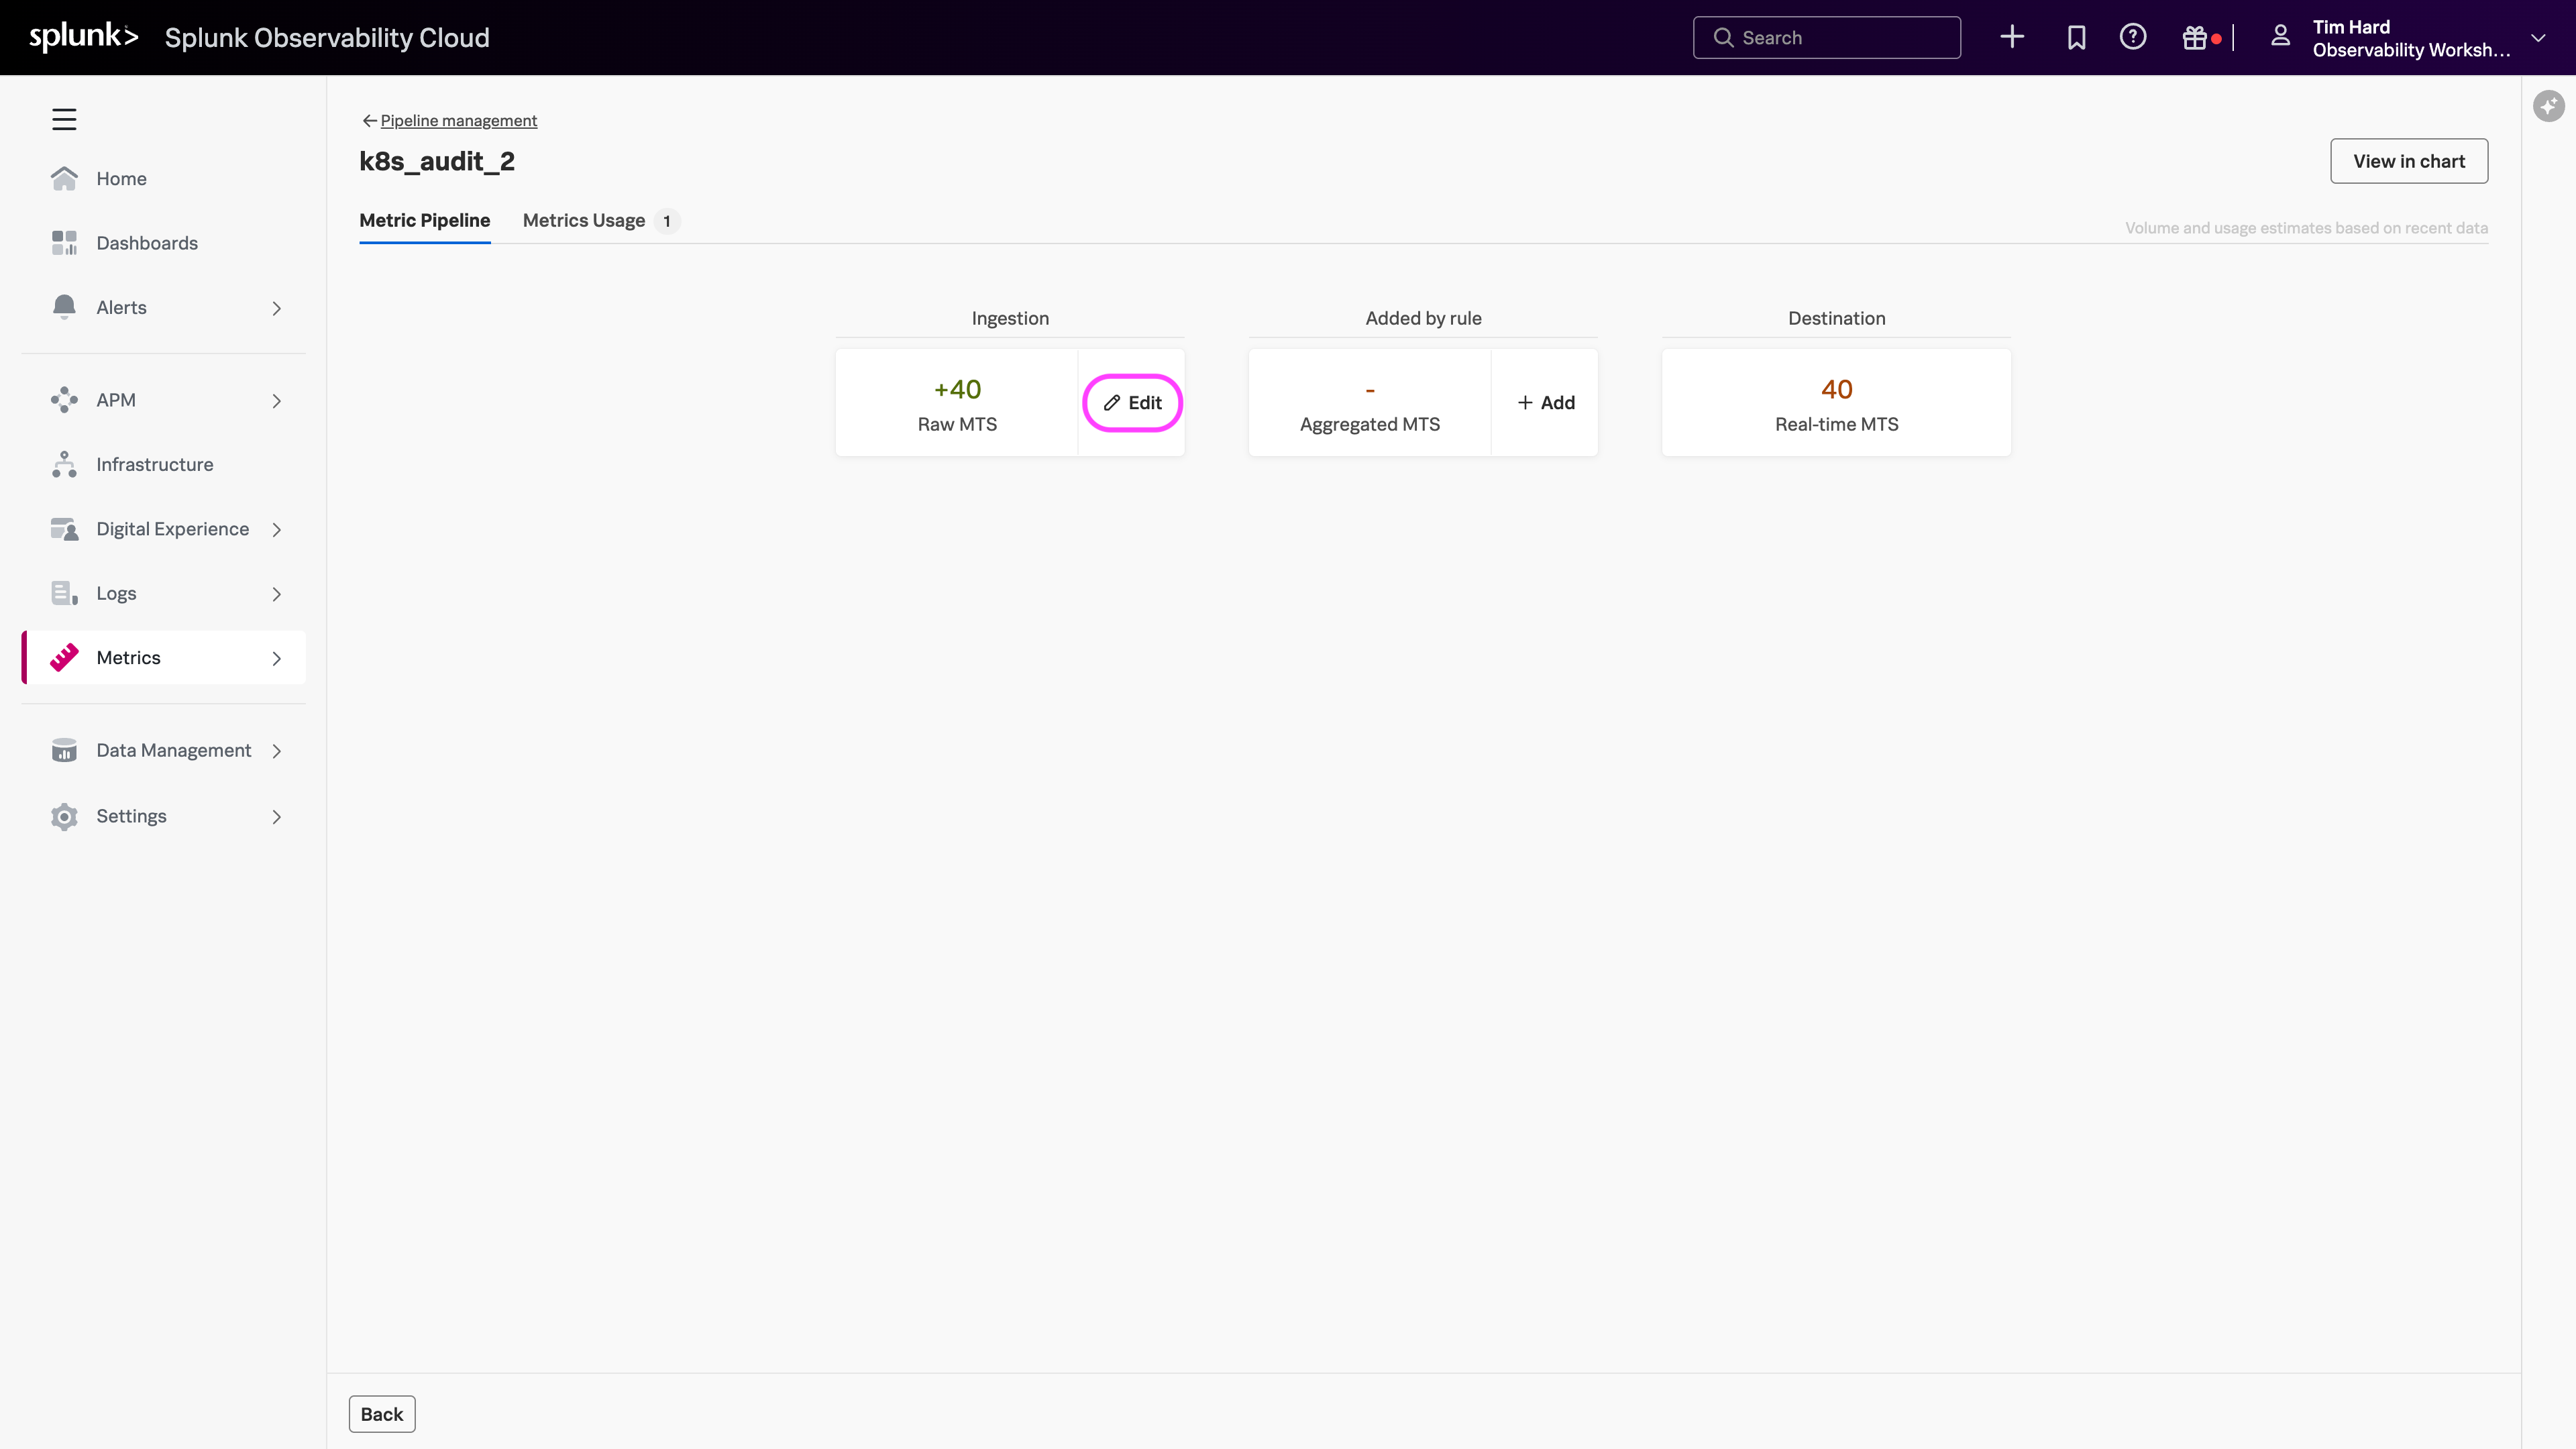
5. In the Ingestion section, next to Raw MTS, click Edit.
Info
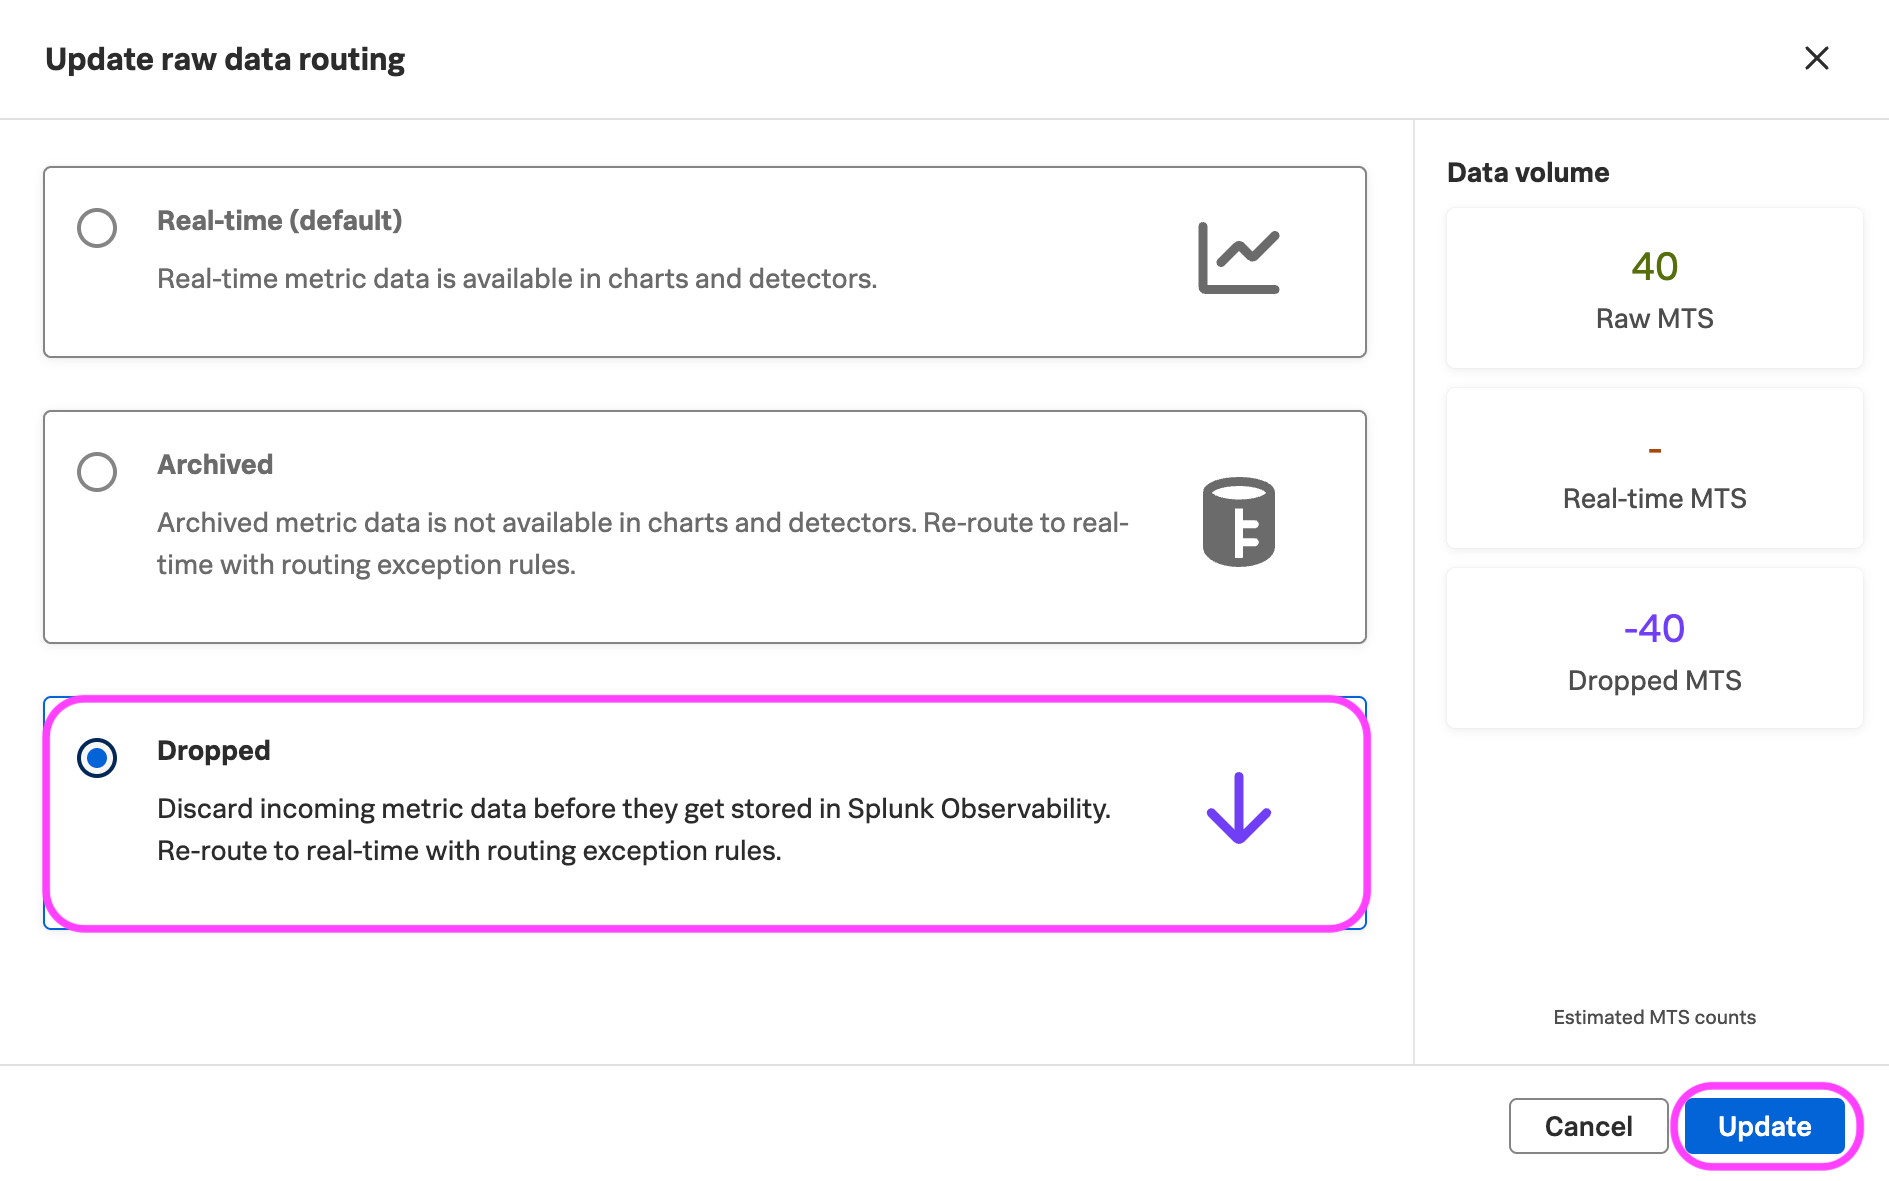
6. On the Update raw data routing modal, select Dropped. This discards the incoming metric data before it is stored in Splunk Observability Cloud. If you ever need a specific MTS restored, you can re-route it to real-time using routing exception rules. Click Update then Enable to activate the update.
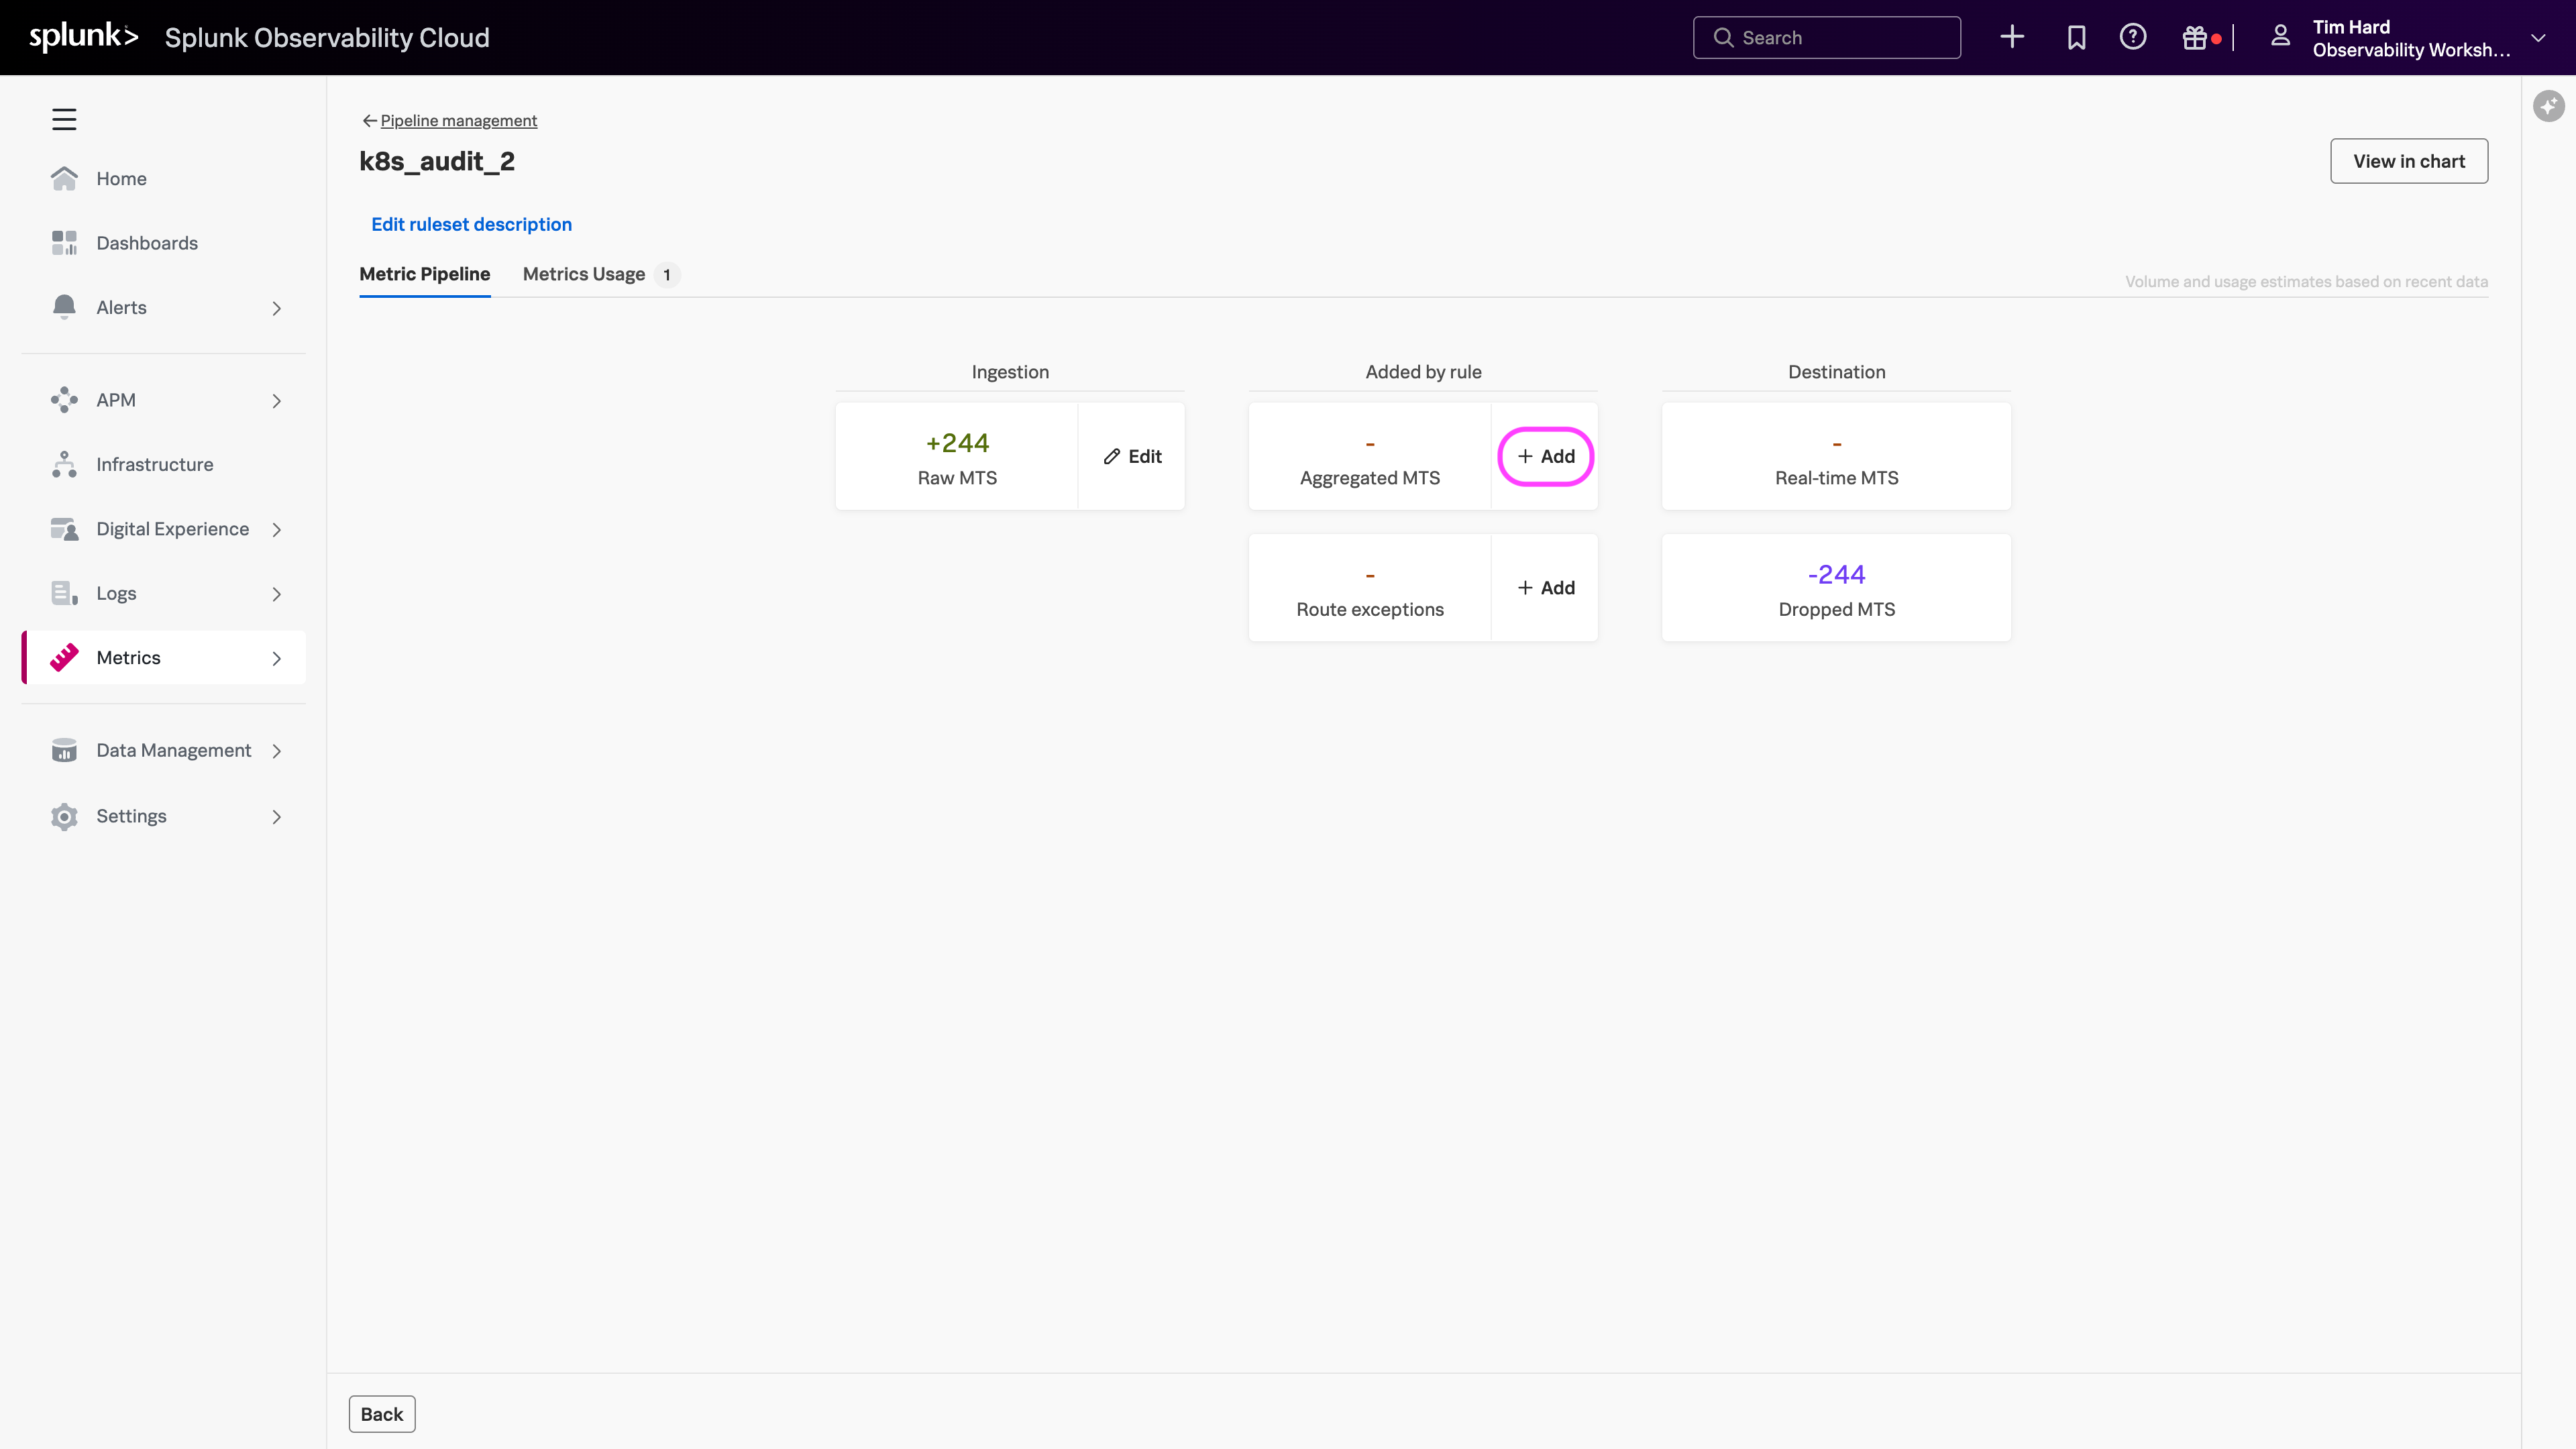
7. In the Added by rule section, click + Add to create a new aggregation rule.
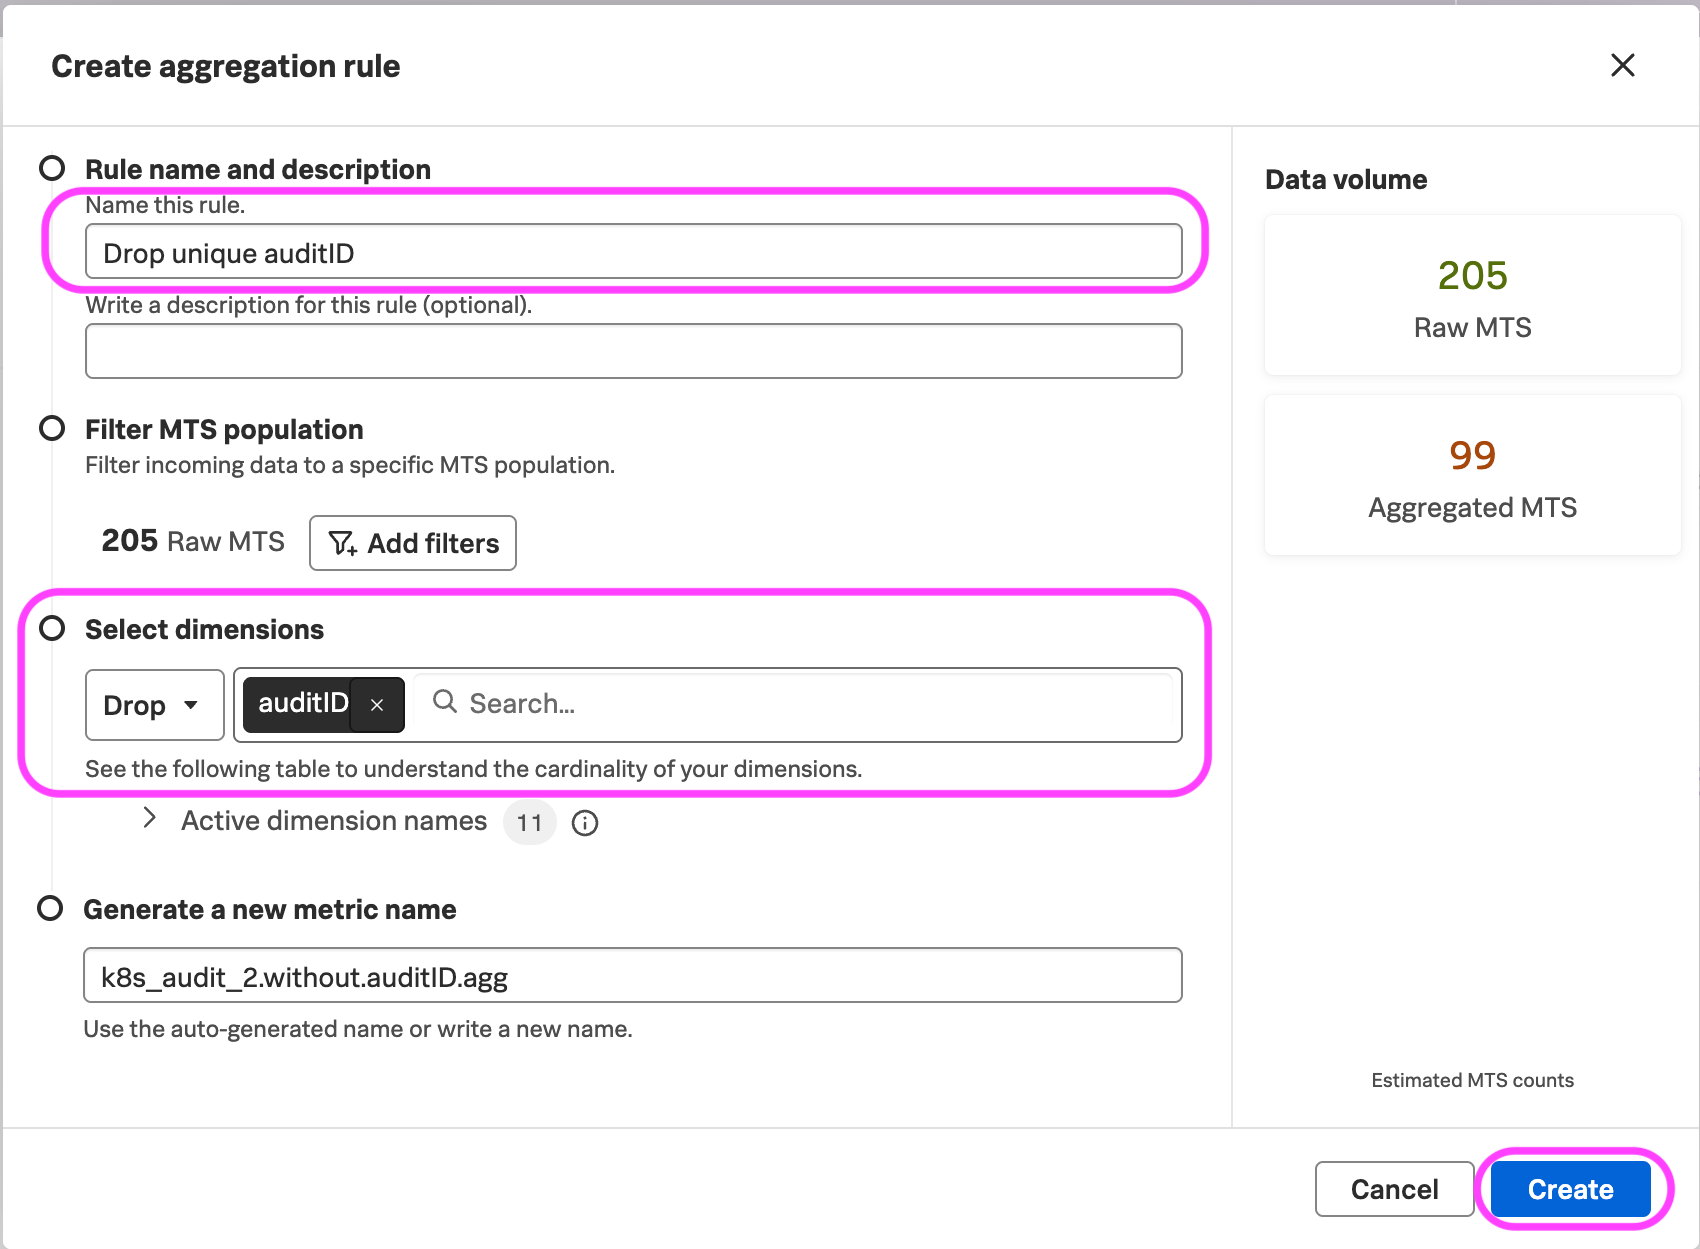
8. In the Create aggregation rule modal, enter Drop unique auditID for the name.
9. In the Select dimensions section, change the value in the dropdown from Keep to Drop and use the search bar to select auditID.
Note
auditID. You will use this aggregated metric in the next section when you create a visualization.10. Review the Data volume section, which shows the unaggregated Raw MTS and the Aggregated MTS. Here you can see the exact reduction in MTS that results from dropping the auditID dimension. This is the utilization you are reclaiming, all without changing anything at the ingest endpoint.
11. Click Create.
Note
You have now aggregated your metric into a new, lower-cardinality metric and dropped the raw metric that included the unique auditID dimension. You did all of this from the Splunk Observability Cloud UI, without making any changes to the Ingest Processor Pipeline or the systems sending the data.
In the next step you will create a visualization using the aggregated metric.