

Creating Basic Alerts
Setting Up Basic Alerts in Splunk Enterprise, AppDynamics, and Splunk Observability Cloud #
This section covers the creation of basic alerts in Splunk Enterprise, AppDynamics, and Splunk Observability Cloud. These examples focus on simplicity and demonstrating the core concepts. Remember that real-world alerting scenarios often require more complex configurations and thresholds.
1. Splunk Enterprise Alerts #
Splunk alerts are triggered by search results that match specific criteria. We’ll create a real-time alert that notifies us when a certain condition is met.
Scenario: Alert when the number of “Invalid user” events in the “main” index exceeds 100 in the last 5 minutes.
Steps:
Create a Search: Start by creating a Splunk search that identifies the events you want to alert on. For example:
splunkindex=main "Invalid user"Use the time picker to select “Last 15 minutes”".
Configure the Alert:
- Click “Save As” and select “Alert.”
- Give your alert a descriptive name (e.g., “Numerous Invalid User Logins Attempted”).
- Alert type:
- Scheduled: Choose “Scheduled” to evaluate the search on a set schedule. Below scheduled will be the button to select the frequency, select “Run on Cron Schedule”.
- Cron Expression: /15 ** *
- Triggered when: Select “Number of results” “is greater than” “100.”
- Time Range: Set to “15 minutes.”
- Trigger Actions:
- For this basic example, choose “Add to Triggered Alerts.” In a real-world scenario, you’d configure email notifications, Slack integrations, or other actions.
- Save: Save the alert.
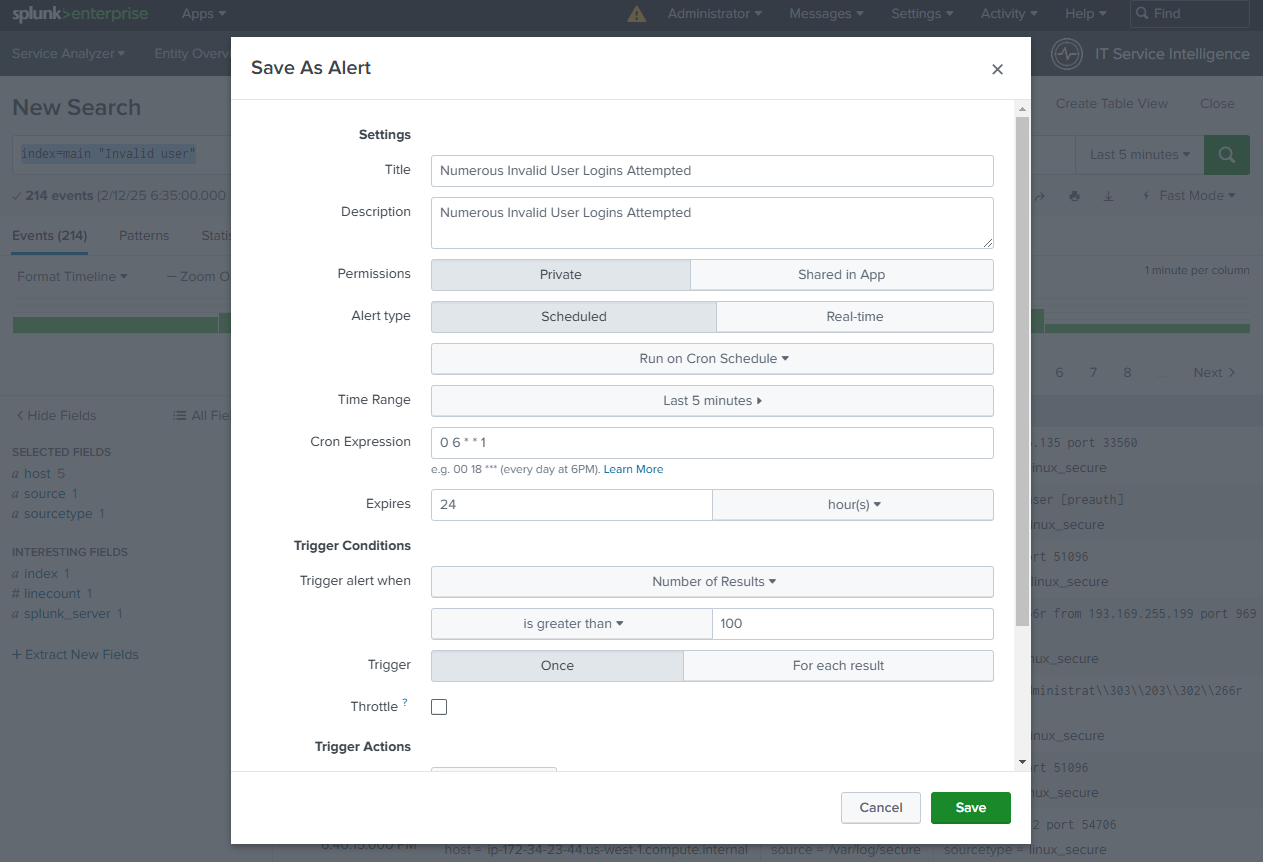
Explanation: This alert runs the search every 15 minutes and triggers if the search returns more than 100 results. The “Add to Triggered Alerts” action simply adds a Alert to the Splunk Triggered Alerts list.
Time Ranges and Frequency: Since everything in Splunk core is a search, you need to consider the search timespan and frequency so that you are not a) searching the same data multiple times with an overlap timespan, b) missing events because of a gap between timespan and frequency, c) running too frequently and adding overhead or d) running too infrequently and experiencing delays in alerting.
2. Splunk Observability Cloud Alerts (Detectors) #
Create a Detector:
- Click “Detectors & SLOs” in the lefthand menu
- Click “Create Detector -> Custom Detector”
- Give the detector a descriptive name (e.g., “High CPU Utilization Alert - INITIALS”).
- Signal:
- Select the metric you want to monitor (“cpu.utilization”).
- Add any necessary filters to specify the host (
service.name:otelshop-loadgenerator). - Click “Proceed to Alert Condition”
- Condition:
- Select Static Threshold
- Set the threshold: “is above” “90”
- Notifications:
- For this example, choose a simple notification method (e.g., a test webhook). In a real-world scenario, you would configure integrations with PagerDuty, Slack, or other notification systems.
- Save: Save the detector.
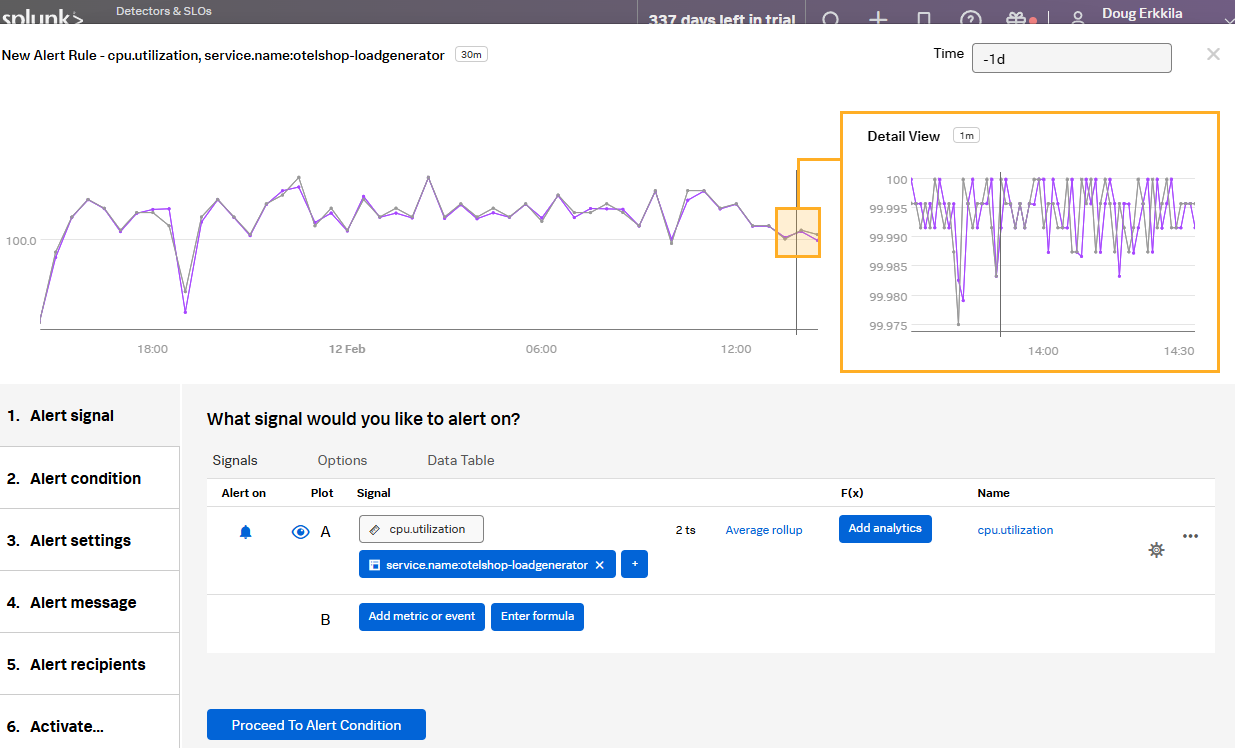
Explanation: This detector monitors the CPU utilization metric for the specified service. If the CPU utilization exceeds 90% for the configured “for” duration, the detector triggers the alert and sends a notification.
Important Considerations for All Platforms:
- Thresholds: Carefully consider the thresholds you set for your alerts. Too sensitive thresholds can lead to alert fatigue, while thresholds that are too high might miss critical issues.
- Notification Channels: Integrate your alerting systems with appropriate notification channels (email, SMS, Slack, PagerDuty) to ensure that alerts are delivered to the right people at the right time.
- Alert Grouping and Correlation: For complex systems, implement alert grouping and correlation to reduce noise and focus on actionable insights. ITSI plays a critical role in this.
- Documentation: Document your alerts clearly, including the conditions that trigger them and the appropriate response procedures.
These examples provide a starting point for creating basic alerts. As you become more familiar with these platforms, you can explore more advanced alerting features and configurations to meet your specific monitoring needs.