

Zero Touch Event Analytics with ITSI 5.0
Find the payment services and raw alerts
Locate the supplied service context and inspect the signals you will bring into ITSI.
Before you configure an alert connection, get familiar with the environment it will support. You will locate the three payment services, then inspect their raw records. This gives you a reference for checking whether the normalized alerts still describe the original symptoms correctly.
Inspect the service context #
1. Sign in to the Splunk instance using the URL and credentials supplied by the instructor. Open IT Service Intelligence.
2. Go to Service Analyzer → Default Analyzer.
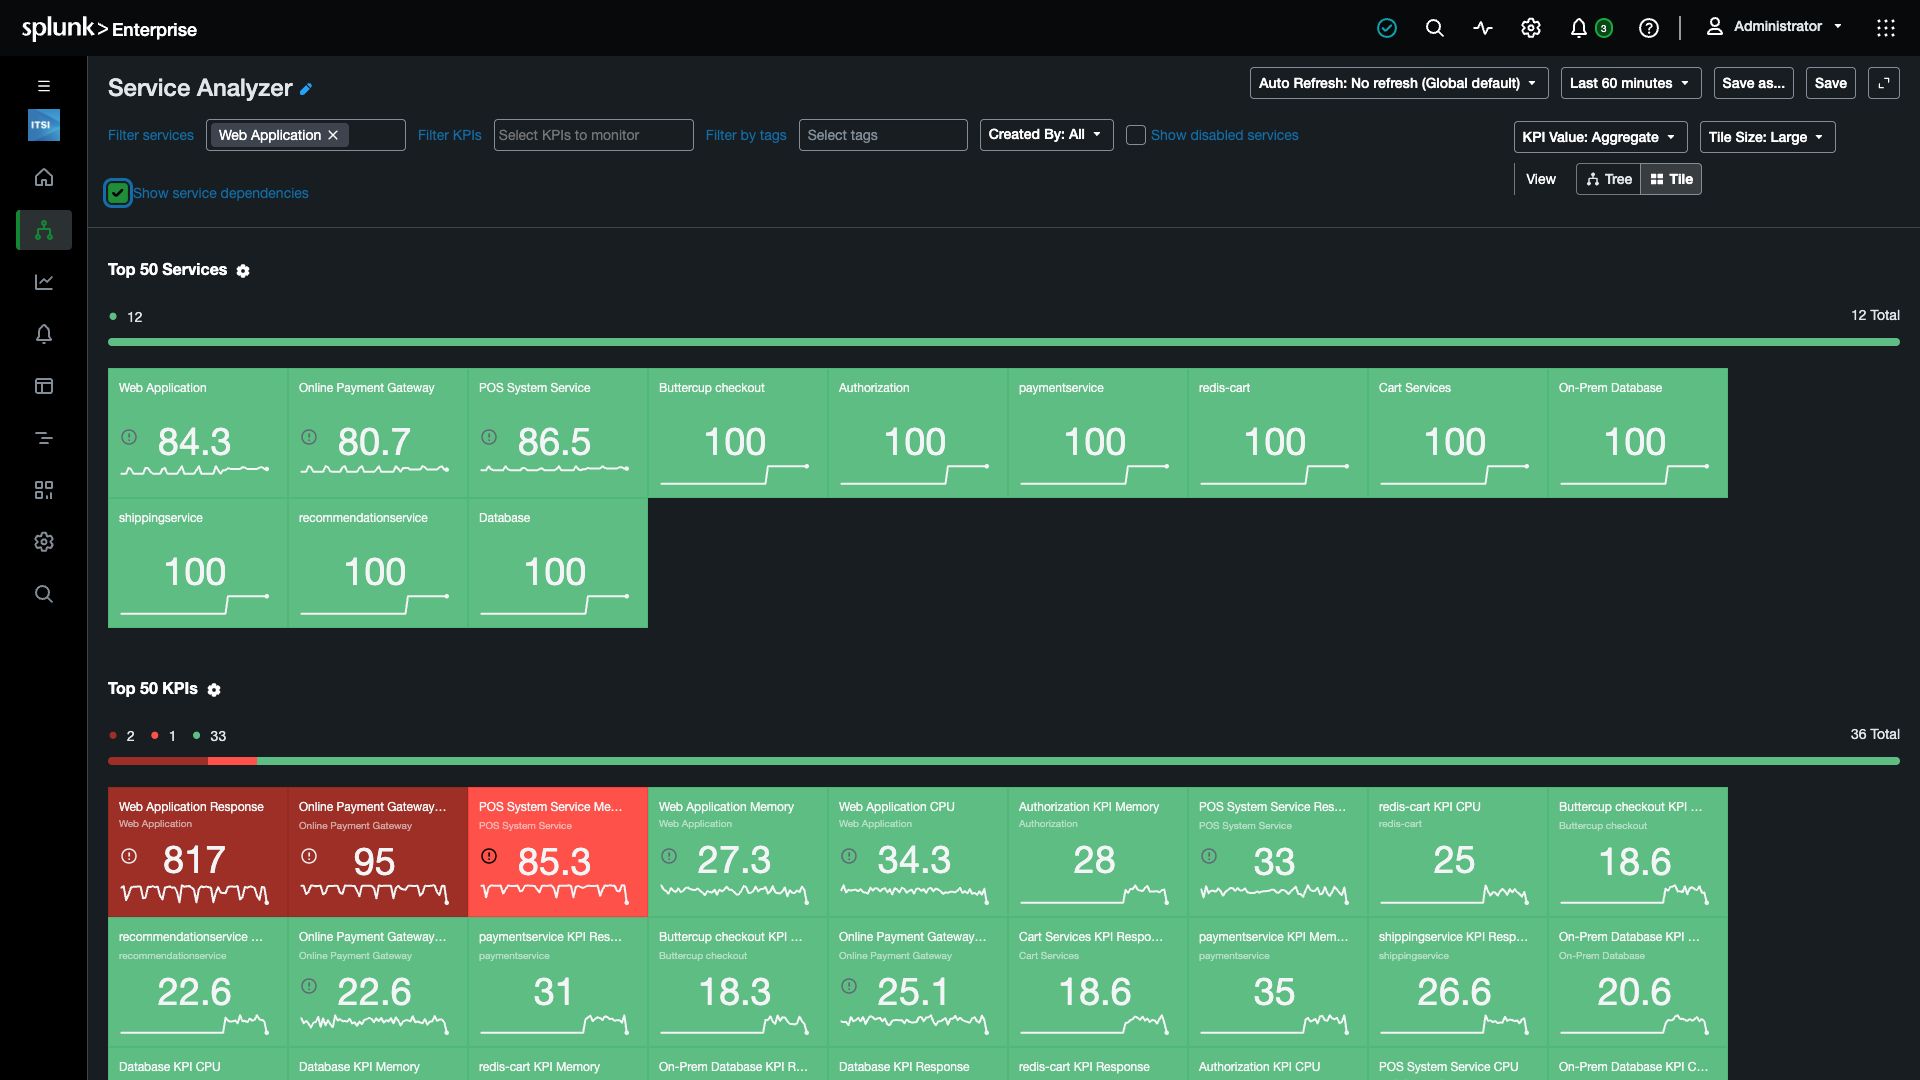
3. In Filter services, type and select Web Application. Select Show service dependencies to include the services it depends on.
Review the Tile View to see the selected service, its dependencies, and their KPIs. These measurements help you connect an alert with the customer experience it can affect. Service colors and values change as the data updates.
The dependency view includes other retail services. This exercise follows the three payment services within that wider context.
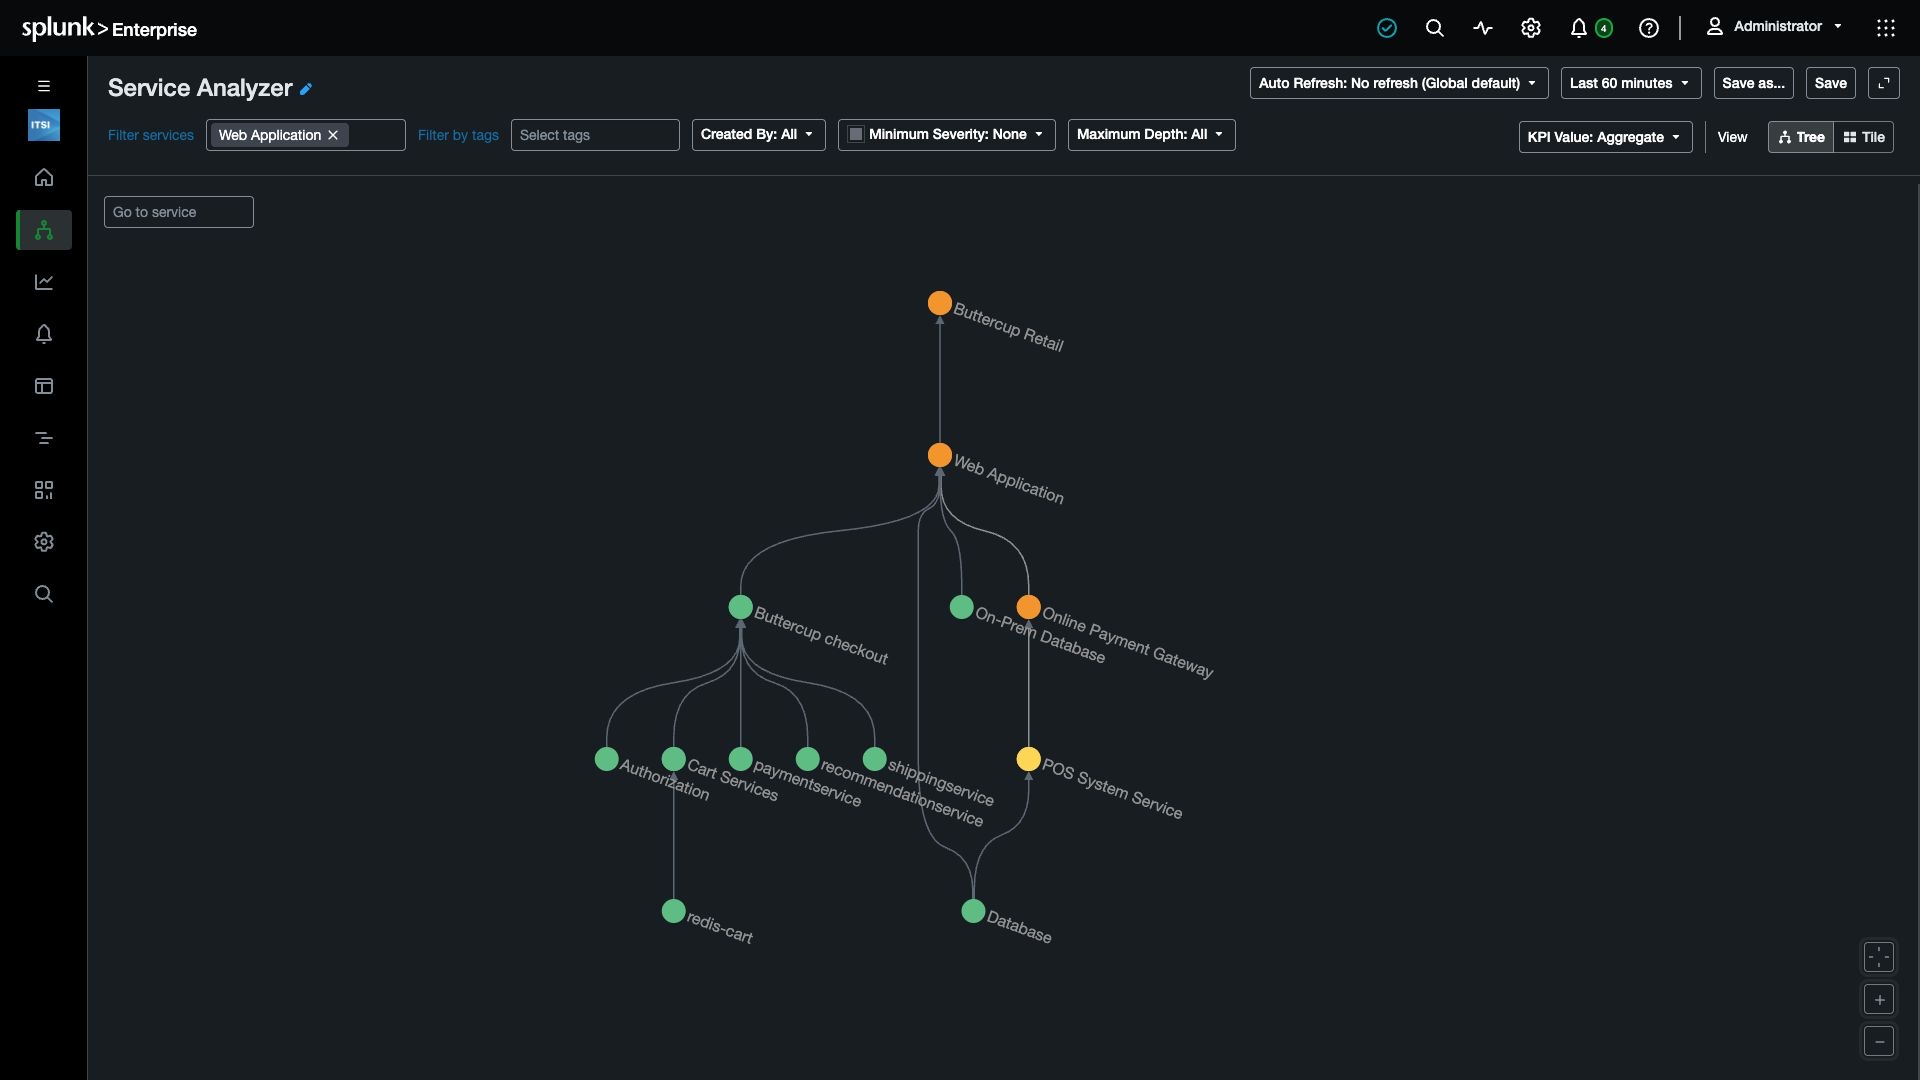
4. Switch to Tree View. Follow the dependencies from Web Application to Online Payment Gateway and POS System Service. A checkout delay can be the visible effect of a problem in a service farther down this chain. The tree gives responders that context before they begin investigating individual alerts.
Inspect the source records #
5. Select Search in the left navigation and paste this search:
index=test_event_index sce=POS_CUST_*
| eval extracted_host=mvindex(extracted_host,0)
| table _time message service extracted_host event_severity_type sce
6. Set the time picker to Presets → Last 15 minutes, select Search, then open the Statistics tab.
Info
7. Inspect one gateway record and one POS or web record. Use these fields to understand each signal:
| Field | What to look for |
|---|---|
_time | When the record occurred. |
message | The symptom the record describes. |
service | The service reporting the symptom. |
extracted_host | The host you will associate with an ITSI entity. |
event_severity_type | The source severity, such as Error or Medium. |
sce | The incident identifier used by this scenario. |
These events are separate alerts from different services. In the next step you will turn the selected records into notable events. Afterward, you will create a Notable Event Aggregation Policy that brings related alerts into a common episode.