

Zero Touch Event Analytics with ITSI 5.0
Onboard the payment alerts
Create a Generic connection and use AI-assisted validation to start mapping the existing payment data.
Data Integrations provide a guided way to bring alerts from monitoring tools and applications into ITSI Event Analytics. Each connection selects the incoming records, maps their fields, and controls when ITSI processes them. This gives operations teams a repeatable onboarding workflow and brings signals from different tools into a common place for triage and investigation. See the ITSI alert onboarding documentation .
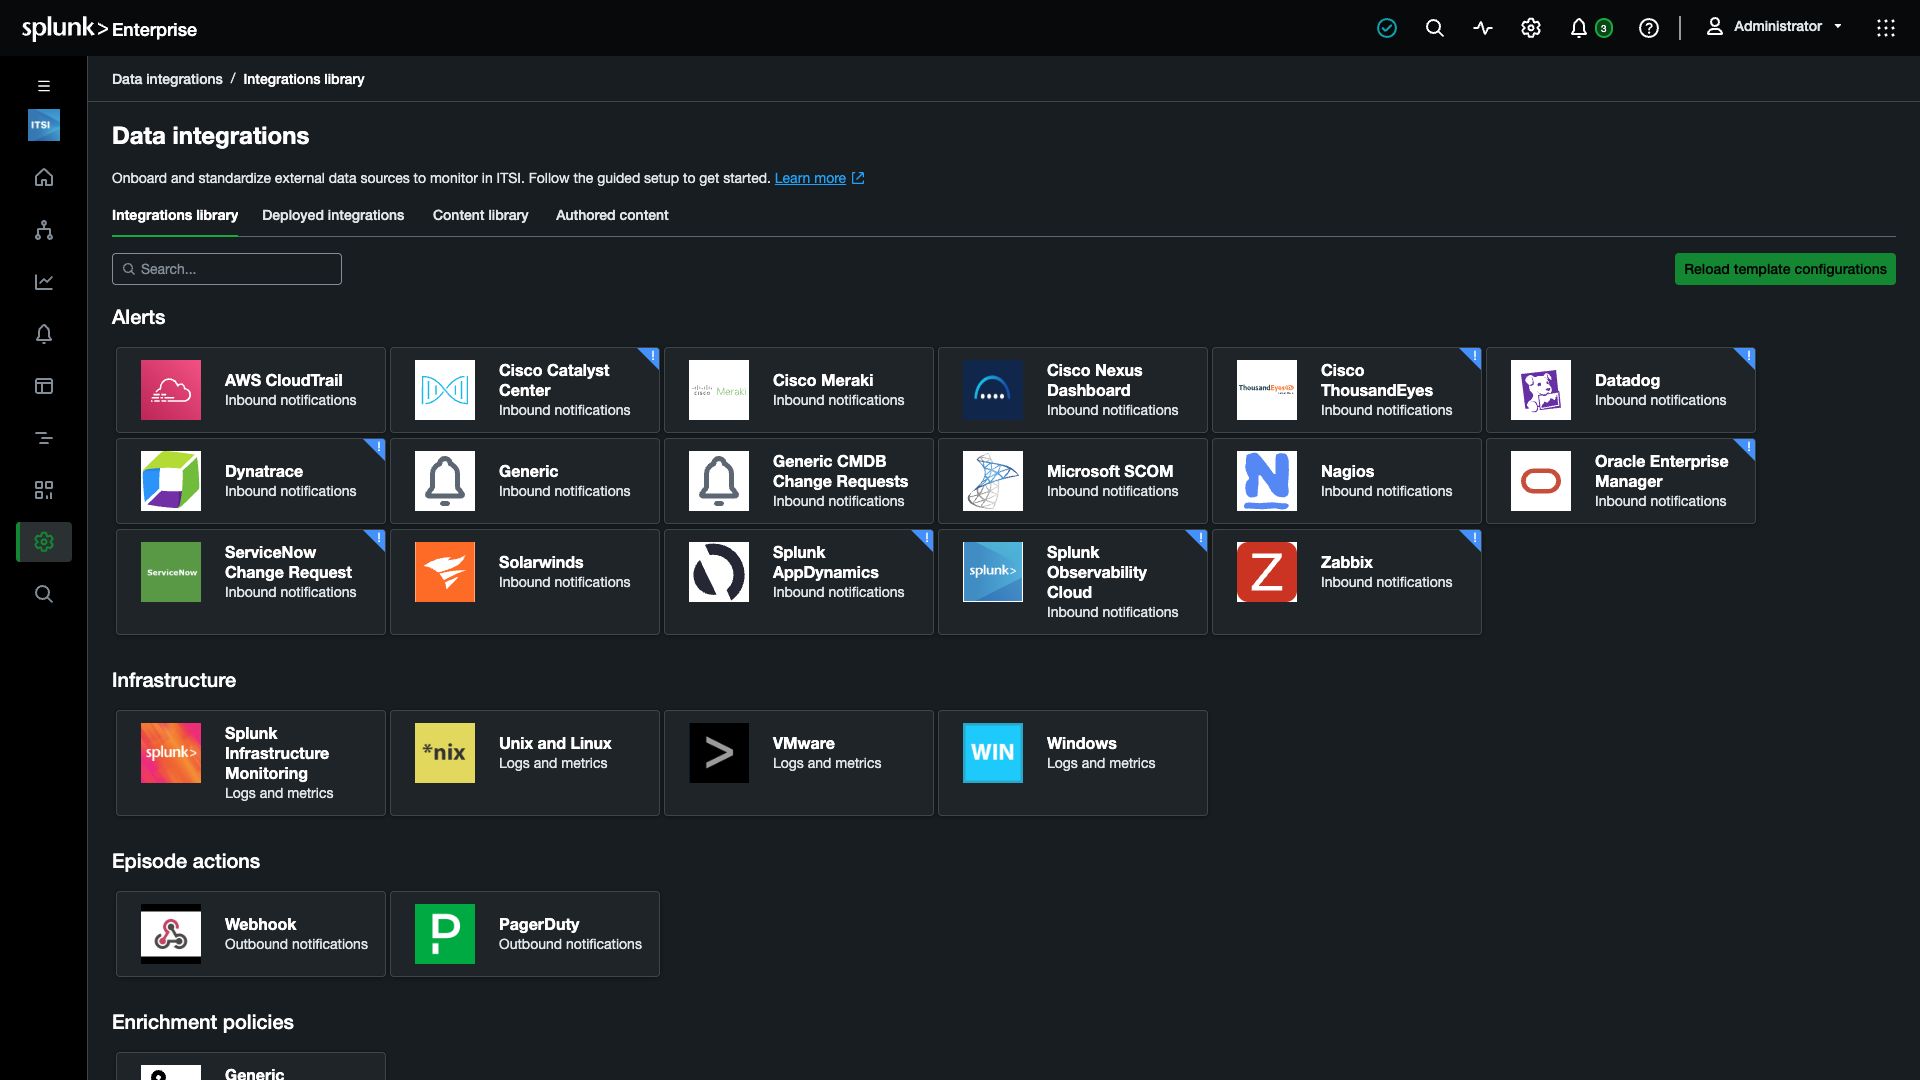
The integrations library includes templates for supported monitoring tools. In this workshop, you will use the Generic inbound notification to onboard custom payment alerts. Generic lets you define the source search and field mappings for alerts that do not have a dedicated vendor integration, such as those from a custom application.
The Scenario Generator has already indexed the payment signals in Splunk. You will create one connection to select those records and use AI-assisted validation to suggest their mappings. In the next exercise, you will review those mappings and activate the connection so that ITSI can use the alerts for grouping and investigation.
Select the alert data #
1. Open Configuration → Data Integrations. Under Integrations library → Alerts, select Generic.
The editor contains seven sections on one page: Define connection, Select data ingest method, Map data fields for ingest and configuration, Enrichment, Schedule, Association, and Throttling. You will continue using this same editor in the next exercise.
2. Under Define connection, enter WS50 Payment Alerts in Title.
Check the spelling before saving: connection titles cannot be renamed after creation.
3. Enter the following in the Search editor:
index=test_event_index sce=POS_CUST_*
| eval extracted_host=mvindex(extracted_host,0)
| table _time message service extracted_host event_severity_type sce
The search selects the payment incident family. It keeps the fields needed to describe an alert and identify its source. The eval selects one host value where this data repeats the same alias.
Monitoring tools commonly send a clearing event when a condition returns to normal. Its format varies by tool: one source might send a recovery status, while another sends a particular message. ITSI can use that signal to automate the episode lifecycle, helping operators keep their queue focused on incidents that still need attention.
The payment data includes a clearing signal with message=end. Keep it in the search results. Later, you will configure ITSI to group it with the related alerts, stop the episode collecting events, and automatically set the episode to Normal and Resolved.
Generate and inspect the suggestions #
4. Open the Validate dropdown, select Validate with AI, then click the Validate with AI button.
5. Inspect the returned sample and suggested mappings. Find a payment symptom, its service, and its host. Check that the results belong to the payment scenario.
AI assistance gives you a starting point for interpreting the source. Your next step is to review the fields that determine what an operator will see, especially severity and source identity.
6. Continue to Map data fields for ingest and configuration on the same page. Leave the connection editor open for the normalization exercise.
If AI validation reports an error, select Validate from the same dropdown and run standard validation, then use the explicit mappings in the next exercise. Standard validation makes the mapping editor available; it does not generate AI suggestions.
Checkpoint