

Zero Touch Event Analytics with ITSI 5.0
Group related alerts with EventiQ Detect
Bring payment, POS, and checkout symptoms together in an episode your operations team can investigate.
One failure can trigger alerts across several services and monitoring tools. Operators then have to separate repeated symptoms from distinct problems, identify the affected business service, and coordinate an investigation. Treating each alert as a separate incident adds noise and duplicates work.
EventiQ Detect uses AI-assisted recommendations and dynamic correlation to help group related alerts into episodes. Source identifiers, matching fields, and service relationships give operators context for understanding which symptoms belong together. An episode gives the team a shared place to assess impact and begin troubleshooting.
In this section, bring the gateway, POS, and checkout symptoms together. Then use a clearing event to automate the episode’s transition to Normal / Resolved, reducing manual cleanup when the source reports the end of an incident.
Configure the grouping policy #
1. Navigate to Configuration > Event Management > Notable Event Aggregation Policies and select Create Notable Event Aggregation Policy.
2. Under Include events, add the following filtering rule.
| Field | Operator | Value |
|---|---|---|
search_name | matches | DATA_INTEGRATION_CS-WS50 Payment Alerts |
This limits your policy to alerts from the connection you created.
3. Select Dynamic Correlation (EventiQ Detect) and turn Detect on. In Grouping fields, select 24 hours and the Splunk LLM model, then select Run analysis.
4. Review the recommended fields and matching methods. Look for familiar values such as service identifiers, source or entity fields, and your enrichment fields.
Info
Recommendations reflect the alerts available in the selected analysis window, so your field list and matching methods can differ from this example. Choosing 24 hours includes existing history in that window; a newly activated connection may only have a few minutes of normalized alerts.
On a new workshop instance, recently added fields may still report insufficient data. Leave those fields on Exact matching and continue. A notice that a field has only one unique value also supports Exact matching. For example, every alert may have business_criticality=High.
Review the meaning of each suggested field. Exact matching looks for equal values; an exact service or host match can collect repeated symptoms from that component, but different services have different names. A shared incident identifier provides a more direct link between those services. Enrichment fields such as a support team can add context, but a shared team alone does not prove that two alerts describe the same incident.
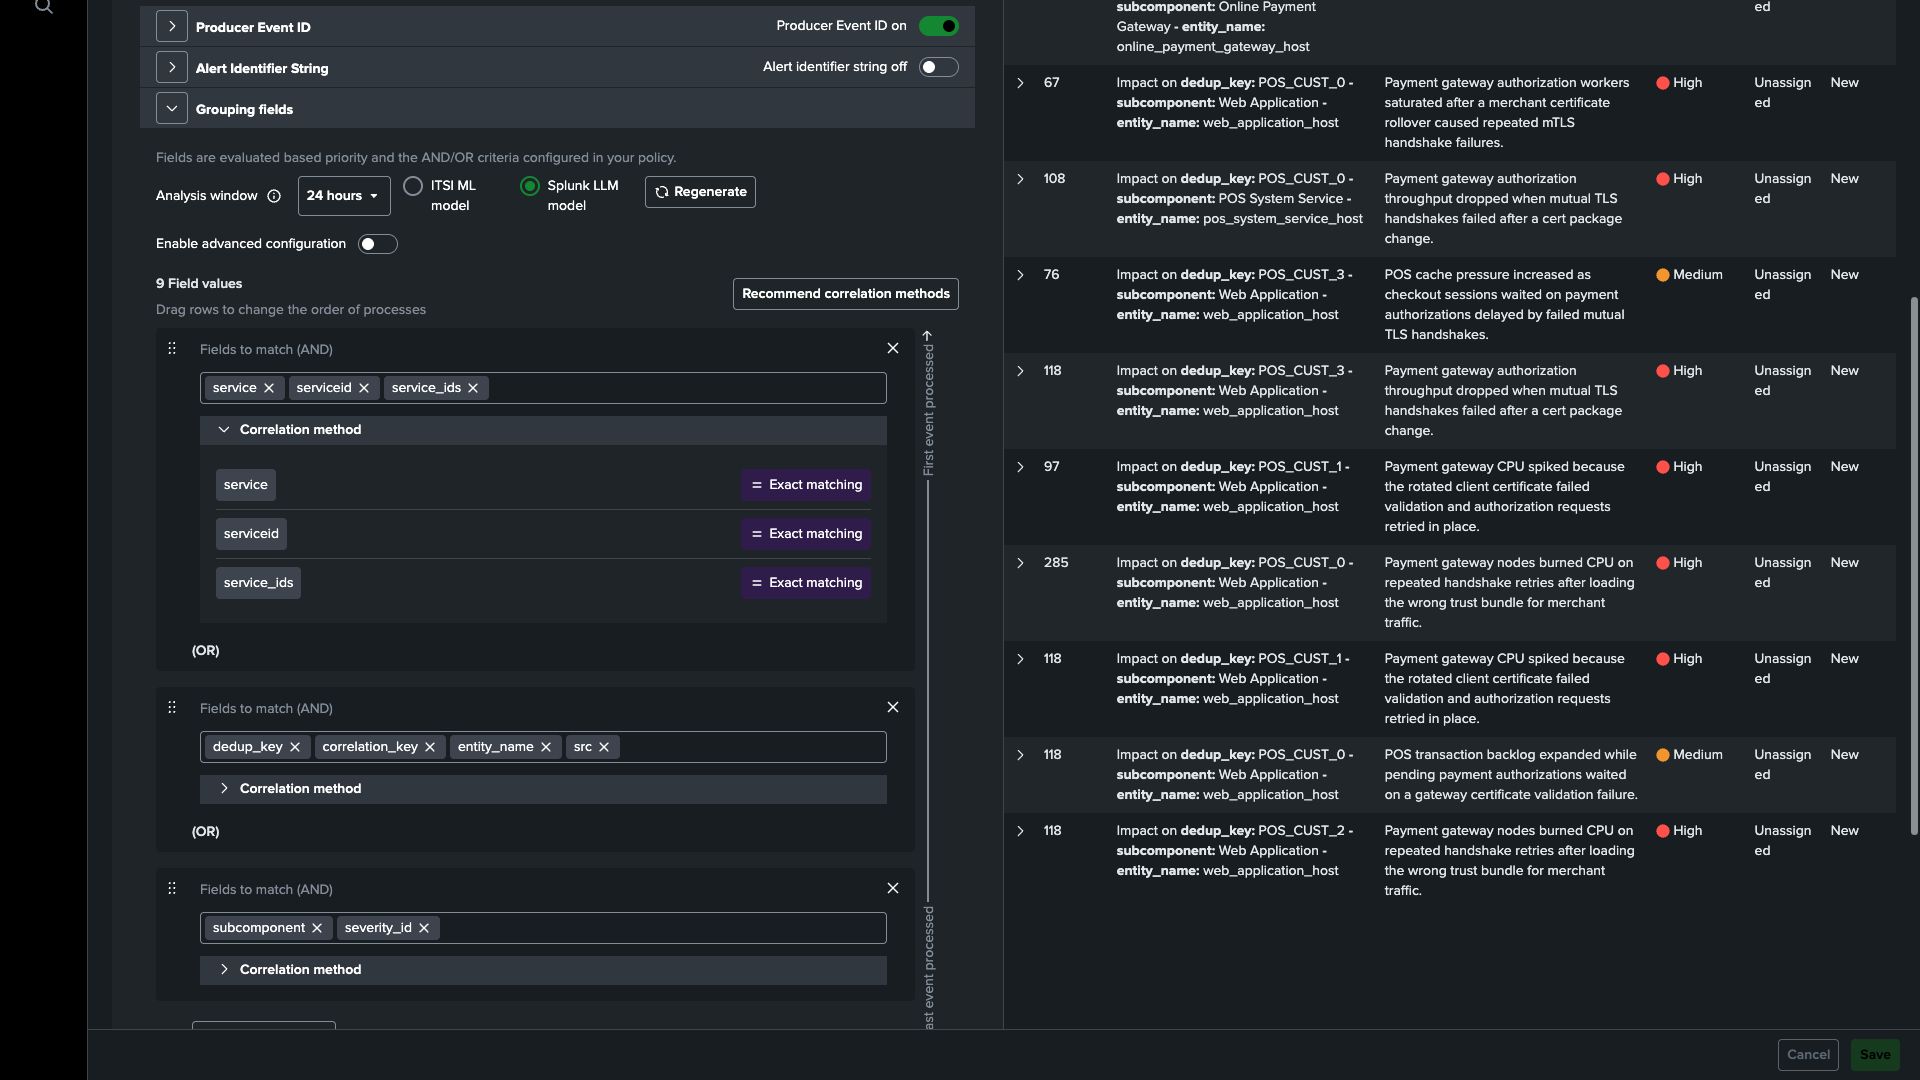
5. Under Group alerts into episodes based on, explicitly enable Producer Event ID and Service Topology.
In the normalization exercise, you mapped sce to Producer Event ID (producer_event_id). Confirm that this field is populated in your connection’s preview. The alerts and clearing marker for the same payment scenario carry this identifier across Online Payment Gateway, POS System Service, and Web Application. The policy can use that source-supplied value to join the symptoms, while Service Topology supplies their dependency context.
EventIQ Detect helps propose correlation settings. Review the resulting episode to establish whether those settings bring together the alerts you intended; grouping alone does not establish a root cause.
6. Select Preview results, below and to the right of Filtering Criteria, and choose Last 24 hours. Inspect the episode preview and expand a row to review its details.
The preview shows how matching history could be grouped. The live policy will process incoming alerts after you save it.
7. In the episode-breaking condition, replace the default severity Normal condition with:
| Field | Operator | Value |
|---|---|---|
message | matches | end |
Info
end marker arrives. The next cycle can form a new episode. Breaking an episode and changing its severity or status are separate operations; configure the lifecycle action next.Automate the episode lifecycle #
8. Select Next to open Action Rules, then select Add Rule. Set If to the following event occurs and enter:
| Field | Operator | Value |
|---|---|---|
message | matches | end |
9. Under Then, select Change severity to > Normal for the episode. Select and to add Change status to > Resolved, also for the episode. Leave Do not repeat selected.
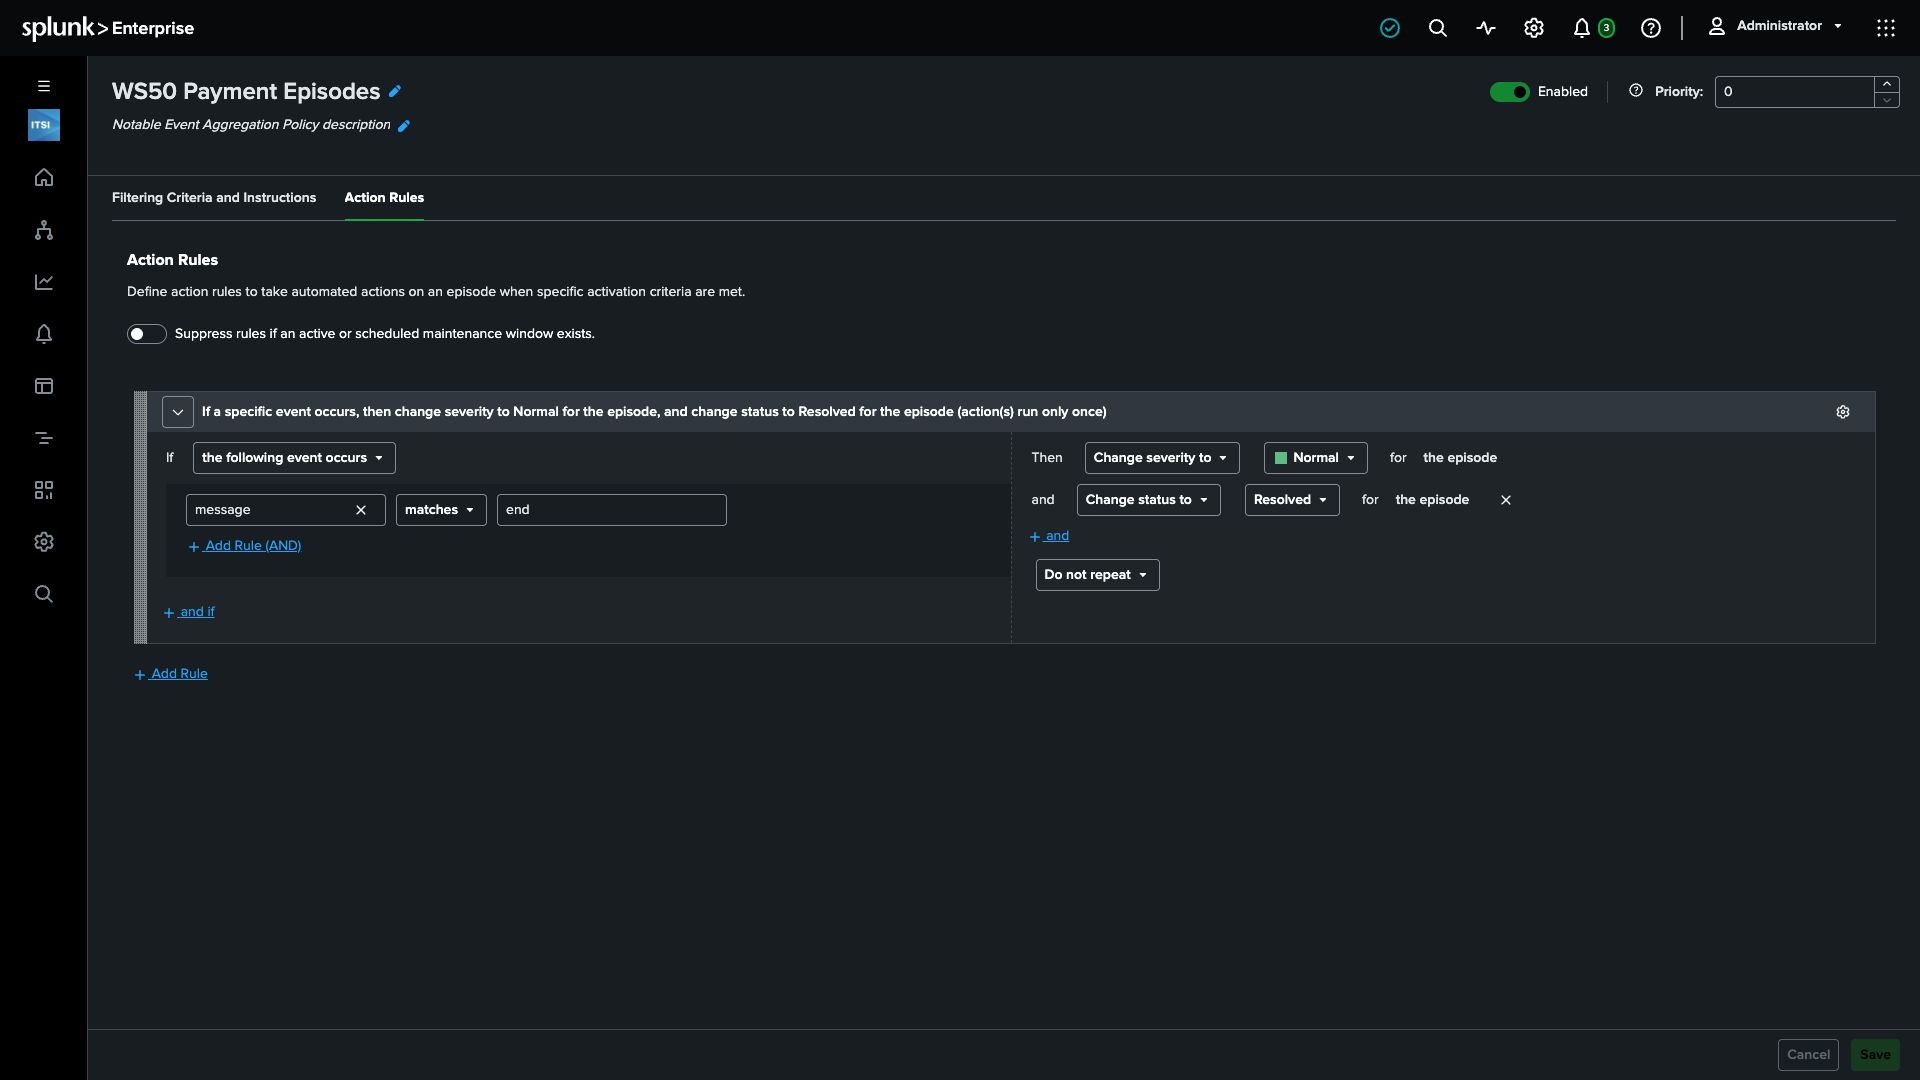
The same clearing event now stops collection and updates the episode’s operational state. In a deployment, configure this rule for the recovery signal supplied by the monitoring source. Operators can then spend less time closing incidents manually and more time checking recovery and preventing recurrence.
10. Select Next to open Policy Information. Enter the following values, leave the policy Enabled, and select Next to create it.
| Field | Value |
|---|---|
| Title | WS50 Payment Episodes |
| Description | Group payment incident alerts using EventiQ Detect and service topology. |
Review the resulting episode #
Tip
11. Select Alerts and Episodes in the left navigation to open Episode Review. Select Add filter > Policy, choose WS50 Payment Episodes, and open a newly generated episode.
12. Open Events Timeline. Find symptoms from Online Payment Gateway, POS System Service, and Web Application, and confirm that the applied policy is WS50 Payment Episodes. Scroll to the Events table and expand an alert row with the arrow in its first column. Review its message, source, severity, support_team, and business_criticality. Use an alert generated after you saved enrichment.
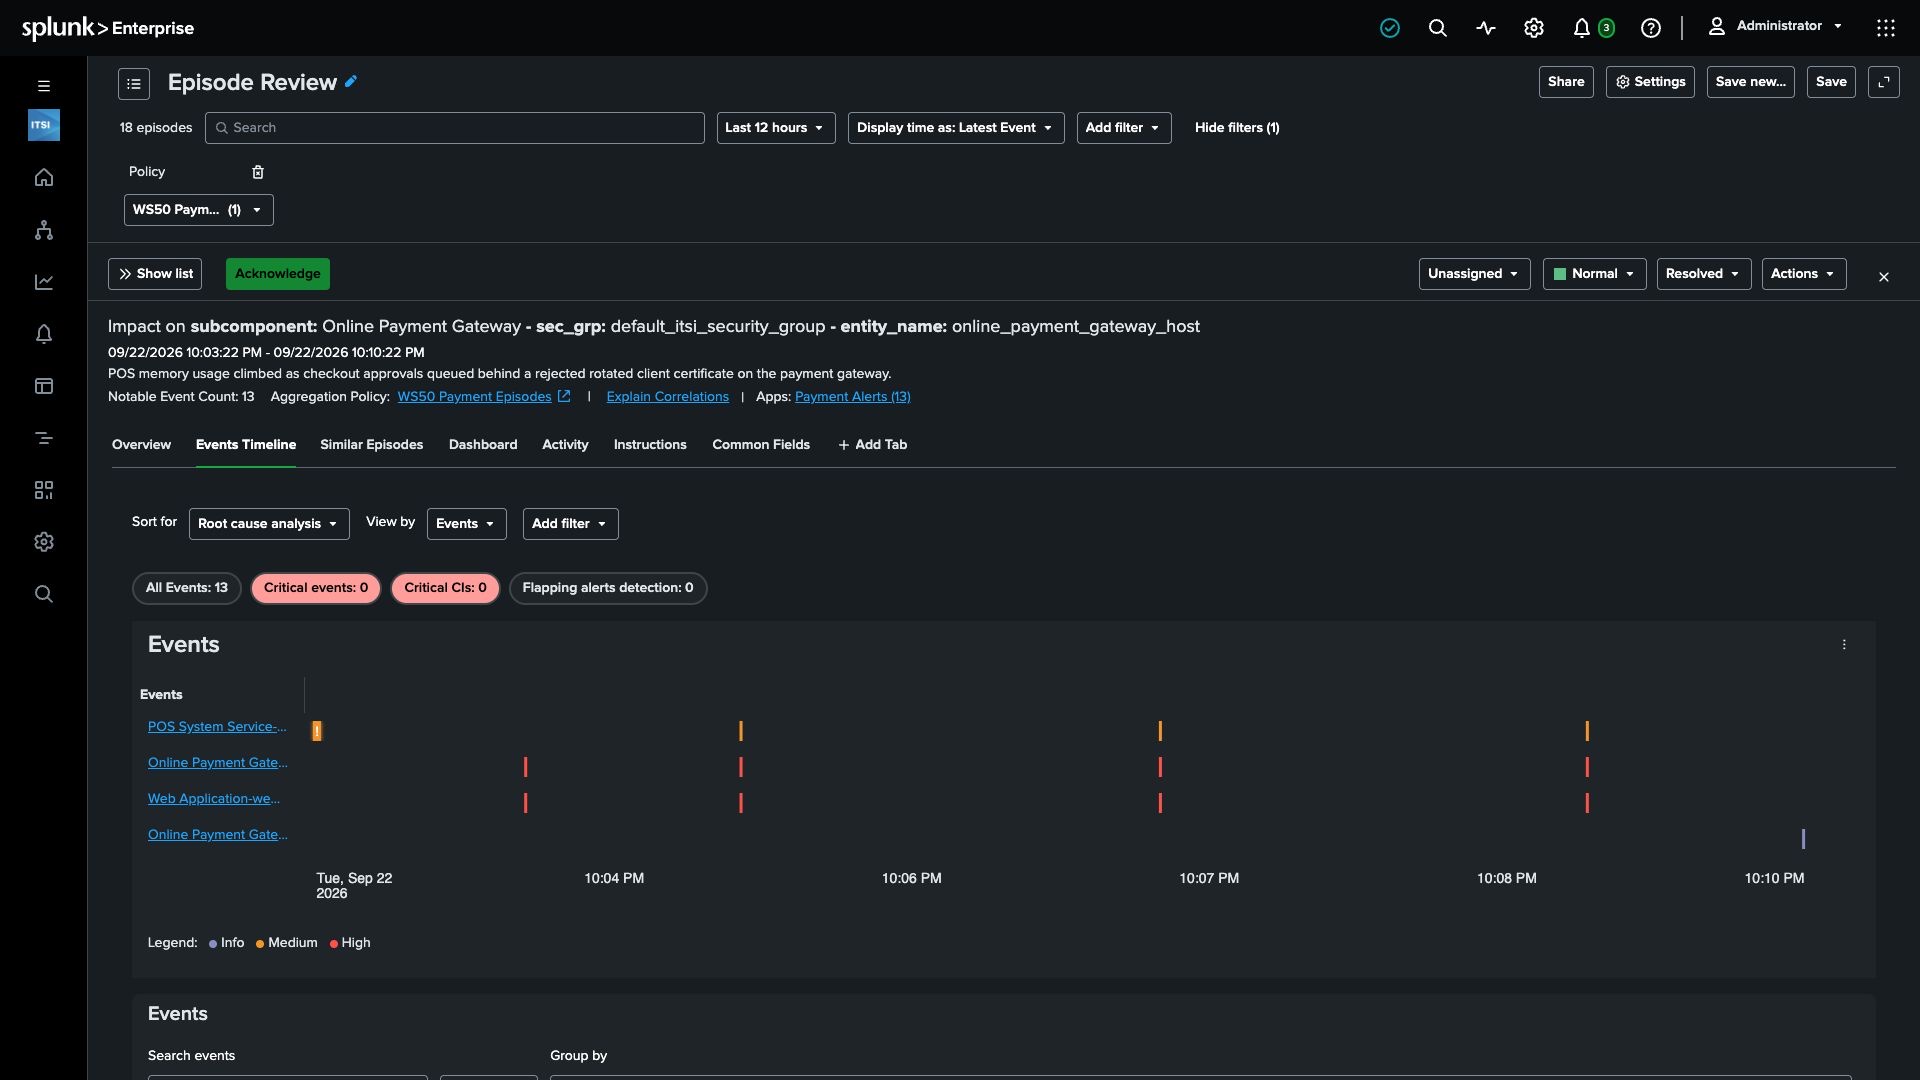
13. When the cycle completes, find its end event in the same episode. Confirm that the episode’s severity becomes Normal and its status becomes Resolved. Refresh the episode after the next ingestion and rules-engine run if necessary.
Compare the producer event IDs of the symptoms and clearing event to confirm they belong to the same payment scenario. The prepared scenario pauses briefly between incidents so ITSI can process the clearing event before the next incident starts. During that pause, it is normal for no new episode to appear.
Checkpoint
Your policy brings related payment symptoms into an episode and uses the clearing event to automate its lifecycle. You reviewed Detect’s recommendations, used a shared incident identifier for correlation, and checked the result against the actual alerts.
Continue to the next section to investigate a completed episode with EventiQ Diagnose.
If no workshop episode appears after the policy has been enabled for 5-10 minutes, confirm that WS50 Payment Alerts is active and that the filtering rule matches its generated search name exactly. If services or end events appear in separate episodes, check both sides of the identifier mapping: Producer Event ID = Field: sce in the connection, and Producer Event ID enabled in the policy. Confirm that the events carry the same value.
If the clearing event is missing, check that Event Fingerprint includes Field: event_severity_type after the incident identifier and that the throttle period is 1 minute. Throttling limits which alerts reach the policy; it does not determine which episode they join. Existing episodes retain the results of their earlier configuration, so review a fresh cycle after correcting settings.