

Zero Touch Event Analytics with ITSI 5.0
Review your event analytics workflow
Confirm how onboarding, normalization, enrichment, grouping, and investigation work together.
You started with payment alerts that described symptoms on separate components. An operator reviewing those alerts individually would need to reconcile different severities, find the right support teams, recognize the shared incident, and search for evidence explaining what happened.
You now have a workflow that brings those tasks together. The alert connection onboards the source, normalization makes its fields consistent, and enrichment adds ownership and business context. EventiQ Detect helps bring related symptoms into an episode, your clearing action automates its resolution, and EventiQ Diagnose supports the investigation with a suspected cause and source evidence.
Review what changed #
| Before | What you configured | Why it matters |
|---|---|---|
| Alerts with source-specific field names and severities | An alert connection with normalized fields and severity mappings | Operators can compare symptoms and prioritize work using consistent information. |
| An alert without business or ownership context | Lookup-based enrichment with support team and business criticality | Operators can identify responsibility and understand which business services need attention. |
| Related symptoms scattered across services | An aggregation policy using EventiQ Detect and the source’s incident identifier | Operators can assess a shared incident and its affected services in one episode. |
| Manual updates when a clearing event arrives | An action rule that sets severity to Normal and status to Resolved | The episode lifecycle follows the source’s clearing signal automatically. |
| Separate searches to develop a working explanation | An EventiQ Diagnose investigation with gateway evidence | Operators have a starting point for troubleshooting and can verify the explanation against its source. |
See the complete workflow #
1. Open a recent alert from WS50 Payment Alerts. Confirm that its message, source, and severity are understandable, and that support_team and business_criticality provide useful context.
2. Open an episode using WS50 Payment Episodes. Identify the related symptoms from Online Payment Gateway, POS System Service, and Web Application. Explain how the source’s Producer Event ID supports grouping those alerts.
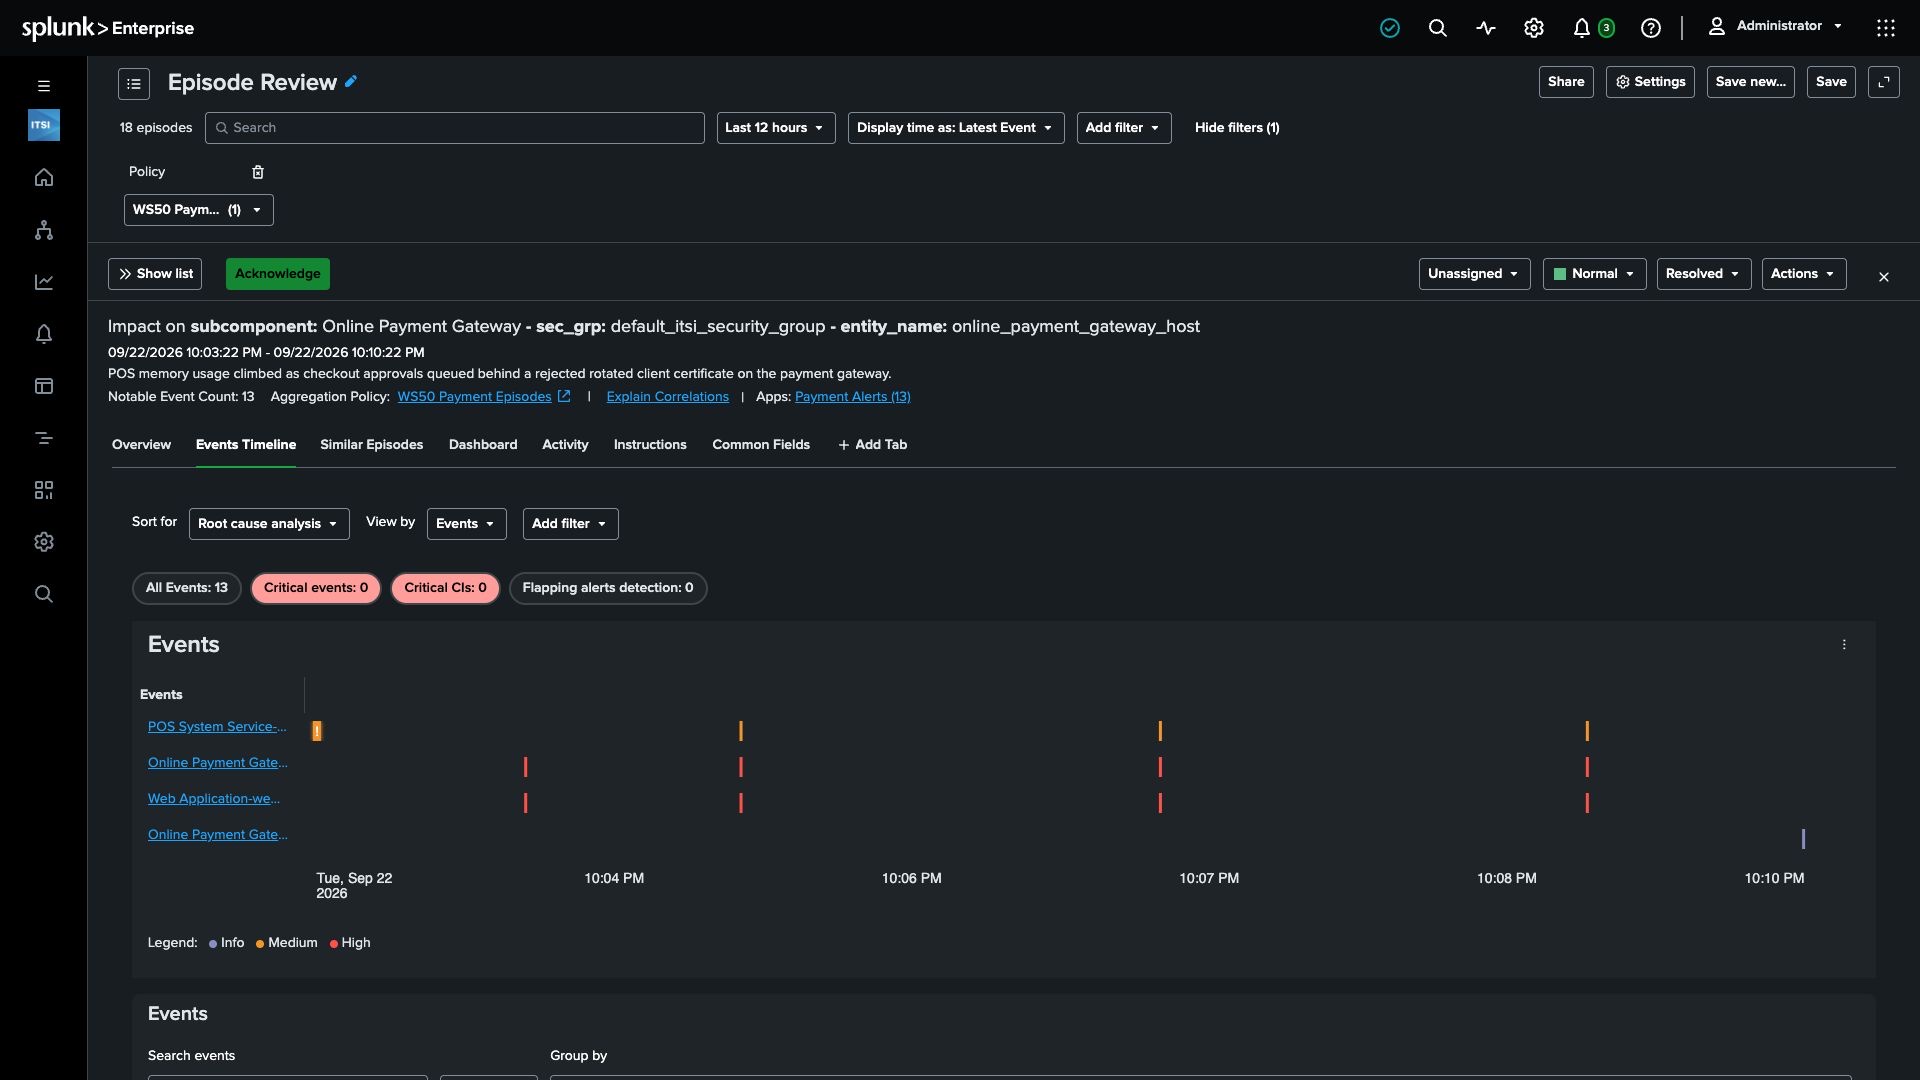
3. Find the clearing event and confirm that your action rule set the episode’s severity to Normal and status to Resolved. Explain what additional service-health evidence you would use to confirm customer recovery.
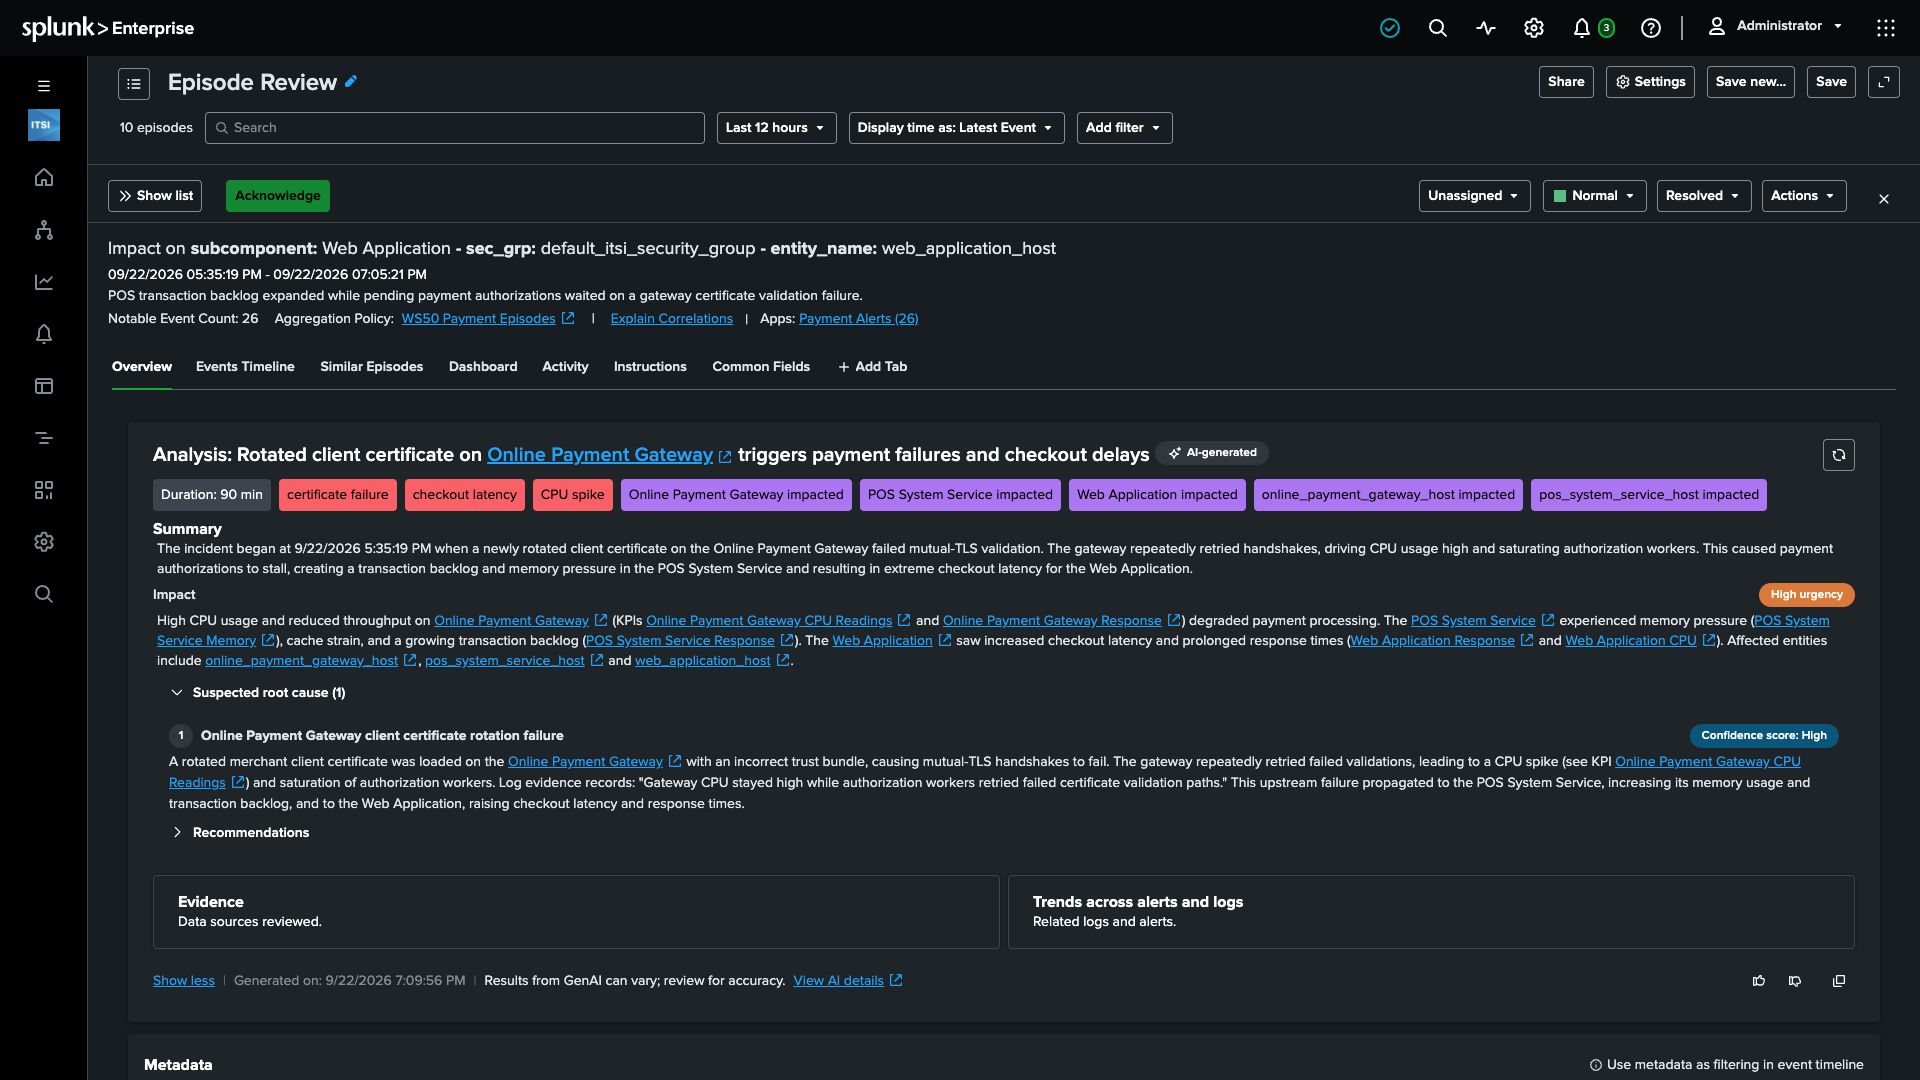
4. Review your completed Diagnose analysis. Identify one suspected cause, one supporting piece of evidence, and one recommendation that requires your judgment before action.
5. Discuss where this workflow would save your team time. Which alert source would you onboard first? What ownership or business context would help your operators? Which clearing signals could automate routine episode updates?
Workshop Complete
You built this path:
Indexed alerts → alert connection → normalized and enriched alerts → related episodes → automated resolution and an evidence-based investigation.
The result is a clearer path from an incoming alert to an informed operational decision. Your team can spend less time reconciling alerts and gathering context, and more time assessing impact and choosing the next action. Automation handles the repeatable steps while the operator verifies the evidence and decides how to respond.
Leave your completed configuration in place for review. Your workshop instance is single-use; no cleanup is required.