

Profiling Workshop
Enable AlwaysOn Profiling
Let’s learn how to enable the memory and CPU profilers, verify their operation, and use the results in Splunk Observability Cloud to find out why our application startup is slow.
Update the application configuration #
We will need to pass additional configuration arguments to the Splunk OpenTelemetry Java agent in order to enable both profilers. The configuration is documented here in detail, but for now we just need the following settings:
SPLUNK_PROFILER_ENABLED="true"
SPLUNK_PROFILER_MEMORY_ENABLED="true"
Since our application is deployed in Kubernetes, we can update the Kubernetes manifest file to set these environment variables. Open the doorgame/doorgame.yaml file for editing, and ensure the values of the following environment variables are set to “true”:
- name: SPLUNK_PROFILER_ENABLED
  value: "true"
- name: SPLUNK_PROFILER_MEMORY_ENABLED
  value: "true"
Next, let’s redeploy the Door Game application by running the following command:
cd ~/workshop/profiling
kubectl apply -f doorgame/doorgame.yaml
After a few seconds, a new pod will be deployed with the updated application settings.
Confirm operation #
To ensure the profiler is enabled, let’s review the application logs with the following commands:
kubectl logs -l app=doorgame --tail=100 | grep JfrActivatorYou should see a line in the application log output that shows the profiler is active:
[otel.javaagent 2024-02-05 19:01:12:416 +0000] [main] INFO com.splunk.opentelemetry.profiler.JfrActivator - Profiler is active.```This confirms that the profiler is enabled and sending data to the OpenTelemetry collector deployed in our Kubernetes cluster, which in turn sends profiling data to Splunk Observability Cloud.
Profiling in APM #
Visit http://<your IP address>:81 and play a few more rounds of The Door Game.
Then head back to Splunk Observability Cloud, click on APM -> Trace analyzer.
Filter on traces involving the doorgame service and the GET new-game operation (since we’re troubleshooting the game startup sequence):
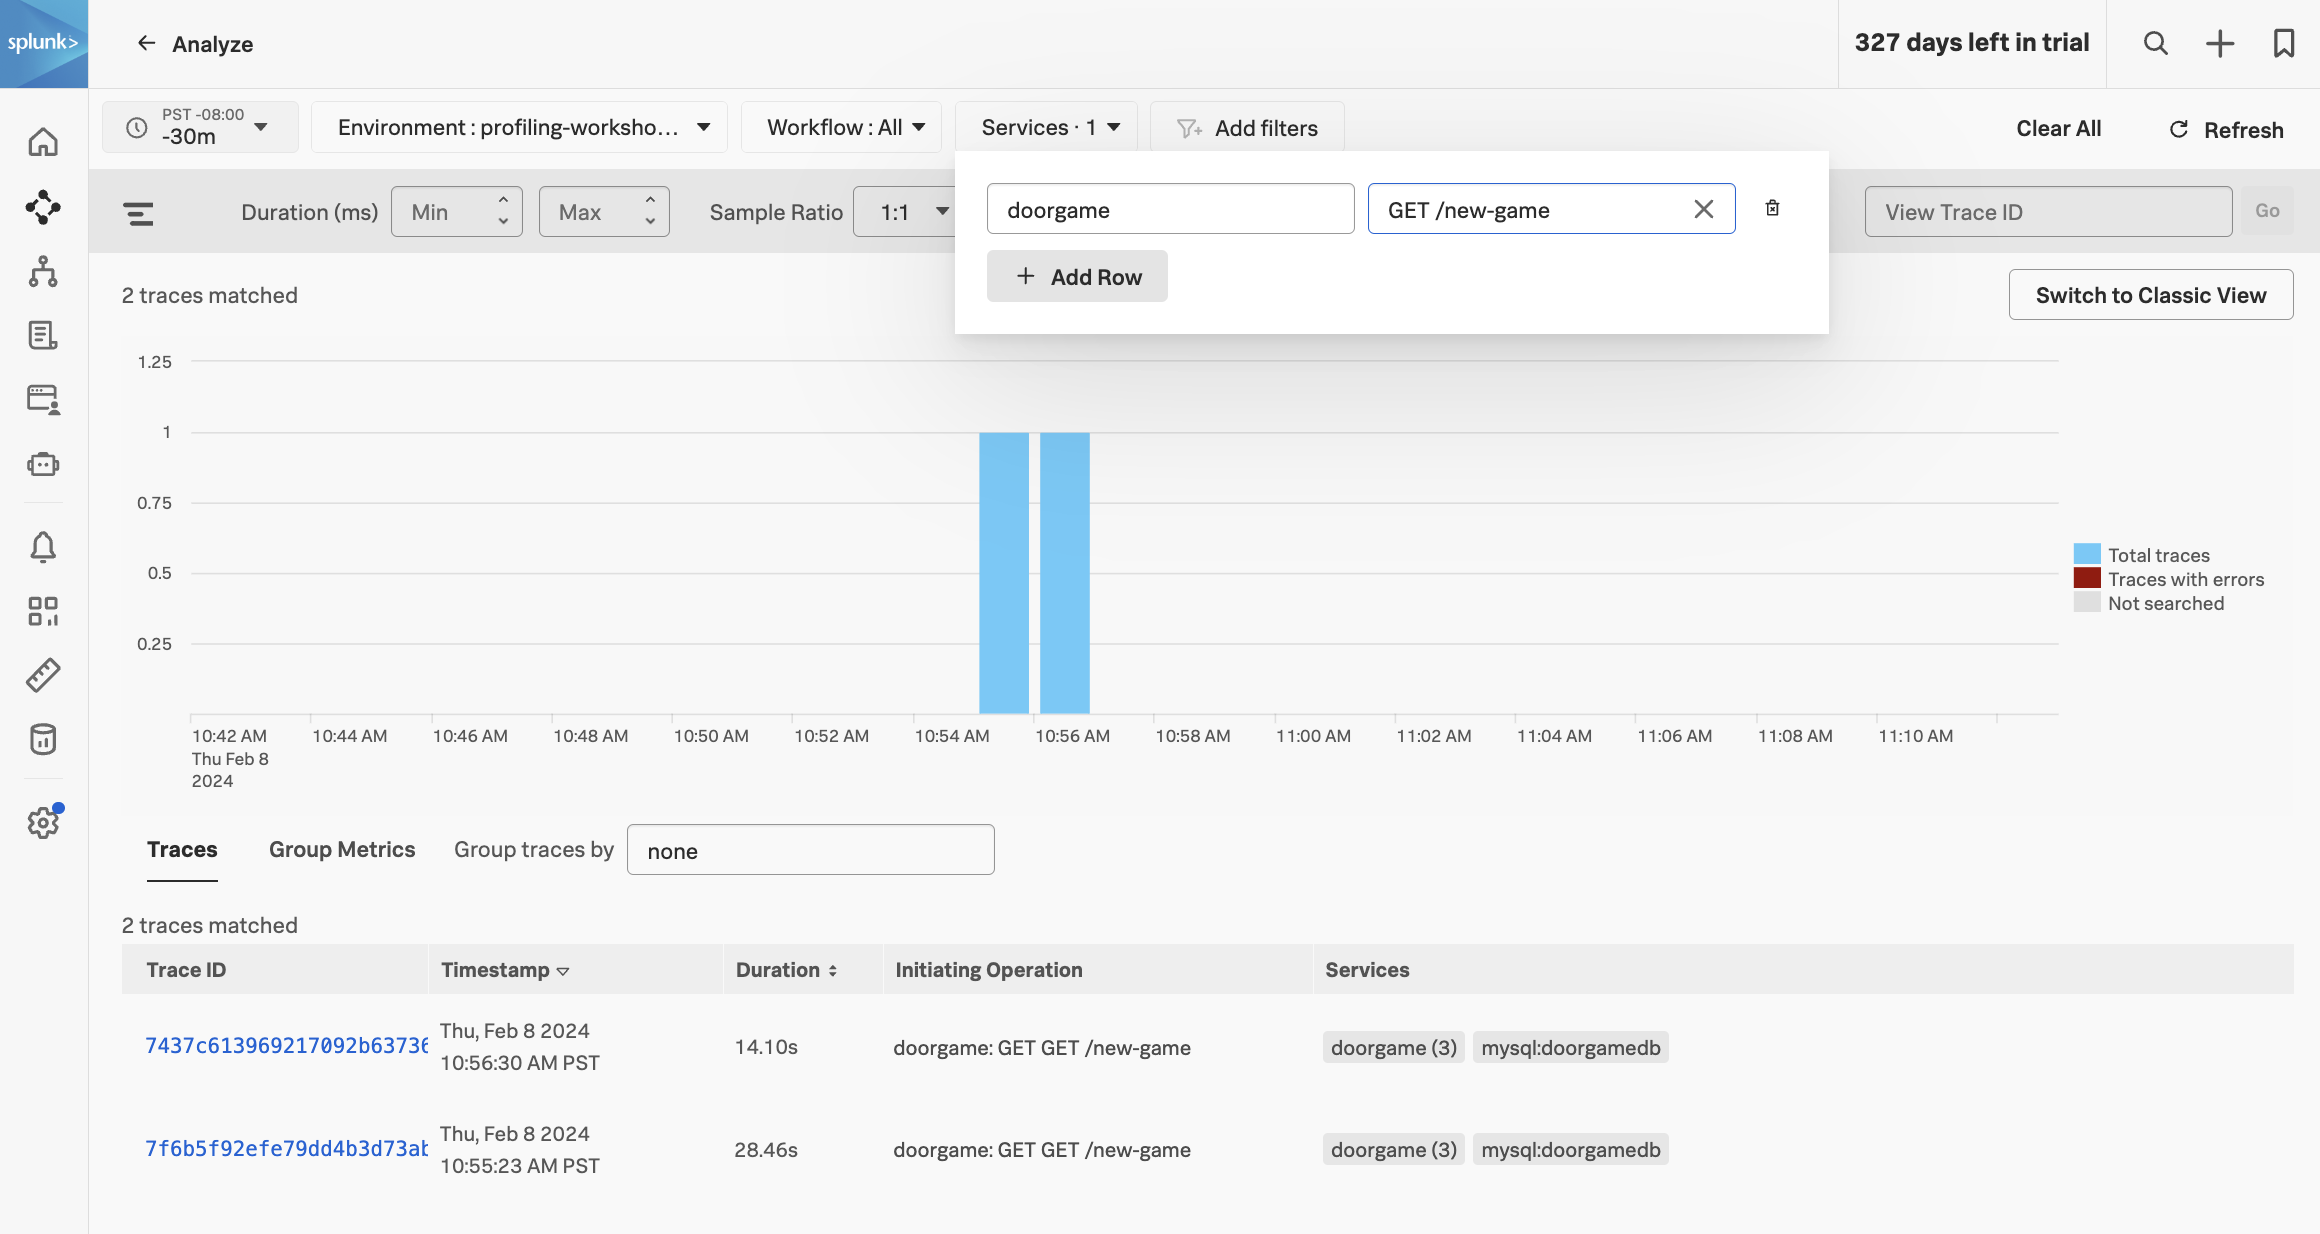
Selecting one of these traces brings up the following screen:
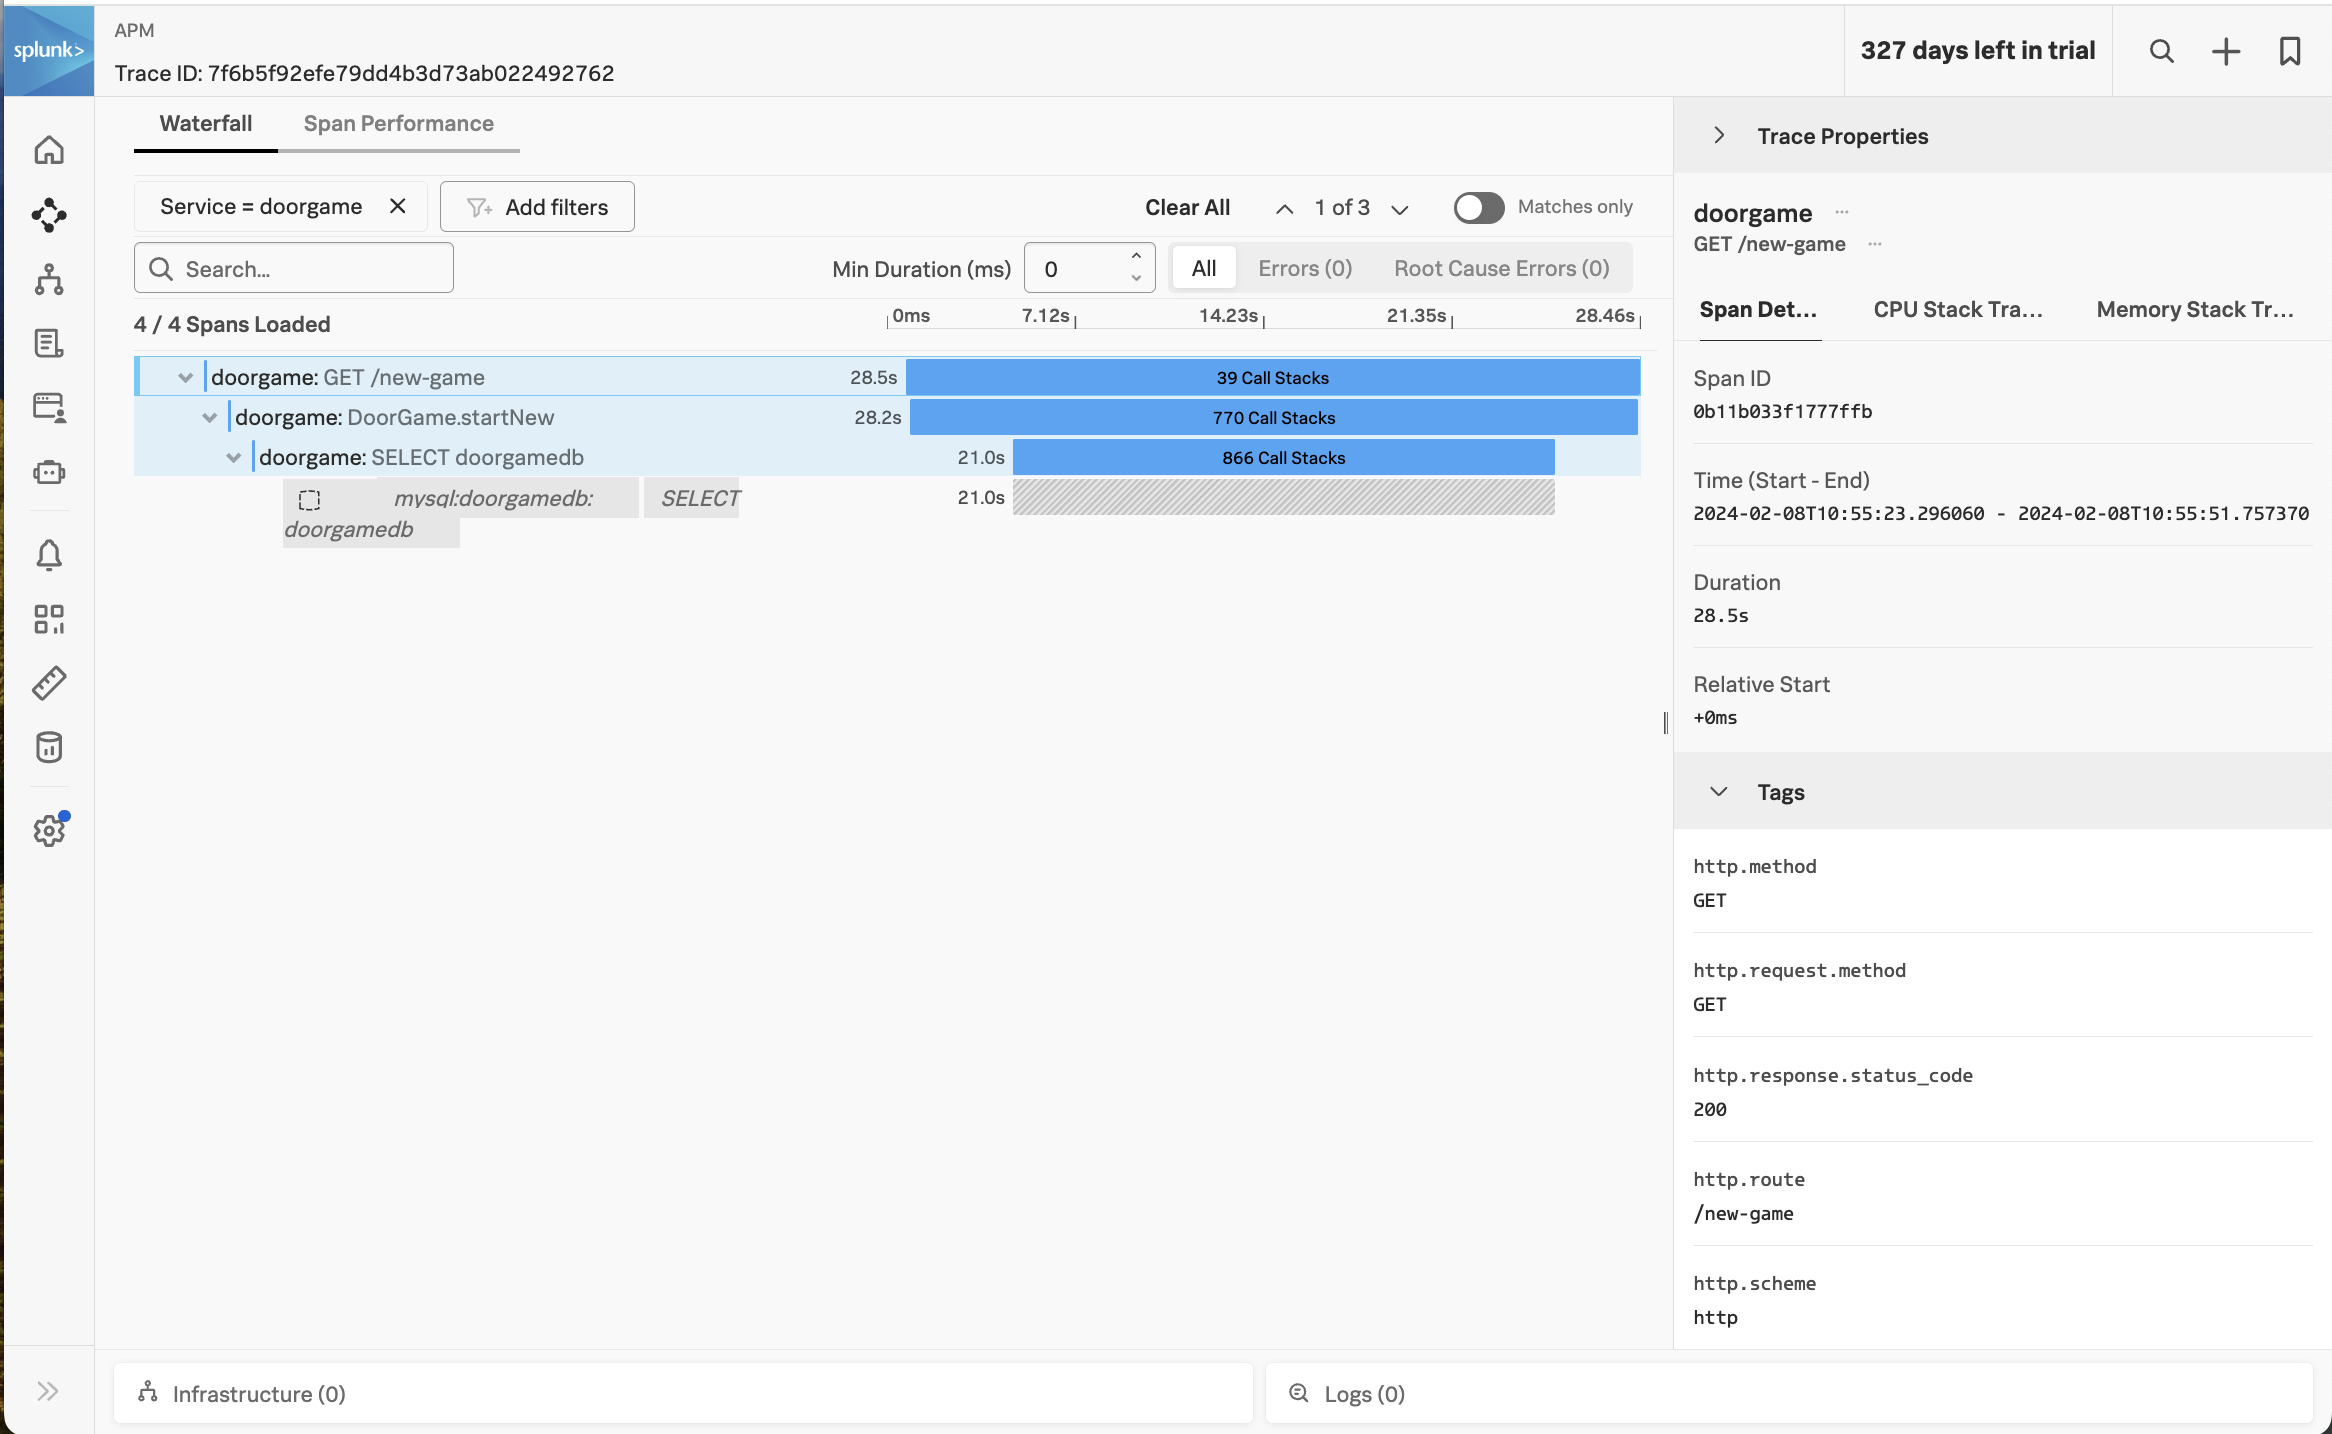
You can see that the spans now include “Call Stacks”, which is a result of us enabling CPU and memory profiling earlier.
Click on the span named doorgame: SELECT doorgamedb, then click on CPU stack traces on the right-hand side:
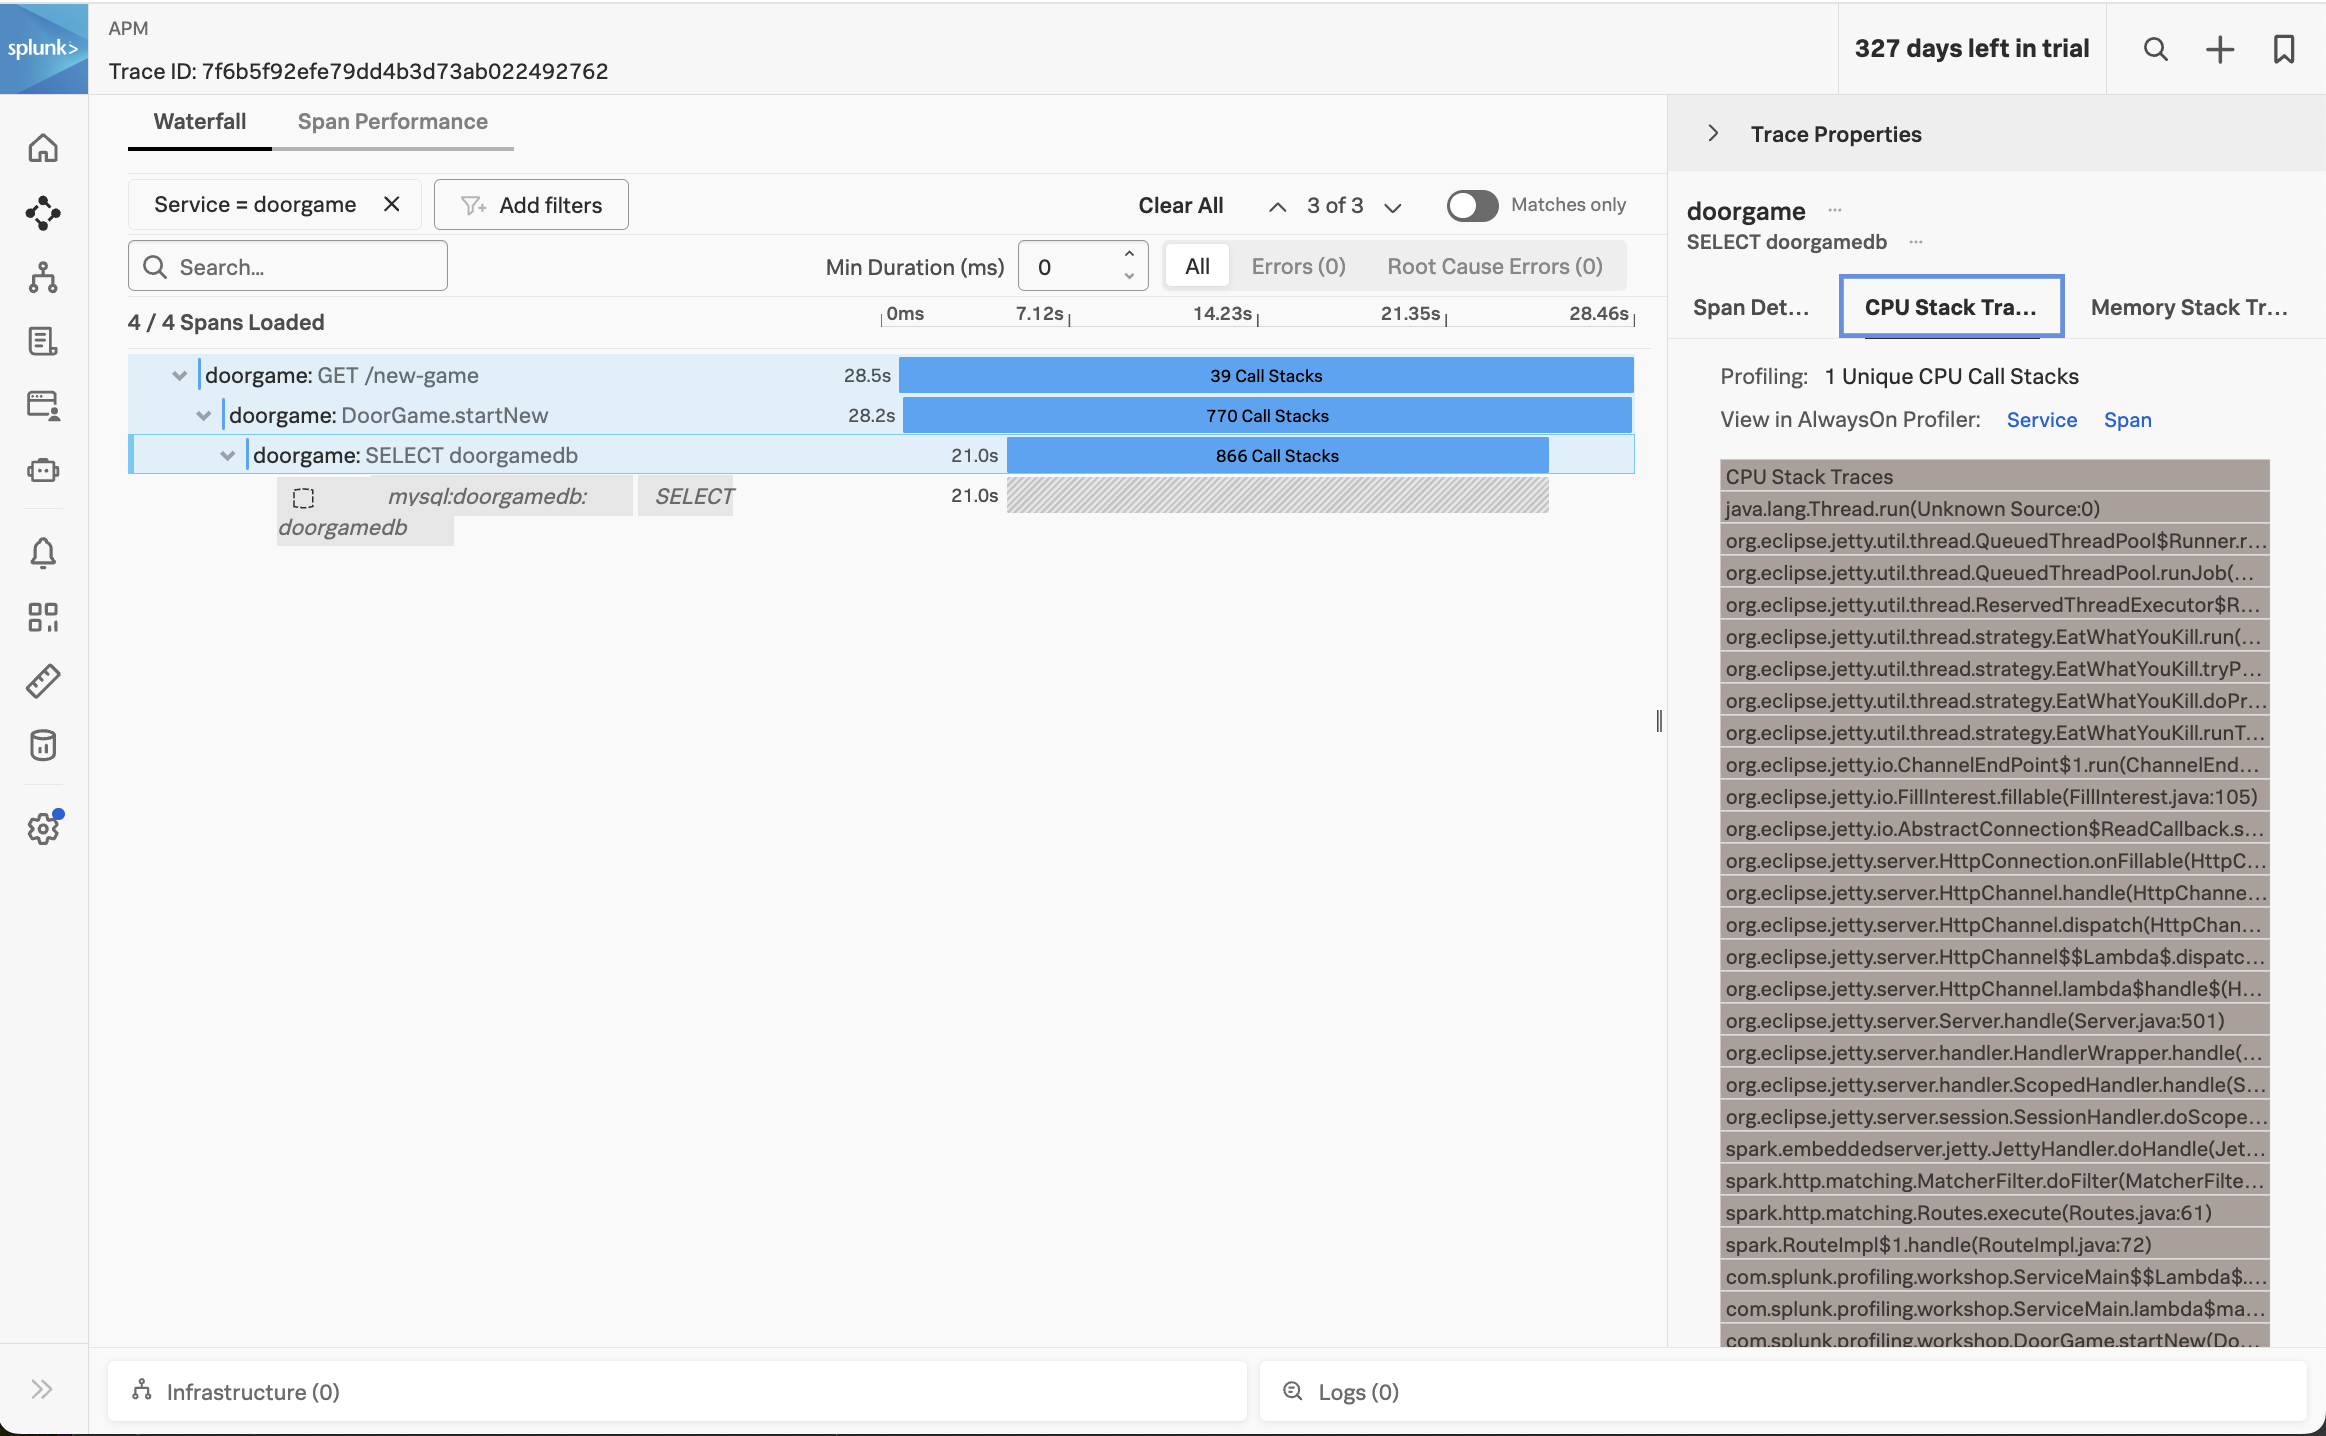
This brings up the CPU call stacks captured by the profiler.
Let’s open the AlwaysOn Profiler to review the CPU stack trace in more detail. We can do this by clicking on the Span link beside View in AlwaysOn Profiler:
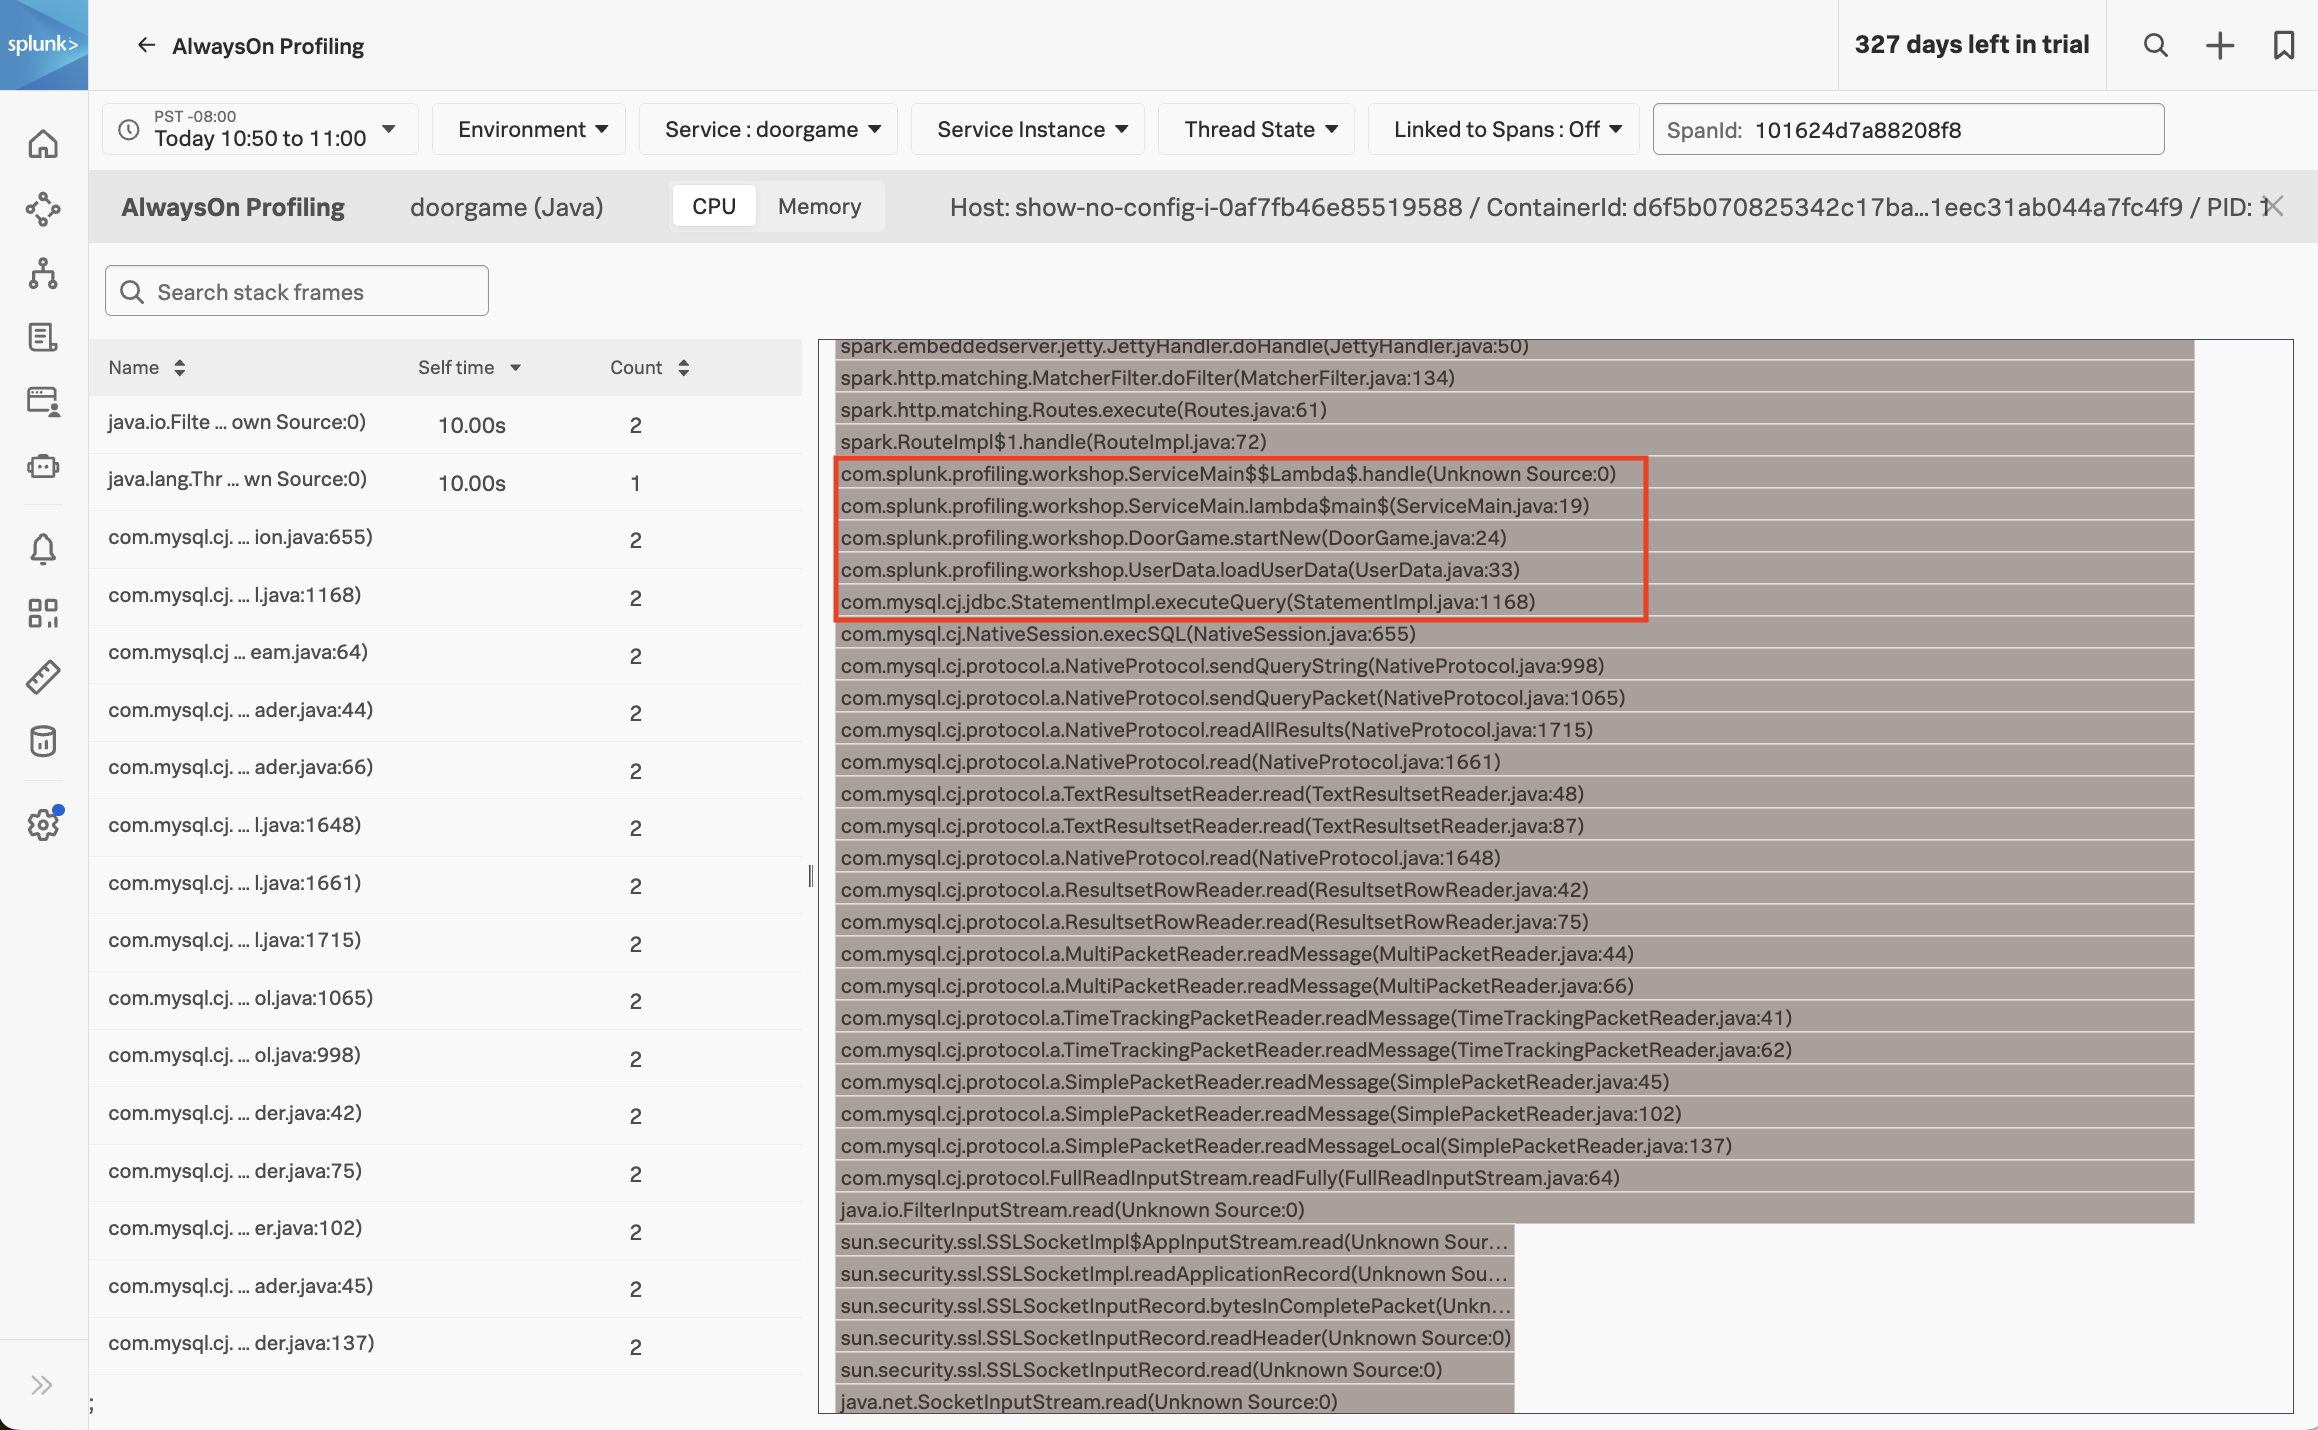
The AlwaysOn Profiler includes both a table and a flamegraph . Take some time to explore this view by doing some of the following:
- click a table item and notice the change in flamegraph
- navigate the flamegraph by clicking on a stack frame to zoom in, and a parent frame to zoom out
- add a search term like
splunkorjettyto highlight some matching stack frames
Let’s have a closer look at the stack trace, starting with the DoorGame.startNew method (since we already know that it’s the slowest part of the request)
com.splunk.profiling.workshop.DoorGame.startNew(DoorGame.java:24)
com.splunk.profiling.workshop.UserData.loadUserData(UserData.java:33)
com.mysql.cj.jdbc.StatementImpl.executeQuery(StatementImpl.java:1168)
com.mysql.cj.NativeSession.execSQL(NativeSession.java:655)
com.mysql.cj.protocol.a.NativeProtocol.sendQueryString(NativeProtocol.java:998)
com.mysql.cj.protocol.a.NativeProtocol.sendQueryPacket(NativeProtocol.java:1065)
com.mysql.cj.protocol.a.NativeProtocol.readAllResults(NativeProtocol.java:1715)
com.mysql.cj.protocol.a.NativeProtocol.read(NativeProtocol.java:1661)
com.mysql.cj.protocol.a.TextResultsetReader.read(TextResultsetReader.java:48)
com.mysql.cj.protocol.a.TextResultsetReader.read(TextResultsetReader.java:87)
com.mysql.cj.protocol.a.NativeProtocol.read(NativeProtocol.java:1648)
com.mysql.cj.protocol.a.ResultsetRowReader.read(ResultsetRowReader.java:42)
com.mysql.cj.protocol.a.ResultsetRowReader.read(ResultsetRowReader.java:75)
com.mysql.cj.protocol.a.MultiPacketReader.readMessage(MultiPacketReader.java:44)
com.mysql.cj.protocol.a.MultiPacketReader.readMessage(MultiPacketReader.java:66)
com.mysql.cj.protocol.a.TimeTrackingPacketReader.readMessage(TimeTrackingPacketReader.java:41)
com.mysql.cj.protocol.a.TimeTrackingPacketReader.readMessage(TimeTrackingPacketReader.java:62)
com.mysql.cj.protocol.a.SimplePacketReader.readMessage(SimplePacketReader.java:45)
com.mysql.cj.protocol.a.SimplePacketReader.readMessage(SimplePacketReader.java:102)
com.mysql.cj.protocol.a.SimplePacketReader.readMessageLocal(SimplePacketReader.java:137)
com.mysql.cj.protocol.FullReadInputStream.readFully(FullReadInputStream.java:64)
java.io.FilterInputStream.read(Unknown Source:0)
sun.security.ssl.SSLSocketImpl$AppInputStream.read(Unknown Source:0)
sun.security.ssl.SSLSocketImpl.readApplicationRecord(Unknown Source:0)
sun.security.ssl.SSLSocketInputRecord.bytesInCompletePacket(Unknown Source:0)
sun.security.ssl.SSLSocketInputRecord.readHeader(Unknown Source:0)
sun.security.ssl.SSLSocketInputRecord.read(Unknown Source:0)
java.net.SocketInputStream.read(Unknown Source:0)
java.net.SocketInputStream.read(Unknown Source:0)
java.lang.ThreadLocal.get(Unknown Source:0)
We can interpret the stack trace as follows:
- When starting a new Door Game, a call is made to load user data.
- This results in executing a SQL query to load the user data (which is related to the slow SQL query we saw earlier).
- We then see calls to read data in from the database.
So, what does this all mean? It means that our application startup is slow since it’s spending time loading user data. In fact, the profiler has told us the exact line of code where this happens:
com.splunk.profiling.workshop.UserData.loadUserData(UserData.java:33)Let’s open the corresponding source file (./doorgame/src/main/java/com/splunk/profiling/workshop/UserData.java) and look at this code in more detail:
public class UserData {

    static final String DB_URL = "jdbc:mysql://mysql/DoorGameDB";
    static final String USER = "root";
    static final String PASS = System.getenv("MYSQL_ROOT_PASSWORD");
    static final String SELECT_QUERY = "select * FROM DoorGameDB.Users, DoorGameDB.Organizations";

    HashMap<String, User> users;

    public UserData() {
        users = new HashMap<String, User>();
    }

    public void loadUserData() {

        // Load user data from the database and store it in a map
        Connection conn = null;
        Statement stmt = null;
        ResultSet rs = null;

        try{
            conn = DriverManager.getConnection(DB_URL, USER, PASS);
            stmt = conn.createStatement();
            rs = stmt.executeQuery(SELECT_QUERY);
            while (rs.next()) {
                User user = new User(rs.getString("UserId"), rs.getString("FirstName"), rs.getString("LastName"));
                users.put(rs.getString("UserId"), user);
            }
Here we can see the application logic in action. It establishes a connection to the database, then executes the SQL query we saw earlier:
select * FROM DoorGameDB.Users, DoorGameDB.OrganizationsIt then loops through each of the results, and loads each user into a HashMap object, which is a collection of User objects.
We have a good understanding of why the game startup sequence is so slow, but how do we fix it?
For more clues, let’s have a look at the other part of AlwaysOn Profiling: memory profiling. To do this, click on the Memory tab in AlwaysOn profiling:
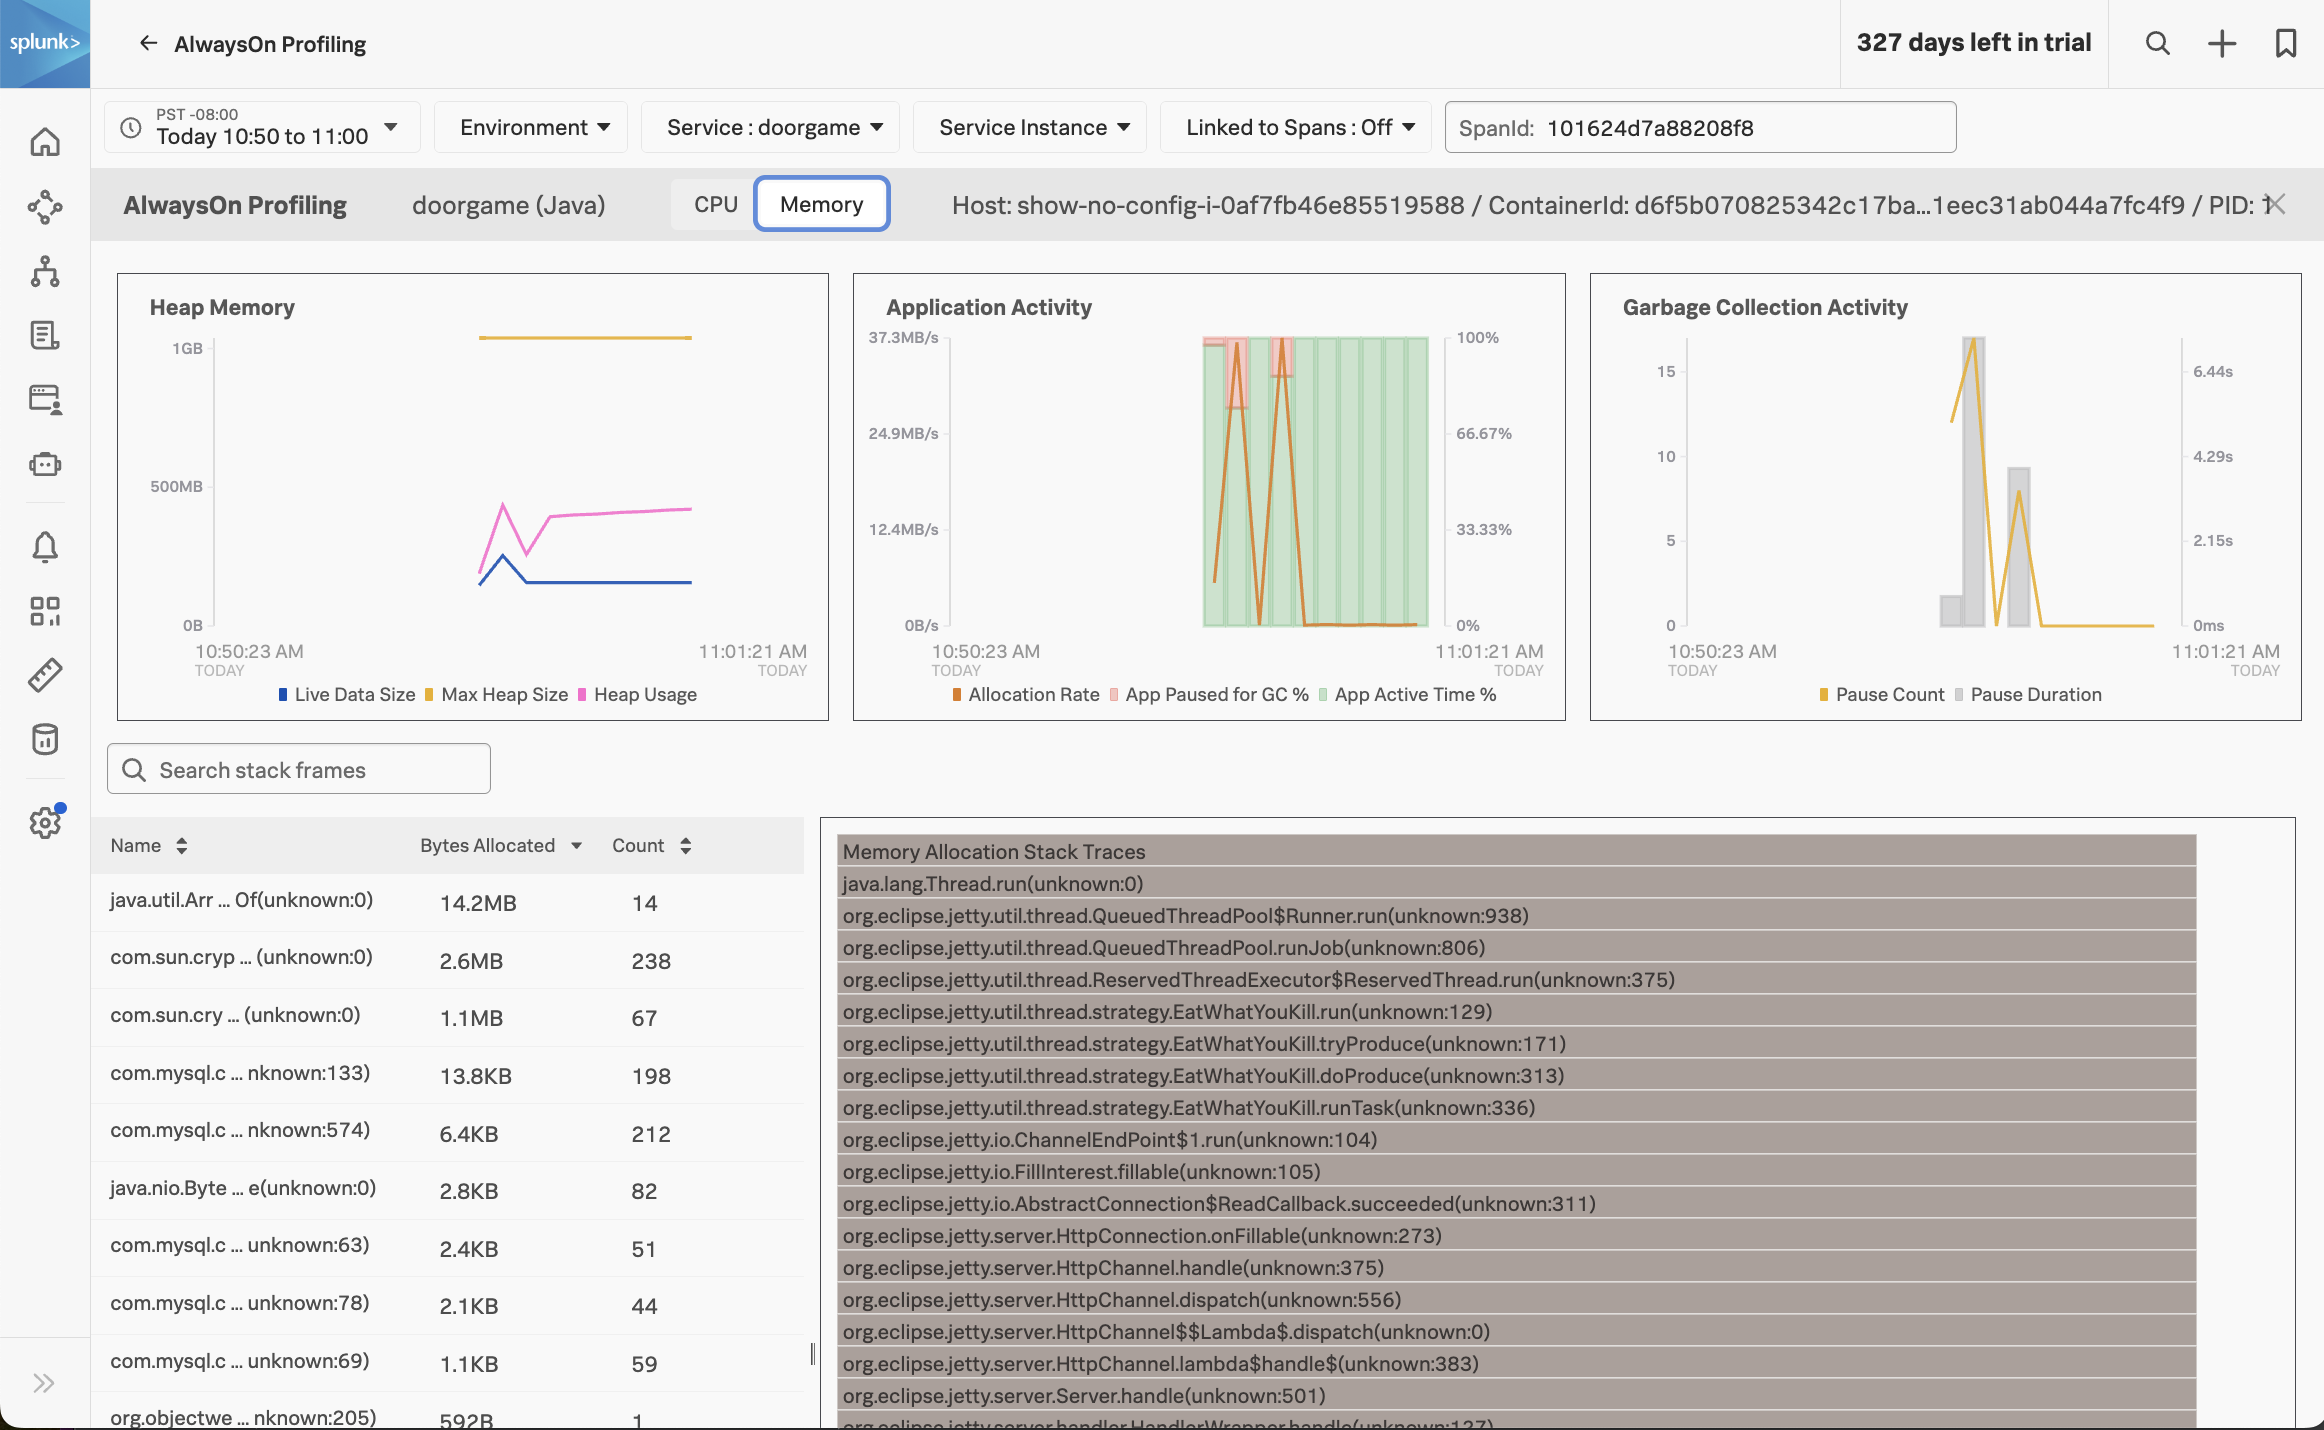
At the top of this view, we can see how much heap memory our application is using, the heap memory allocation rate, and garbage collection activity.
We can see that our application is using about 400 MB out of the max 1 GB heap size, which seems excessive for such a simple application. We can also see that some garbage collection occurred, which caused our application to pause (and probably annoyed those wanting to play the Game Door).
At the bottom of the screen, which can see which methods in our Java application code are associated with the most heap memory usage. Click on the first item in the list to show the Memory Allocation Stack Traces associated with the java.util.Arrays.copyOf method specifically:
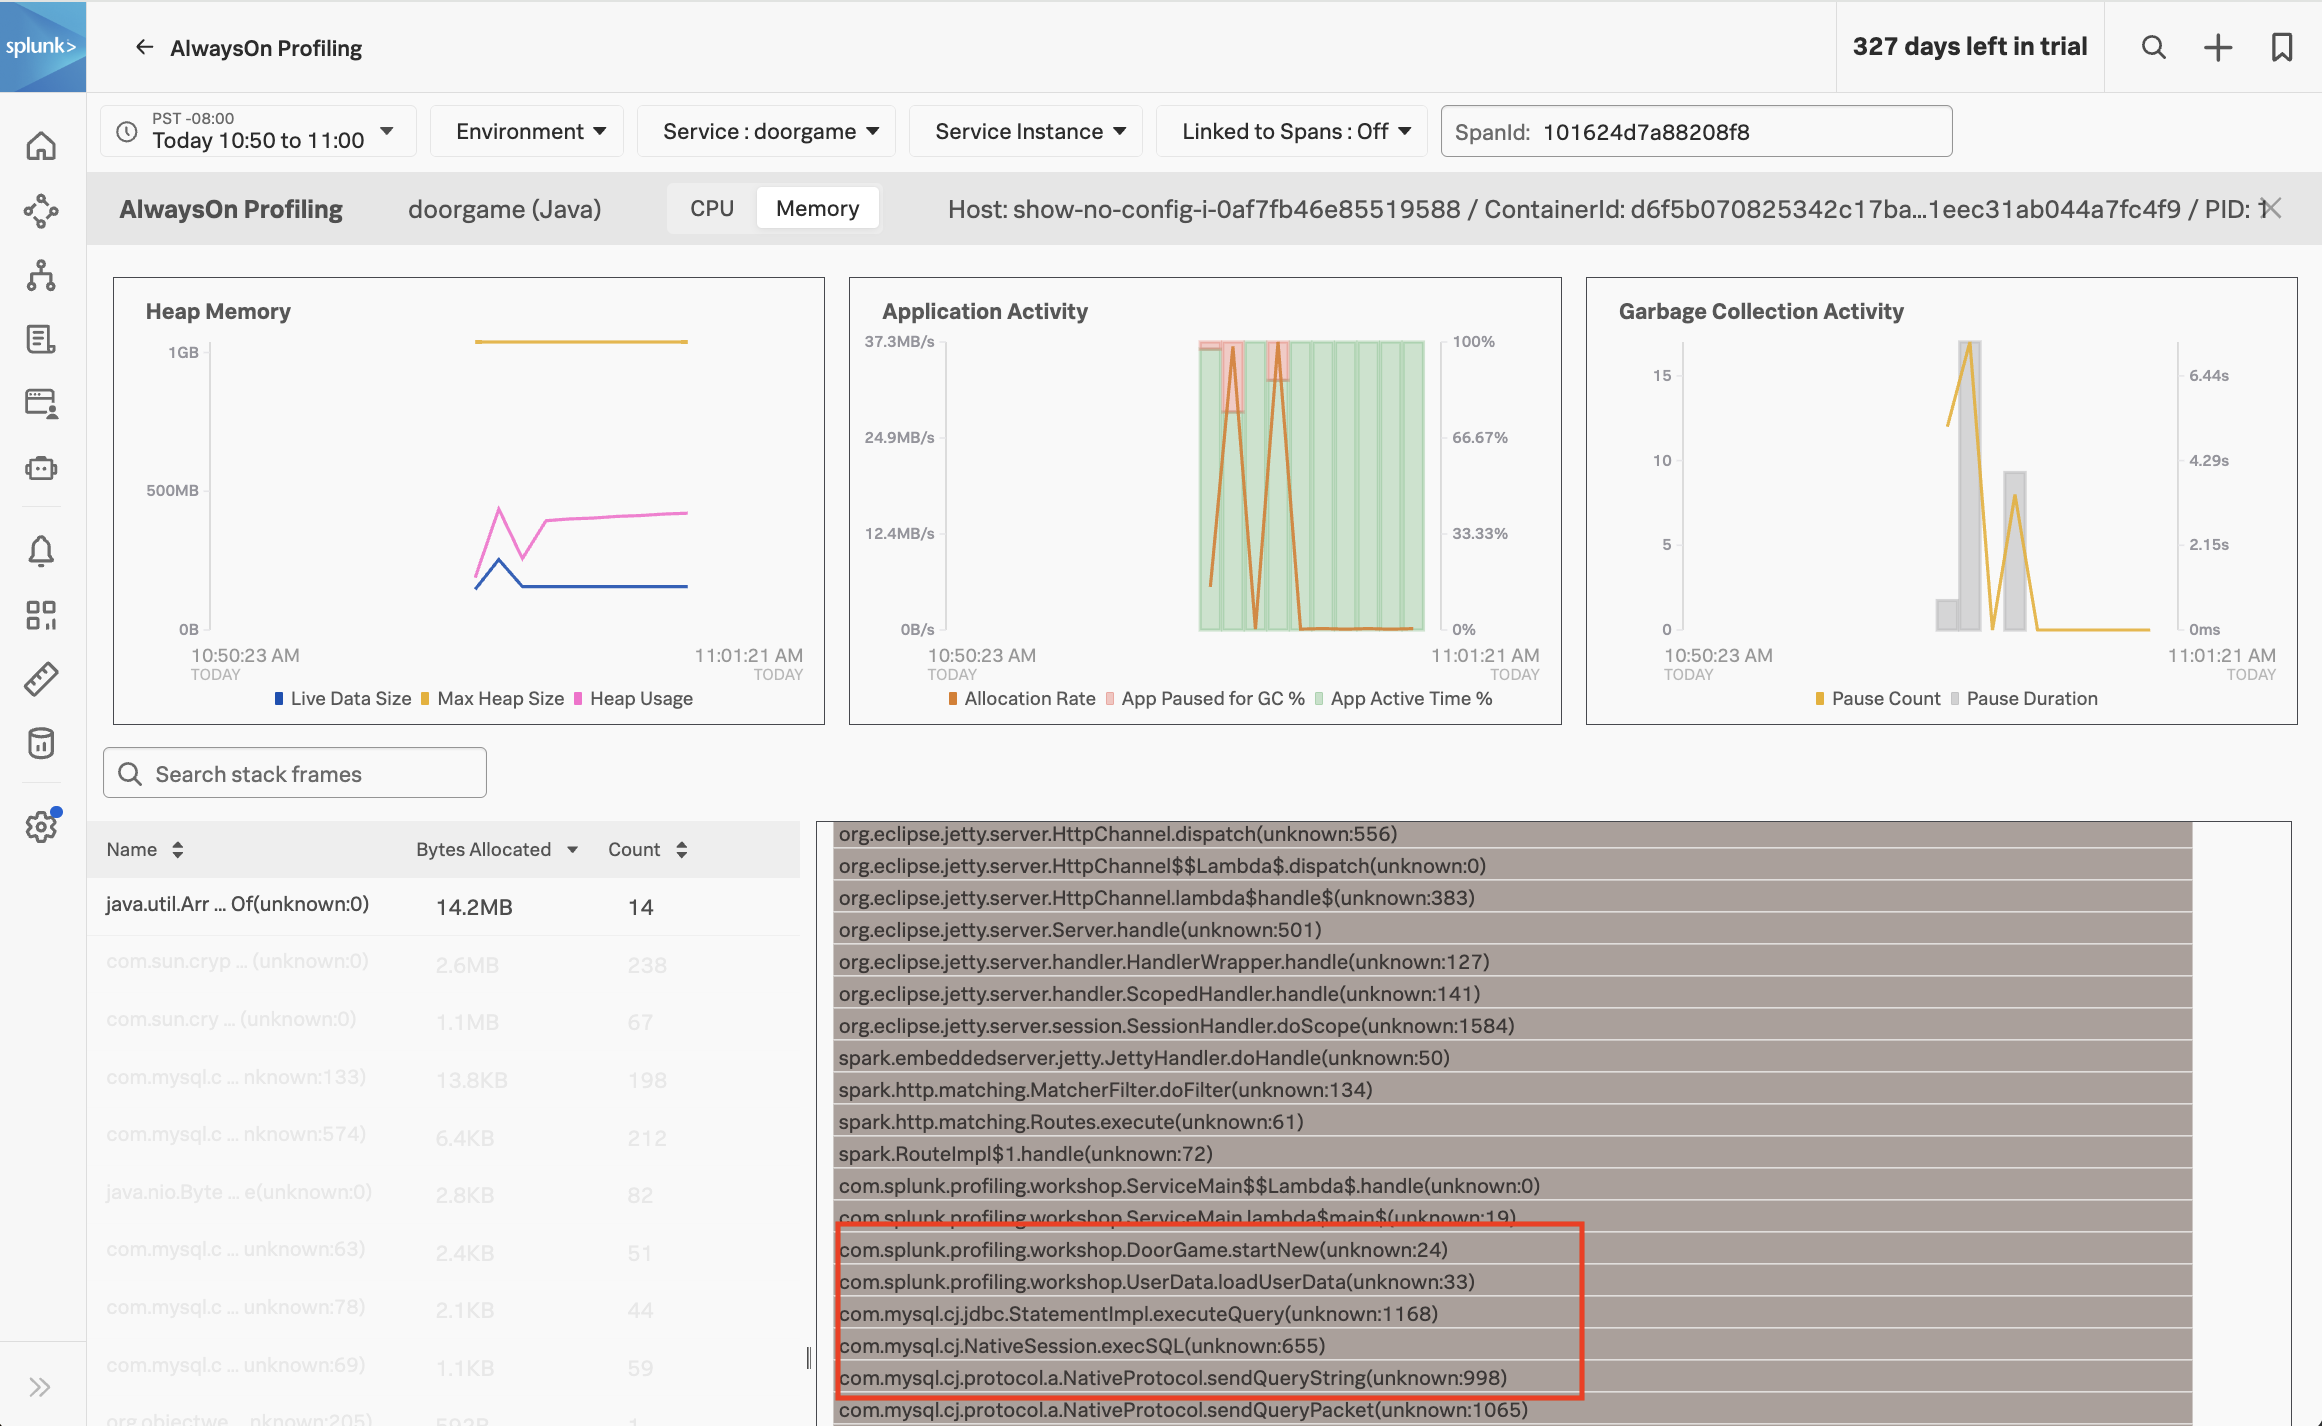
With help from the profiler, we can see that the loadUserData method not only consumes excessive CPU time, but it also consumes excessive memory when storing the user data in the HashMap collection object.
What did we accomplish? #
We’ve come a long way already!
- We learned how to enable the profiler in the Splunk OpenTelemetry Java instrumentation agent.
- We learned how to verify in the agent output that the profiler is enabled.
- We have explored several profiling related workflows in APM:
- How to navigate to AlwaysOn Profiling from the troubleshooting view
- How to explore the flamegraph and method call duration table through navigation and filtering
- How to identify when a span has sampled call stacks associated with it
- How to explore heap utilization and garbage collection activity
- How to view memory allocation stack traces for a particular method
In the next section, we’ll apply a fix to our application to resolve the slow startup performance.