Isovalent Enterprise Platform Integration with Splunk Observability Cloud
105 minutesAuthor
Alec Chamberlain
This workshop demonstrates integrating Isovalent Enterprise Platform with Splunk Observability Cloud to provide comprehensive visibility into Kubernetes networking, security, and runtime behavior using eBPF technology.
What You’ll Learn
By the end of this workshop, you will:
Deploy Amazon EKS with Cilium as the CNI in ENI mode
Configure Hubble for network observability with L7 visibility
Install Tetragon for runtime security monitoring
Integrate eBPF-based metrics with Splunk Observability Cloud using OpenTelemetry
Monitor network flows, security events, and infrastructure metrics in unified dashboards
Understand eBPF-powered observability and kube-proxy replacement
Sections
Overview - Understand Cilium architecture and eBPF fundamentals
Demo Script - Walk through an end-to-end DNS investigation scenario
Tip
This integration leverages eBPF (Extended Berkeley Packet Filter) for high-performance, low-overhead observability directly in the Linux kernel.
Prerequisites
AWS CLI configured with appropriate credentials
kubectl, eksctl, and Helm 3.x installed
An AWS account with permissions to create EKS clusters, VPCs, and EC2 instances
A Splunk Observability Cloud account with access token
Approximately 90 minutes for complete setup
Benefits of Integration
By connecting Isovalent Enterprise Platform to Splunk Observability Cloud, you gain:
🔍 Deep visibility: Network flows, L7 protocols (HTTP, DNS, gRPC), and runtime security events
🚀 High performance: eBPF-based observability with minimal overhead
🔐 Security insights: Process monitoring, system call tracing, and network policy enforcement
📊 Unified dashboards: Cilium, Hubble, and Tetragon metrics alongside infrastructure and APM data
⚡ Efficient networking: Kube-proxy replacement and native VPC networking with ENI mode
Source Repositories
All configuration files, Helm values, and dashboard JSON files referenced in this workshop are available in the following repositories:
isovalent_splunk_o11y — Helm values, OTel Collector configuration, Splunk dashboard JSON files, and the complete integration guide
isovalent-demo-jobs-app — The jobs-app Helm chart used in the demo scenario, including the error injection and remediation scripts
Subsections of Isovalent Splunk Observability Integration
Overview
What is Isovalent Enterprise Platform?
The Isovalent Enterprise Platform consists of three core components built on eBPF (Extended Berkeley Packet Filter) technology:
Cilium
Cloud Native CNI and Network Security
eBPF-based networking and security for Kubernetes
Replaces kube-proxy with high-performance eBPF datapath
Native support for AWS ENI mode (pods get VPC IP addresses)
Network policy enforcement at L3-L7
Transparent encryption and load balancing
Hubble
Network Observability
Built on top of Cilium’s eBPF visibility
Real-time network flow monitoring
L7 protocol visibility (HTTP, DNS, gRPC, Kafka)
Flow export and historical data storage (Timescape)
Metrics exposed on port 9965
Tetragon
Runtime Security and Observability
eBPF-based runtime security
Process execution monitoring
System call tracing
File access tracking
Security event metrics on port 2112
Architecture
graph TB
    subgraph AWS["Amazon Web Services"]
        subgraph EKS["EKS Cluster"]
            subgraph Node["Worker Node"]
                CA["Cilium Agent<br/>:9962"]
                CE["Cilium Envoy<br/>:9964"]
                HA["Hubble<br/>:9965"]
                TE["Tetragon<br/>:2112"]
                OC["OTel Collector"]
            end
            CO["Cilium Operator<br/>:9963"]
            HR["Hubble Relay"]
        end
    end

    subgraph Splunk["Splunk Observability Cloud"]
        IM["Infrastructure Monitoring"]
        DB["Dashboards"]
    end

    CA -.->|"Scrape"| OC
    CE -.->|"Scrape"| OC
    HA -.->|"Scrape"| OC
    TE -.->|"Scrape"| OC
    CO -.->|"Scrape"| OC

    OC ==>|"OTLP/HTTP"| IM
    IM --> DB
Key Components
Component
Service Name
Port
Purpose
Cilium Agent
cilium-agent
9962
CNI, network policies, eBPF programs
Cilium Envoy
cilium-envoy
9964
L7 proxy for HTTP, gRPC
Cilium Operator
cilium-operator
9963
Cluster-wide operations
Hubble
hubble-metrics
9965
Network flow metrics
Tetragon
tetragon
2112
Runtime security metrics
Benefits of eBPF
High Performance: Runs in the Linux kernel with minimal overhead
Safety: Verifier ensures programs are safe to run
Flexibility: Dynamic instrumentation without kernel modules
Visibility: Deep insights into network and system behavior
Note
This integration provides visibility into Kubernetes networking at a level not possible with traditional CNI plugins.
Prerequisites
Required Tools
Before starting this workshop, ensure you have the following tools installed:
AWS CLI
# Check installationaws --version
# Should output: aws-cli/2.x.x or higher
kubectl
# Check installationkubectl version --client
# Should output: Client Version: v1.28.0 or higher
eksctl
# Check installationeksctl version
# Should output: 0.150.0 or higher
Helm
# Check installationhelm version
# Should output: version.BuildInfo{Version:"v3.x.x"}
AWS Requirements
AWS account with permissions to create:
EKS clusters
VPCs and subnets
EC2 instances
IAM roles and policies
Elastic Network Interfaces
AWS CLI configured with credentials (aws configure)
Splunk Observability Cloud
You’ll need:
A Splunk Observability Cloud account
An Access Token with ingest permissions
Your Realm identifier (e.g., us1, us2, eu0)
Getting Splunk Credentials
In Splunk Observability Cloud:
Navigate to Settings → Access Tokens
Create a new token with Ingest permissions
Note your realm from the URL: https://app.<realm>.signalfx.com
Cost Considerations
AWS Costs (Approximate)
EKS Control Plane: ~$73/month
EC2 Nodes (2x m5.xlarge): ~$280/month
Data Transfer: Variable
EBS Volumes: ~$20/month
Estimated Total: ~$380-400/month for lab environment
Splunk Costs
Based on metrics volume (DPM - Data Points per Minute)
Free trial available for testing
Warning
Remember to clean up resources after completing the workshop to avoid ongoing charges.
disableDefaultAddons: true - Disables AWS VPC CNI and kube-proxy (Cilium will replace both)
withOIDC: true - Enables IAM roles for service accounts (required for Cilium to manage ENIs)
coredns addon is retained as it’s needed for DNS resolution
Why Disable Default Addons?
Cilium provides its own CNI implementation using eBPF, which is more performant than the default AWS VPC CNI. By disabling the defaults, we avoid conflicts and let Cilium handle all networking.
Step 3: Create the EKS Cluster
Create the cluster (this takes approximately 15-20 minutes):
With the EKS cluster created, you’re ready to install Cilium, Hubble, and Tetragon.
Cilium Installation
Step 1: Configure Cilium Enterprise
Create a file named cilium-enterprise-values.yaml. Replace <YOUR-EKS-API-SERVER-ENDPOINT> with the endpoint from the previous step (without the https:// prefix).
# Enable/disable debug loggingdebug:enabled:falseverbose:~# Configure unique cluster name & IDcluster:name:isovalent-demoid:0# Configure ENI specificseni:enabled:trueupdateEC2AdapterLimitViaAPI:true# Dynamically fetch ENI limits from EC2 APIawsEnablePrefixDelegation:true# Assign /28 CIDR blocks per ENI (16 IPs) instead of individual IPsenableIPv4Masquerade:false# Pods use their real VPC IPs — no SNAT needed in ENI modeloadBalancer:serviceTopology:true# Prefer backends in the same AZ to reduce cross-AZ traffic costsipam:mode:eniroutingMode:native # No overlay tunnels — traffic routes natively through VPC# BPF / KubeProxyReplacement# Cilium replaces kube-proxy entirely with eBPF programs in the kernel.# This requires a direct path to the API server, hence k8sServiceHost.kubeProxyReplacement:"true"k8sServiceHost:<YOUR-EKS-API-SERVER-ENDPOINT>k8sServicePort:443# TLS for internal Cilium communicationtls:ca:certValidityDuration:3650# 10 years for the CA cert# Hubble: network observability built on top of Cilium's eBPF datapathhubble:enabled:truemetrics:enableOpenMetrics:true# Use OpenMetrics format for better Prometheus compatibilityenabled:# DNS: query/response tracking with namespace-level label context- dns:labelsContext=source_namespace,destination_namespace# Drop: packet drop reasons (policy deny, invalid, etc.) per namespace- drop:labelsContext=source_namespace,destination_namespace# TCP: connection state tracking (SYN, FIN, RST) per namespace- tcp:labelsContext=source_namespace,destination_namespace# Port distribution: which destination ports are being used- port-distribution:labelsContext=source_namespace,destination_namespace# ICMP: ping/traceroute visibility with workload identity context- icmp:labelsContext=source_namespace,destination_namespace;sourceContext=workload-name|reserved-identity;destinationContext=workload-name|reserved-identity# Flow: per-workload flow counters (forwarded, dropped, redirected)- flow:sourceContext=workload-name|reserved-identity;destinationContext=workload-name|reserved-identity# HTTP L7: request/response metrics with full workload context and exemplars for trace correlation- "httpV2:exemplars=true;labelsContext=source_ip,source_namespace,source_workload,destination_namespace,destination_workload,traffic_direction;sourceContext=workload-name|reserved-identity;destinationContext=workload-name|reserved-identity"# Policy: network policy verdict tracking (allowed/denied) per workload- "policy:sourceContext=app|workload-name|pod|reserved-identity;destinationContext=app|workload-name|pod|dns|reserved-identity;labelsContext=source_namespace,destination_namespace"# Flow export: enables Hubble to export flow records to Timescape for historical storage- flow_exportserviceMonitor:enabled:true# Creates a Prometheus ServiceMonitor for auto-discoverytls:enabled:trueauto:enabled:truemethod:cronJob # Automatically rotate Hubble TLS certs on a schedulecertValidityDuration:1095# 3 years per cert rotationrelay:enabled:true# Hubble Relay aggregates flows from all nodes cluster-widetls:server:enabled:trueprometheus:enabled:trueserviceMonitor:enabled:truetimescape:enabled:true# Stores historical flow data for time-travel debugging# Cilium Operator: cluster-wide identity and endpoint managementoperator:prometheus:enabled:trueserviceMonitor:enabled:true# Cilium Agent: per-node eBPF datapath metricsprometheus:enabled:trueserviceMonitor:enabled:true# Cilium Envoy: L7 proxy metrics (HTTP, gRPC)envoy:prometheus:enabled:trueserviceMonitor:enabled:true# Enable the Cilium agent to hand off DNS proxy responsibilities to the# external DNS Proxy HA deployment, so policies keep working during upgradesextraConfig:external-dns-proxy:"true"# Enterprise feature gates — these must be explicitly approvedenterprise:featureGate:approved:- DNSProxyHA # High-availability DNS proxy (installed separately)- HubbleTimescape # Historical flow storage via Timescape
Why label contexts matter
The labelsContext and sourceContext/destinationContext parameters on each Hubble metric control what dimensions the metric is broken down by. Setting labelsContext=source_namespace,destination_namespace means every metric will have those two labels attached, letting you filter by namespace in Splunk without cardinality explosion. The workload-name|reserved-identity fallback chain means Cilium will use the workload name if available, falling back to the security identity if not.
Step 2: Install Cilium Enterprise
When a new node joins an EKS cluster, the kubelet on that node immediately starts looking for a CNI plugin to set up networking. It reads whatever CNI configuration is present in /etc/cni/net.d/ and uses that to initialize the node. If we create the node group first, the AWS VPC CNI is what gets there first — and once a node has initialized with one CNI, switching to another requires draining and re-initializing the node.
By installing Cilium before any nodes exist, we ensure that Cilium’s CNI configuration is already present in kube-system and ready to be picked up the moment a node starts. When the EC2 instances boot, Cilium’s DaemonSet pod is scheduled immediately, its eBPF programs are loaded, and the node comes up Ready under Cilium’s control from the very first second.
This is also why the cluster was created with disableDefaultAddons: true in Step 3 of the EKS setup — without that, the AWS VPC CNI would be installed automatically and would race against Cilium.
After installation you’ll see some jobs in a pending state — this is normal. Cilium’s Helm chart includes a job that generates TLS certificates for Hubble, and that job needs a node to run on. It will complete automatically once nodes are available in the next step.
# Check nodeskubectl get nodes
# Check Cilium podskubectl get pods -n kube-system -l k8s-app=cilium
# Check all Cilium componentskubectl get pods -n kube-system | grep -E "(cilium|hubble)"
Expected Output:
2 nodes in Ready state
Cilium pods running (1 per node)
Hubble relay and timescape running
Cilium operator running
Step 5: Install Tetragon with Enhanced Network Observability
Tetragon out of the box provides runtime security and process-level visibility. For the Splunk integration — especially the Network Explorer dashboards — you also want to enable its enhanced network observability mode, which tracks TCP/UDP socket statistics, RTT, connection events, and DNS at the kernel level.
Create a file named tetragon-network-values.yaml:
# Tetragon configuration with Enhanced Network Observability enabled# Required for Splunk Observability Cloud Network Explorer integrationtetragon:# Enable network events — this activates eBPF-based socket trackingenableEvents:network:true# Layer3 settings: track TCP, UDP, and ICMP with RTT and latency# These enable the socket stats metrics (srtt, retransmits, bytes, etc.)layer3:tcp:enabled:truertt:enabled:true# Round-trip time per TCP flowudp:enabled:trueicmp:enabled:truelatency:enabled:true# Per-connection latency tracking# DNS tracking at the kernel level (complements Hubble DNS metrics)dns:enabled:true# Expose Tetragon metrics via Prometheusprometheus:enabled:trueserviceMonitor:enabled:true# Filter out noise from internal system namespaces — we only care about# application workloads, not the observability stack itselfexportDenyList:|- {"health_check":true}
{"namespace":["", "cilium", "tetragon", "kube-system", "otel-splunk"]}# Only include labels that are meaningful for the Network ExplorermetricsLabelFilter:"namespace,workload,binary"resources:limits:cpu:500mmemory:1Girequests:cpu:100mmemory:256Mi# Enable the Tetragon Operator and TracingPolicy support.# With tracingPolicy.enabled: true, the operator manages and deploys# TracingPolicies (TCP connection tracking, HTTP visibility, etc.) automatically.tetragonOperator:enabled:truetracingPolicy:enabled:true
What you’ll see: Tetragon runs as a DaemonSet (one pod per node) plus an operator.
What Enhanced Network Observability adds
With layer3.tcp.rtt.enabled: true, Tetragon hooks into the kernel’s TCP socket state and records per-connection metrics including round-trip time, retransmit counts, bytes sent/received, and segment counts. These feed the tetragon_socket_stats_* metrics that power latency and throughput views in Splunk’s Network Explorer. Without this, you only get event counts — with it, you get connection quality data.
TracingPolicies (TCP connection tracking, HTTP visibility, etc.) are managed automatically by the Tetragon Operator when tetragonOperator.tracingPolicy.enabled: true is set in the Helm values above.
Step 6: Install Cilium DNS Proxy HA
Create a file named cilium-dns-proxy-ha-values.yaml:
kubectl rollout status -n kube-system ds/cilium-dnsproxy --watch
Success
You now have a fully functional EKS cluster with Cilium CNI, Hubble observability, and Tetragon security!
Splunk Integration
Overview
The Splunk OpenTelemetry Collector uses Prometheus receivers to scrape metrics from all Isovalent components. Each component exposes metrics on different ports, and because Cilium and Hubble share the same pods (just different ports), we configure separate receivers for each one rather than relying on pod annotations.
Create a file named splunk-otel-collector-values.yaml. Replace the credential placeholders with your actual values.
terminationGracePeriodSeconds:30agent:config:extensions:# k8s_observer watches the Kubernetes API for pod and port changes.# This enables automatic service discovery without static endpoint lists.k8s_observer:auth_type:serviceAccountobserve_pods:truereceivers:kubeletstats:collection_interval:30sinsecure_skip_verify:true# Cilium Agent (port 9962) and Hubble (port 9965) both run in the# same DaemonSet pod, identified by label k8s-app=cilium.# We use two separate scrape jobs because they're on different ports.prometheus/isovalent_cilium:config:scrape_configs:- job_name:'cilium_metrics_9962'scrape_interval:30smetrics_path:/metricskubernetes_sd_configs:- role:podrelabel_configs:- source_labels:[__meta_kubernetes_pod_label_k8s_app]action:keepregex:cilium- source_labels:[__meta_kubernetes_pod_ip]target_label:__address__replacement:${__meta_kubernetes_pod_ip}:9962- target_label:jobreplacement:'cilium_metrics_9962'- job_name:'hubble_metrics_9965'scrape_interval:30smetrics_path:/metricskubernetes_sd_configs:- role:podrelabel_configs:- source_labels:[__meta_kubernetes_pod_label_k8s_app]action:keepregex:cilium- source_labels:[__meta_kubernetes_pod_ip]target_label:__address__replacement:${__meta_kubernetes_pod_ip}:9965- target_label:jobreplacement:'hubble_metrics_9965'# Cilium Envoy uses a different pod label (k8s-app=cilium-envoy)prometheus/isovalent_envoy:config:scrape_configs:- job_name:'envoy_metrics_9964'scrape_interval:30smetrics_path:/metricskubernetes_sd_configs:- role:podrelabel_configs:- source_labels:[__meta_kubernetes_pod_label_k8s_app]action:keepregex:cilium-envoy- source_labels:[__meta_kubernetes_pod_ip]target_label:__address__replacement:${__meta_kubernetes_pod_ip}:9964- target_label:jobreplacement:'cilium_metrics_9964'# Cilium Operator is a Deployment (not DaemonSet), identified by io.cilium.app=operatorprometheus/isovalent_operator:config:scrape_configs:- job_name:'cilium_operator_metrics_9963'scrape_interval:30smetrics_path:/metricskubernetes_sd_configs:- role:podrelabel_configs:- source_labels:[__meta_kubernetes_pod_label_io_cilium_app]action:keepregex:operator- target_label:jobreplacement:'cilium_metrics_9963'# Tetragon is identified by app.kubernetes.io/name=tetragonprometheus/isovalent_tetragon:config:scrape_configs:- job_name:'tetragon_metrics_2112'scrape_interval:30smetrics_path:/metricskubernetes_sd_configs:- role:podrelabel_configs:- source_labels:[__meta_kubernetes_pod_label_app_kubernetes_io_name]action:keepregex:tetragon- source_labels:[__meta_kubernetes_pod_ip]target_label:__address__replacement:${__meta_kubernetes_pod_ip}:2112- target_label:jobreplacement:'tetragon_metrics_2112'processors:# Strict allowlist filter: only forward metrics we've explicitly named.# Without this, Cilium and Tetragon can generate thousands of metric series# and overwhelm Splunk Observability Cloud with cardinality.filter/includemetrics:metrics:include:match_type:strictmetric_names:# --- Kubernetes base metrics ---- container.cpu.usage- container.memory.rss- k8s.container.restarts- k8s.pod.phase- node_namespace_pod_container- tcp.resets- tcp.syn_timeouts# --- Cilium Agent metrics ---# API rate limiting — detect if the agent is being throttled- cilium_api_limiter_processed_requests_total- cilium_api_limiter_processing_duration_seconds# BPF map utilization — alerts when eBPF maps are near capacity- cilium_bpf_map_ops_total# Controller health — tracks background reconciliation tasks- cilium_controllers_group_runs_total- cilium_controllers_runs_total# Endpoint state — how many pods are in each lifecycle state- cilium_endpoint_state# Agent error/warning counts — early warning for problems- cilium_errors_warnings_total# IP address allocation tracking- cilium_ip_addresses- cilium_ipam_capacity# Kubernetes event processing rate- cilium_kubernetes_events_total# L7 policy enforcement (HTTP, DNS, Kafka)- cilium_policy_l7_total# DNS proxy latency histogram — key metric for catching DNS saturation- cilium_proxy_upstream_reply_seconds_bucket# --- Hubble metrics ---# DNS query and response counts — primary indicator in the demo scenario- hubble_dns_queries_total- hubble_dns_responses_total# Packet drops by reason (policy_denied, invalid, TTL_exceeded, etc.)- hubble_drop_total# Total flows processed — overall network activity volume- hubble_flows_processed_total# HTTP request latency histogram and total count- hubble_http_request_duration_seconds_bucket- hubble_http_requests_total# ICMP traffic tracking- hubble_icmp_total# Policy verdict counts (forwarded vs. dropped by policy)- hubble_policy_verdicts_total# TCP flag tracking (SYN, FIN, RST) — connection lifecycle visibility- hubble_tcp_flags_total# --- Tetragon metrics ---# Total eBPF events processed- tetragon_events_total# DNS cache health- tetragon_dns_cache_evictions_total- tetragon_dns_cache_misses_total- tetragon_dns_total# HTTP response tracking with latency- tetragon_http_response_total- tetragon_http_stats_latency_bucket- tetragon_http_stats_latency_count- tetragon_http_stats_latency_sum# Layer3 errors- tetragon_layer3_event_errors_total# TCP socket statistics — per-connection RTT, retransmits, byte/segment counts# These power the latency and throughput views in Network Explorer- tetragon_socket_stats_retransmitsegs_total- tetragon_socket_stats_rxsegs_total- tetragon_socket_stats_srtt_count- tetragon_socket_stats_srtt_sum- tetragon_socket_stats_txbytes_total- tetragon_socket_stats_txsegs_total- tetragon_socket_stats_rxbytes_total# UDP statistics- tetragon_socket_stats_udp_retrieve_total- tetragon_socket_stats_udp_txbytes_total- tetragon_socket_stats_udp_txsegs_total- tetragon_socket_stats_udp_rxbytes_total# Network flow events (connect, close, send, receive)- tetragon_network_connect_total- tetragon_network_close_total- tetragon_network_send_total- tetragon_network_receive_totalresourcedetection:detectors:[system]system:hostname_sources:[os]service:pipelines:metrics:receivers:- prometheus/isovalent_cilium- prometheus/isovalent_envoy- prometheus/isovalent_operator- prometheus/isovalent_tetragon- hostmetrics- kubeletstats- otlpprocessors:- filter/includemetrics- resourcedetectionautodetect:prometheus:trueclusterName:isovalent-demosplunkObservability:accessToken:<YOUR-SPLUNK-ACCESS-TOKEN>realm:<YOUR-SPLUNK-REALM> # e.g. us1, us2, eu0profilingEnabled:truecloudProvider:awsdistribution:eksenvironment:isovalent-demo# Gateway mode runs a central collector deployment that receives from all agents.# Agents send to the gateway, which handles batching and export to Splunk.# This reduces the number of direct connections to Splunk's ingest endpoint.gateway:enabled:trueresources:requests:cpu:250mmemory:512Milimits:cpu:1memory:1Gi# certmanager handles mTLS between the OTel Collector agent and gatewaycertmanager:enabled:true
Important: Replace:
<YOUR-SPLUNK-ACCESS-TOKEN> with your Splunk Observability Cloud access token
<YOUR-SPLUNK-REALM> with your realm (e.g., us1, us2, eu0)
Why we use a strict metric allowlist
Cilium can emit thousands of unique metric series when you factor in all the label combinations for workloads, namespaces, and protocol details. Without the filter/includemetrics allowlist, a busy cluster can easily generate 50,000+ active series and overwhelm Splunk’s ingestion. The list above is curated to include exactly the metrics that power the Cilium and Hubble dashboards, plus the Tetragon socket stats needed for Network Explorer. If you add new dashboards later, you can add metrics to this list.
What Tetragon socket stats enable
The tetragon_socket_stats_* metrics are what make per-connection latency and throughput analysis possible in Splunk’s Network Explorer. srtt_count/srtt_sum give you average TCP round-trip time per workload. retransmitsegs_total surfaces packet loss and congestion. txbytes/rxbytes show bandwidth per connection. None of this is visible through APM or standard infrastructure metrics.
Demo — Investigating a DNS Issue with Isovalent and Splunk
What This Demo Shows
This demo tells a story that every ops or platform team has lived through: something is broken, users are complaining, and you have no idea where to start. The investigation takes you through the usual first stops — APM looks fine, infrastructure looks fine — and then pivots to the network layer, where Isovalent’s Hubble observability, flowing into Splunk, reveals the real problem: a DNS overload that was completely invisible to every other tool.
The application is jobs-app, a simulated multi-service hiring platform running in the tenant-jobs namespace. It has a frontend (recruiter, jobposting), a central API (coreapi), a background data pipeline (Kafka + resumes + loader), and a crawler service that periodically makes HTTP calls out to the internet. The crawler is going to be the villain in this story.
Key Takeaway
APM and infrastructure metrics look healthy. The root cause — a DNS overload — is only visible through the Isovalent Hubble dashboards in Splunk, because it lives below the application layer.
Before You Start
Do this before anyone is in the room. You want to be sitting at a clean, healthy dashboard when the demo begins — not fiddling with kubectl while people watch.
Deploy the Jobs App
If you haven’t already, deploy the jobs-app Helm chart from the isovalent-demo-jobs-app repository:
Run through these checks so you’re not surprised mid-demo:
# Confirm your nodes are healthykubectl get nodes
# Confirm Cilium and Hubble are running on both nodeskubectl get pods -n kube-system | grep -E "(cilium|hubble)"# Confirm the Splunk OTel Collector is running — this is what ships metrics to Splunkkubectl get pods -n otel-splunk
# Confirm the jobs-app is fully deployed and healthykubectl get pods -n tenant-jobs
Important
All pods must be in Running state before proceeding. If the OTel Collector isn’t up, no metrics will appear in Splunk and the demo won’t land.
Reset the App to a Healthy Baseline
Make sure the crawler is running at a calm, normal pace — 1 replica, crawling every 0.5 to 5 seconds:
Then wait at least 5 minutes. Splunk needs time to ingest a clean baseline so the spike you’re about to create is visually obvious. Skip this and the charts won’t tell a clear story.
Inject the Problem
About 5–10 minutes before the demo starts (or live during the demo for effect), run:
This scales the crawler from 1 pod up to 5, and cranks the crawl interval down to 0.2–0.3 seconds. Each crawler pod makes an HTTP request to api.github.com and every one of those requests needs a DNS lookup first. Five pods hammering DNS multiple times per second generates around 15–25 DNS queries per second sustained — enough to saturate the DNS proxy and cause response latency to back up. Other services in the namespace that depend on DNS start experiencing intermittent failures, which is exactly what’s in our ticket.
Act 1 — A Ticket Shows Up
Start by painting the picture. You don’t need to click anything yet — just set the scene.
“So it’s a normal afternoon and an ITSM ticket comes in. The jobs application team is saying that end users are reporting intermittent 500 errors on the recruiter and job posting pages, and load times have gotten noticeably worse over the last 15 minutes or so. It’s been escalated to P2. Let’s dig in.”
Ticket
INC-4072
Priority
P2 — High
Summary
Intermittent failures and slow response times on jobs-app
Description
Recruiter and job posting pages are returning 500 errors intermittently. Users report page loads have slowed significantly over the last 15 minutes. Engineering has not made any recent deployments.
Reported by
Application Support Team
Affected namespace
tenant-jobs
“No recent deployments — that’s actually the interesting part. There’s no obvious change event to blame. So we need to figure out what changed on our own. Where do we start? APM.”
Act 2 — Check APM (Dead End)
This is where most people would go first, and that’s the point. Show APM, find it unhelpful, and use that to build the case for needing something deeper.
Navigate to: Splunk Observability Cloud → APM → Service Map
The service map for the tenant-jobs environment shows the topology: recruiter and jobposting both call coreapi, which connects to Elasticsearch. The resumes and loader services communicate over Kafka in the background.
“Here’s our service map. Every service is lit up — they’re all responding, all connected. Let’s look at what the numbers are actually saying.
Request rates look normal. Latency is slightly elevated, maybe, but nothing that would explain user-facing errors. Now look at the error rate on coreapi — it’s sitting around 10%. You might think that’s the problem, but it’s not. This app has a configurable error rate baked in as part of the setup. Ten percent is baseline, not a regression.
So APM is telling us: services are alive, traffic is flowing, and the error rate hasn’t changed. There’s nothing in the application traces that points to a root cause. Let’s try infrastructure.”
Why APM Can’t See This
APM instruments application code — it observes what happens inside your services. It has no visibility into what happens at the network layer before a connection is even established. DNS resolution, connection drops, and packet-level events are invisible to it by design.
Act 3 — Check Infrastructure (Dead End)
Show infra, find it clean, and let the audience feel the frustration of not having answers yet.
“Let’s look at the cluster itself. Maybe something is resource-constrained — a node running hot, pods getting OOMKilled, something like that.
Both nodes look healthy. CPU and memory are well within normal bounds. Drilling into the pods — all of them are in Running state, no restarts, nothing being evicted. The containers themselves aren’t hitting their resource limits.
So now we’re in a bit of an uncomfortable spot. The ticket says users are seeing errors. APM says the app is running. Infrastructure says the cluster is healthy. Where does that leave us?
This is actually a really common situation. There’s a whole class of problems that live below the application layer and below the infrastructure layer — things happening at the network level that traditional monitoring tools simply can’t see. DNS failures, connection drops, policy denials, traffic asymmetry. These things don’t show up in traces or pod metrics. You need something that can observe the network itself. That’s where Isovalent comes in.”
Act 4 — The Network Tells the Truth
This is the heart of the demo. Take your time here.
Navigate to: Splunk Observability Cloud → Dashboards → Hubble by Isovalent
“Cilium — our CNI, the networking layer running on every node — has a built-in observability component called Hubble. Hubble uses eBPF to watch every single network flow in the cluster in real time. Not sampled, not approximated — every connection, every DNS request, every packet drop. And because we’ve set up the OpenTelemetry Collector to scrape those Hubble metrics and forward them to Splunk, we can see all of that right here in the same platform we were just looking at for APM and infrastructure.
Let’s pull up the Hubble dashboard.”
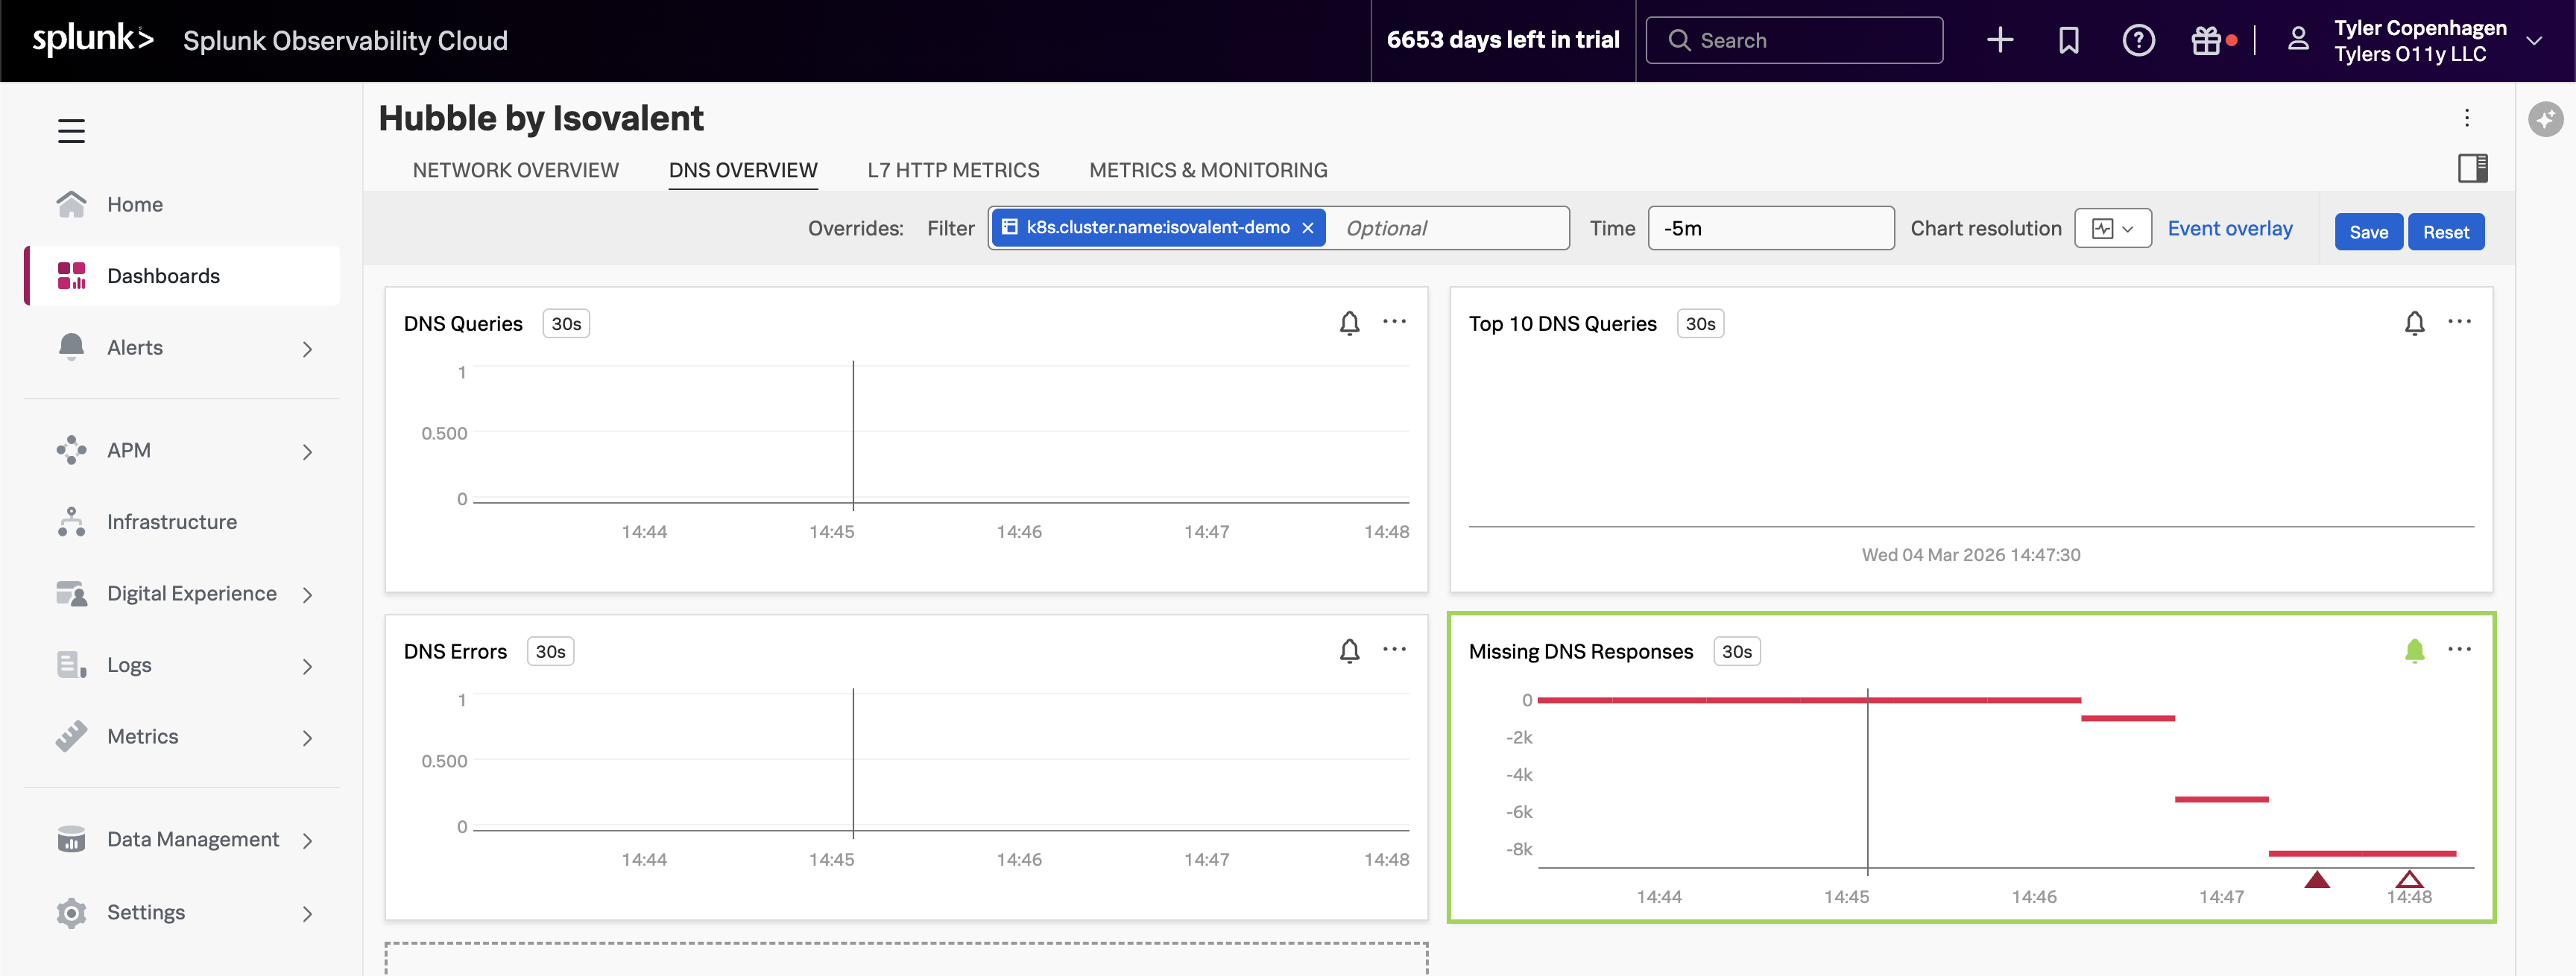
DNS Queries Are Out of Control
Point to the DNS Queries chart, then navigate to the DNS Overview tab.
“There it is. Look at the DNS query volume — it spiked sharply about 15 minutes ago. That timestamp lines up exactly with when the ticket was opened.
What you’re looking at is hubble_dns_queries_total, broken down by source namespace. The spike is entirely coming from tenant-jobs — our application namespace. Something in the application started generating a massive amount of DNS traffic, and the DNS proxy started struggling to keep up.
But look at the bottom right — the Missing DNS Responses chart. This is the one with the alert firing. The value is going deeply negative, which means DNS queries are being sent out but responses are never coming back. The DNS proxy is overwhelmed and connections are just timing out in silence. That’s the ripple effect showing up as 500 errors for our users.”
Top DNS Queries Reveal the Culprit
Point to the Top 10 DNS Queries chart.
“Now let’s figure out what’s making all these DNS requests. The Top 10 DNS Queries chart breaks down the most frequently queried domains, and one name is standing out by a mile: api.github.com.
That’s not a cluster-internal service — it’s an external endpoint. And the only thing in our app that talks to external endpoints is the crawler service. The crawler makes HTTP calls to an external URL as part of its job simulation. Every time it makes that HTTP call, it needs to resolve api.github.com through DNS first.
Normally this is fine. One crawler pod making a request every few seconds is totally manageable. But something has clearly changed about how aggressively it’s running.”
Dropped Flows Show the Blast Radius
Point to the Dropped Flows chart.
“The Dropped Flows chart is showing something else worth calling out. Hubble doesn’t just track successful connections — it captures every connection that gets rejected or dropped, along with a reason code for why. We’re seeing an uptick in drops starting at the exact same time as the DNS spike.
These drops are the downstream consequence of DNS overload. When services in the namespace try to make connections and DNS is too slow or failing, those connection attempts time out and get dropped. This is what APM was seeing as elevated latency — but APM had no idea it was a DNS problem underneath.”
Network Flow Volume Confirms the Pattern
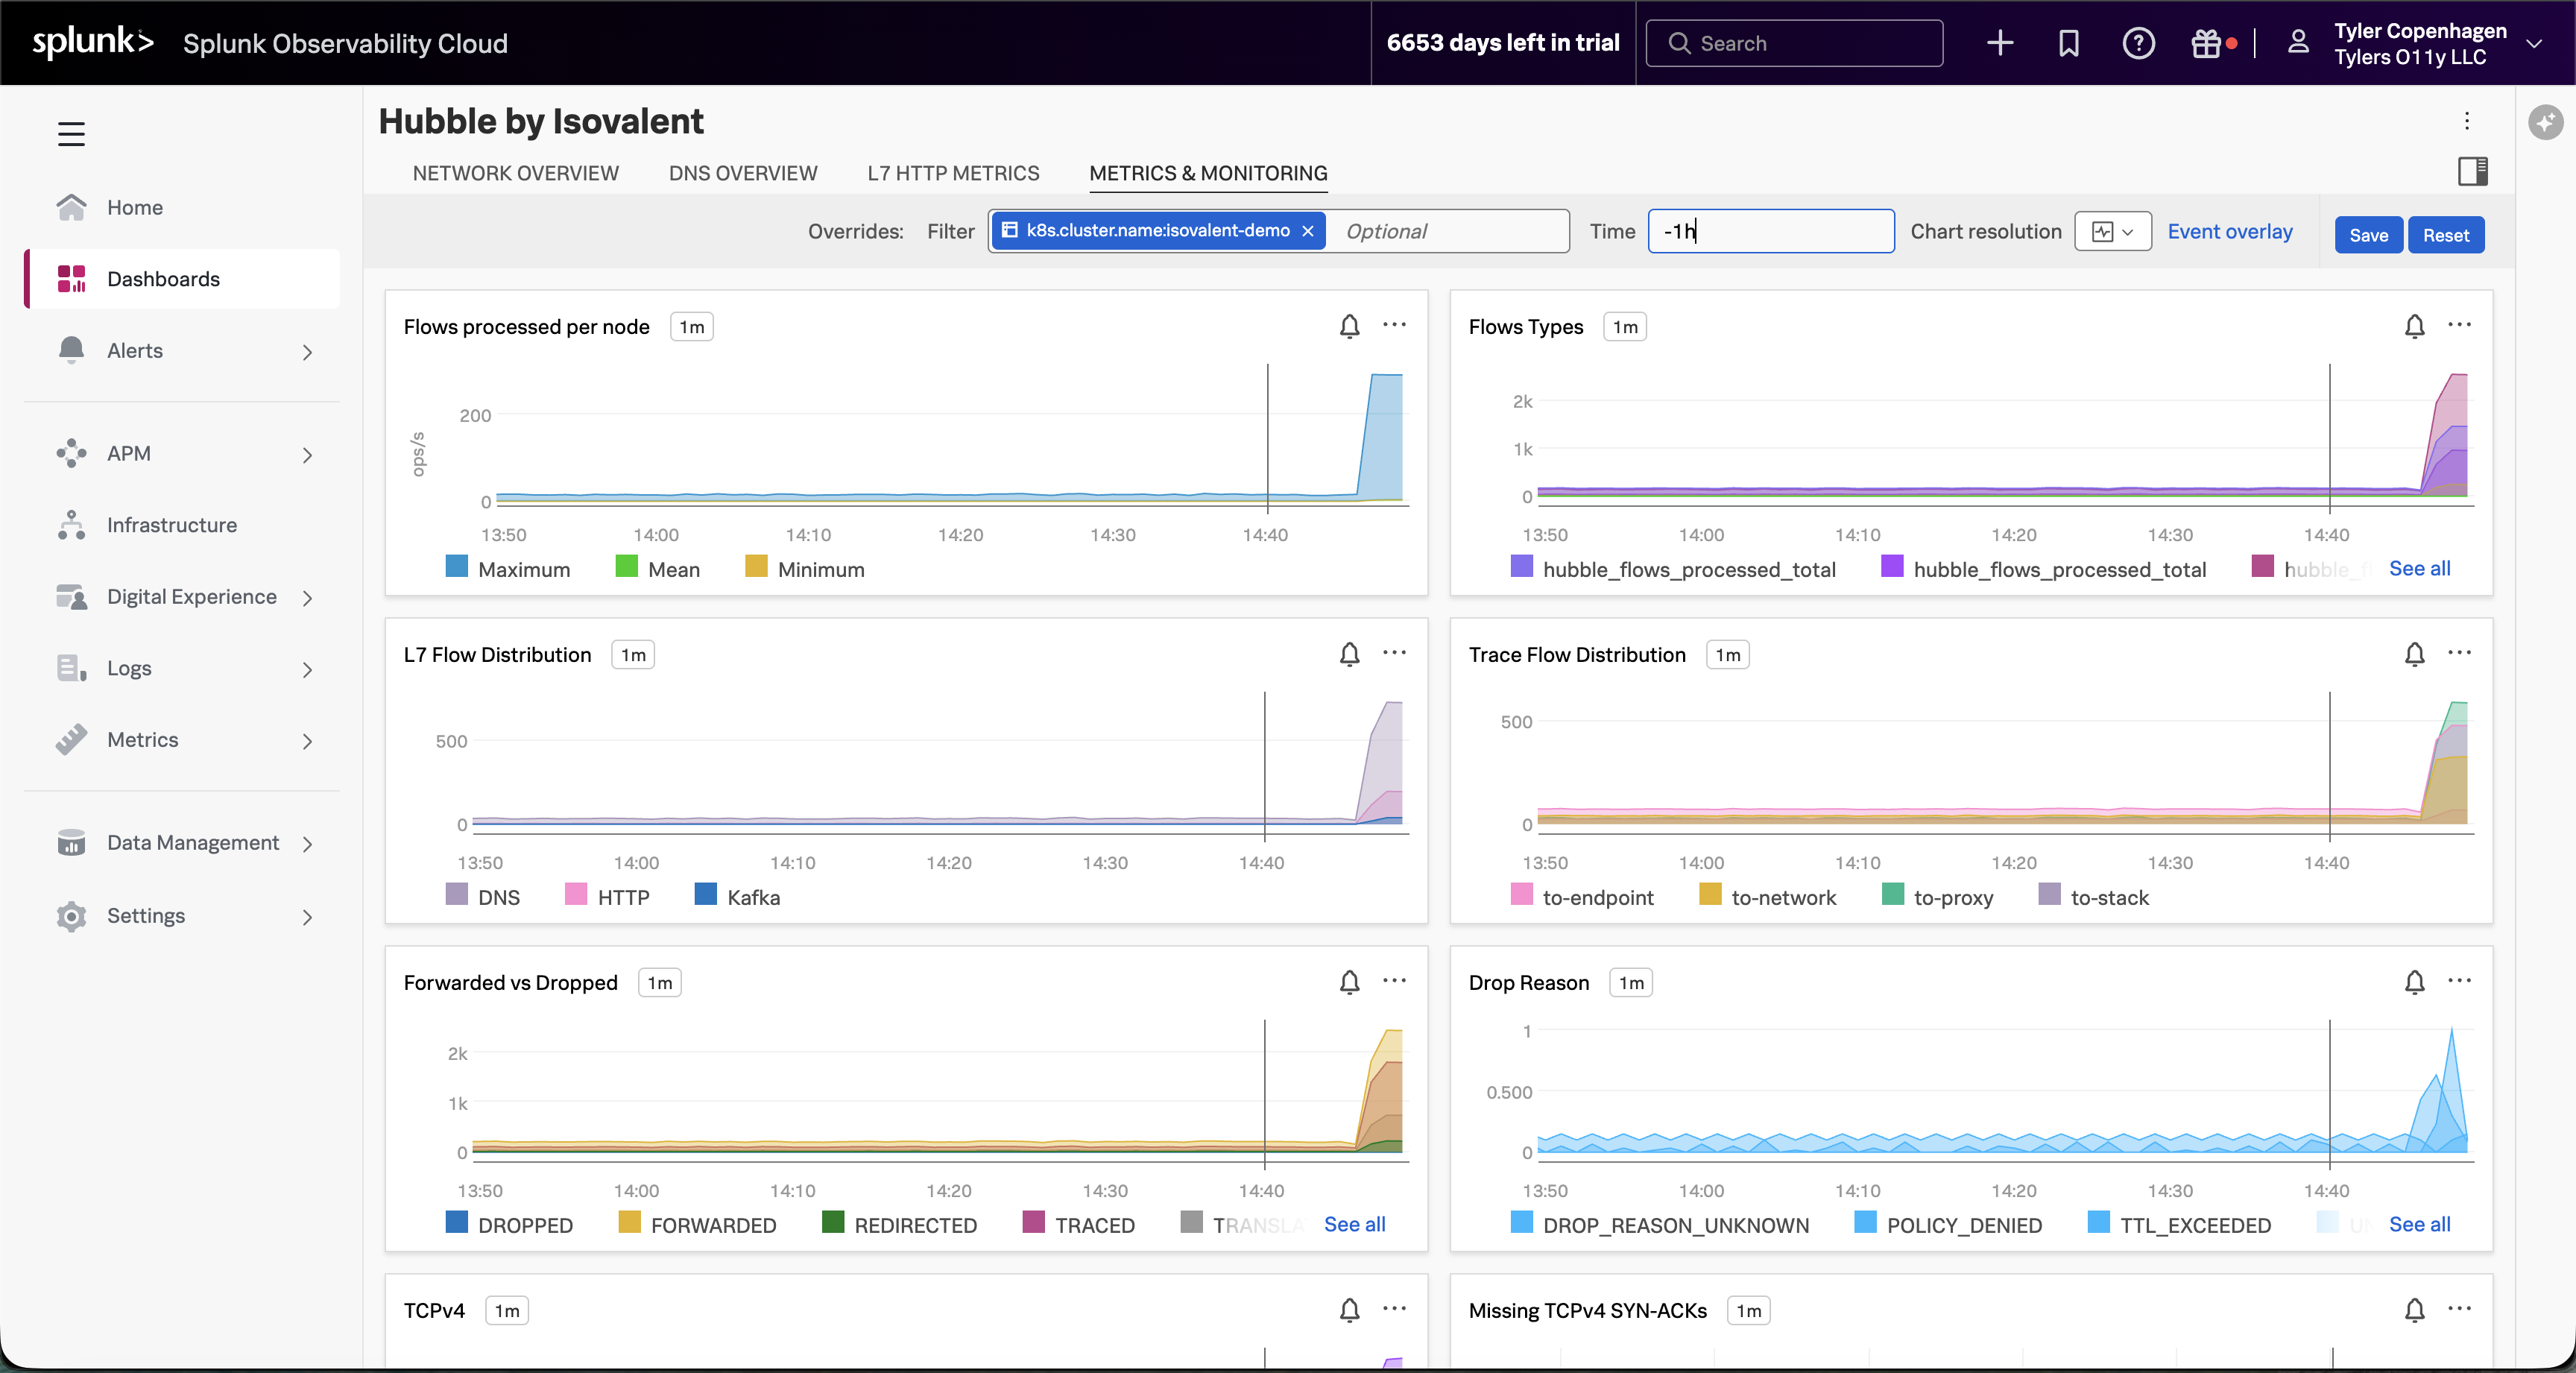
Navigate to the Metrics & Monitoring tab.
“And if you look at the Metrics & Monitoring tab, the full picture becomes even clearer. Flows processed per node has gone vertical — that’s raw network traffic volume. The Forwarded vs Dropped chart is showing a meaningful proportion of those flows being dropped rather than forwarded. And the Drop Reason breakdown tells us it’s a mix of TTL_EXCEEDED and DROP_REASON_UNKNOWN — exactly what you’d expect when DNS timeouts start cascading. Something changed at a specific moment in time, and everything after that point looks different from the baseline.”
L7 HTTP Traffic Tells an Interesting Story
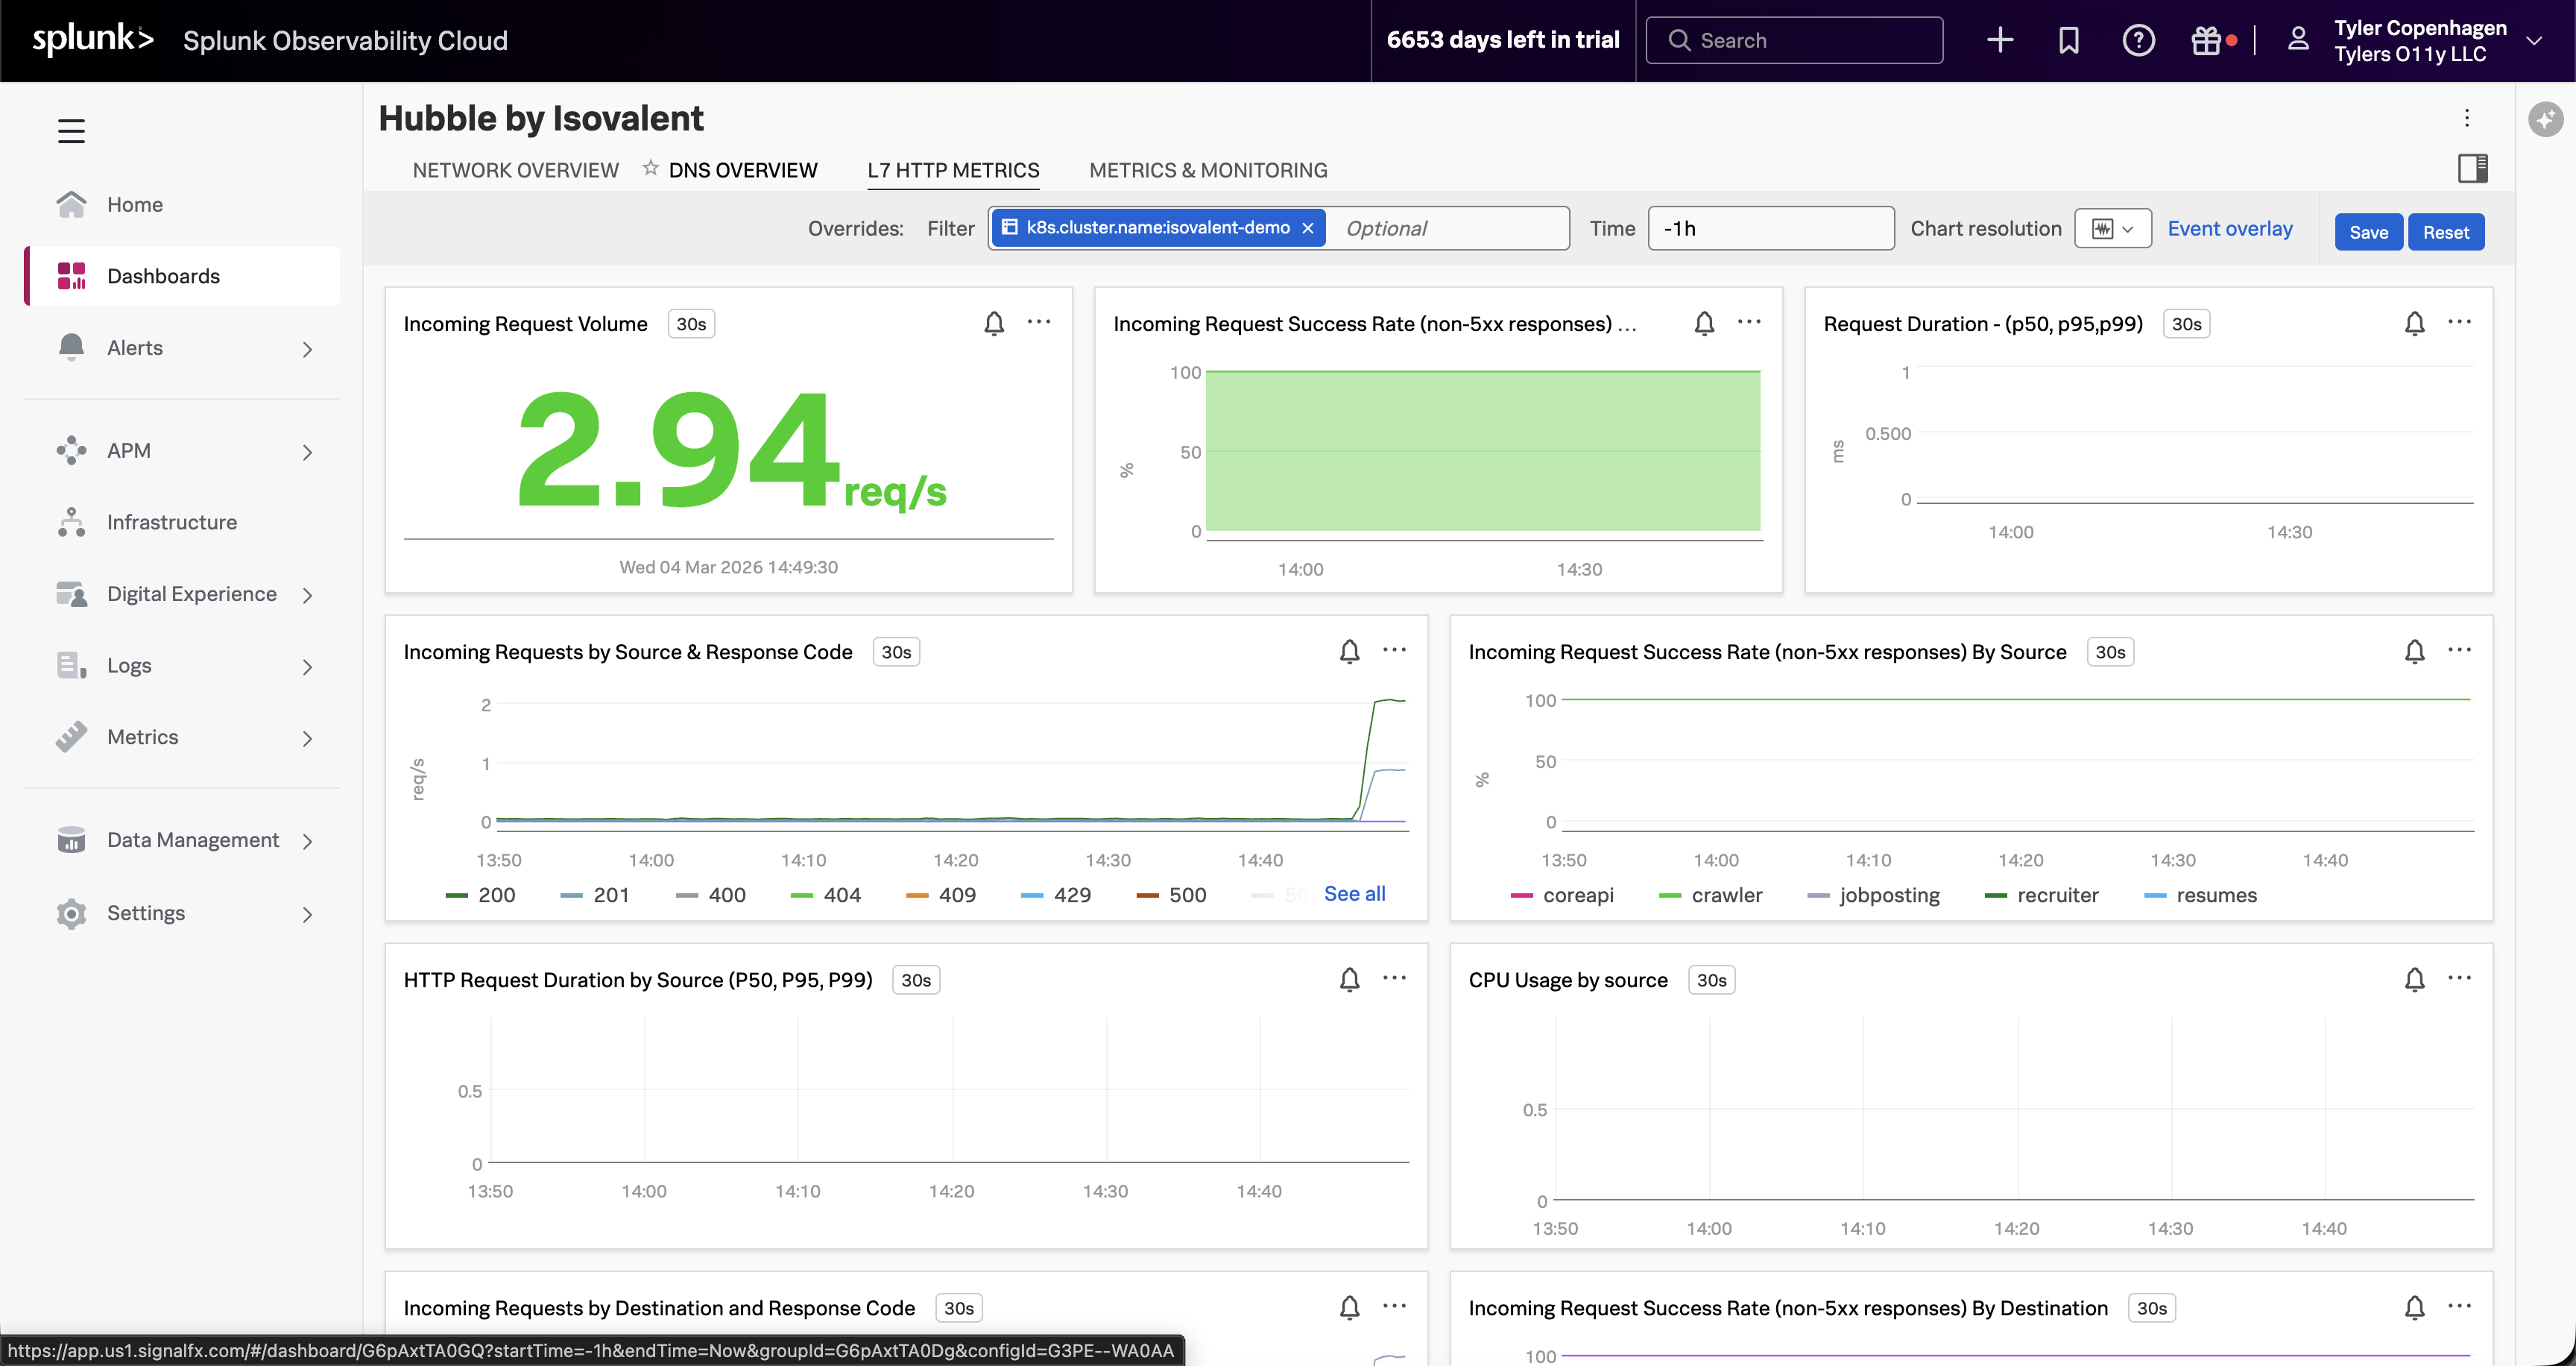
Navigate to the L7 HTTP Metrics tab.
“Here’s something worth pointing out on the L7 HTTP Metrics tab, because it actually reinforces why APM wasn’t helpful. The incoming request volume is non-zero — traffic is still flowing. The success rate chart looks mostly green. If you were only looking at HTTP-level visibility, you might conclude the app is fine.
But look at the Incoming Requests by Source chart. The crawler is generating a disproportionate share of traffic — you can see it separating out from the other services. It’s making HTTP calls successfully, which is why APM doesn’t flag it. The problem is happening one layer down, in DNS, before the HTTP connections even establish.”
Act 5 — Confirming the Root Cause
Now connect the dots and prove it.
“So here’s the full picture: at some point, the crawler service got scaled up from 1 replica to 5, and its crawl interval got set to something extremely aggressive — every 0.2 to 0.3 seconds. That’s 5 pods, each firing off a DNS lookup to resolve api.github.com multiple times per second. Combined, that’s 15 to 25 DNS queries per second, sustained. The DNS proxy wasn’t built to handle that kind of load from a single workload, so it starts queuing, slowing down, and eventually dropping requests. Every other service in the namespace that needs DNS resolution gets caught in the crossfire.
Let’s confirm that’s what we’re looking at.”
# Confirm the current crawler replica count — you'll see 5kubectl get deploy crawler -n tenant-jobs
# Pull the environment config to see the crawl frequency settingskubectl get deploy crawler -n tenant-jobs \
-o jsonpath='{.spec.template.spec.containers[0].env}'| jq .
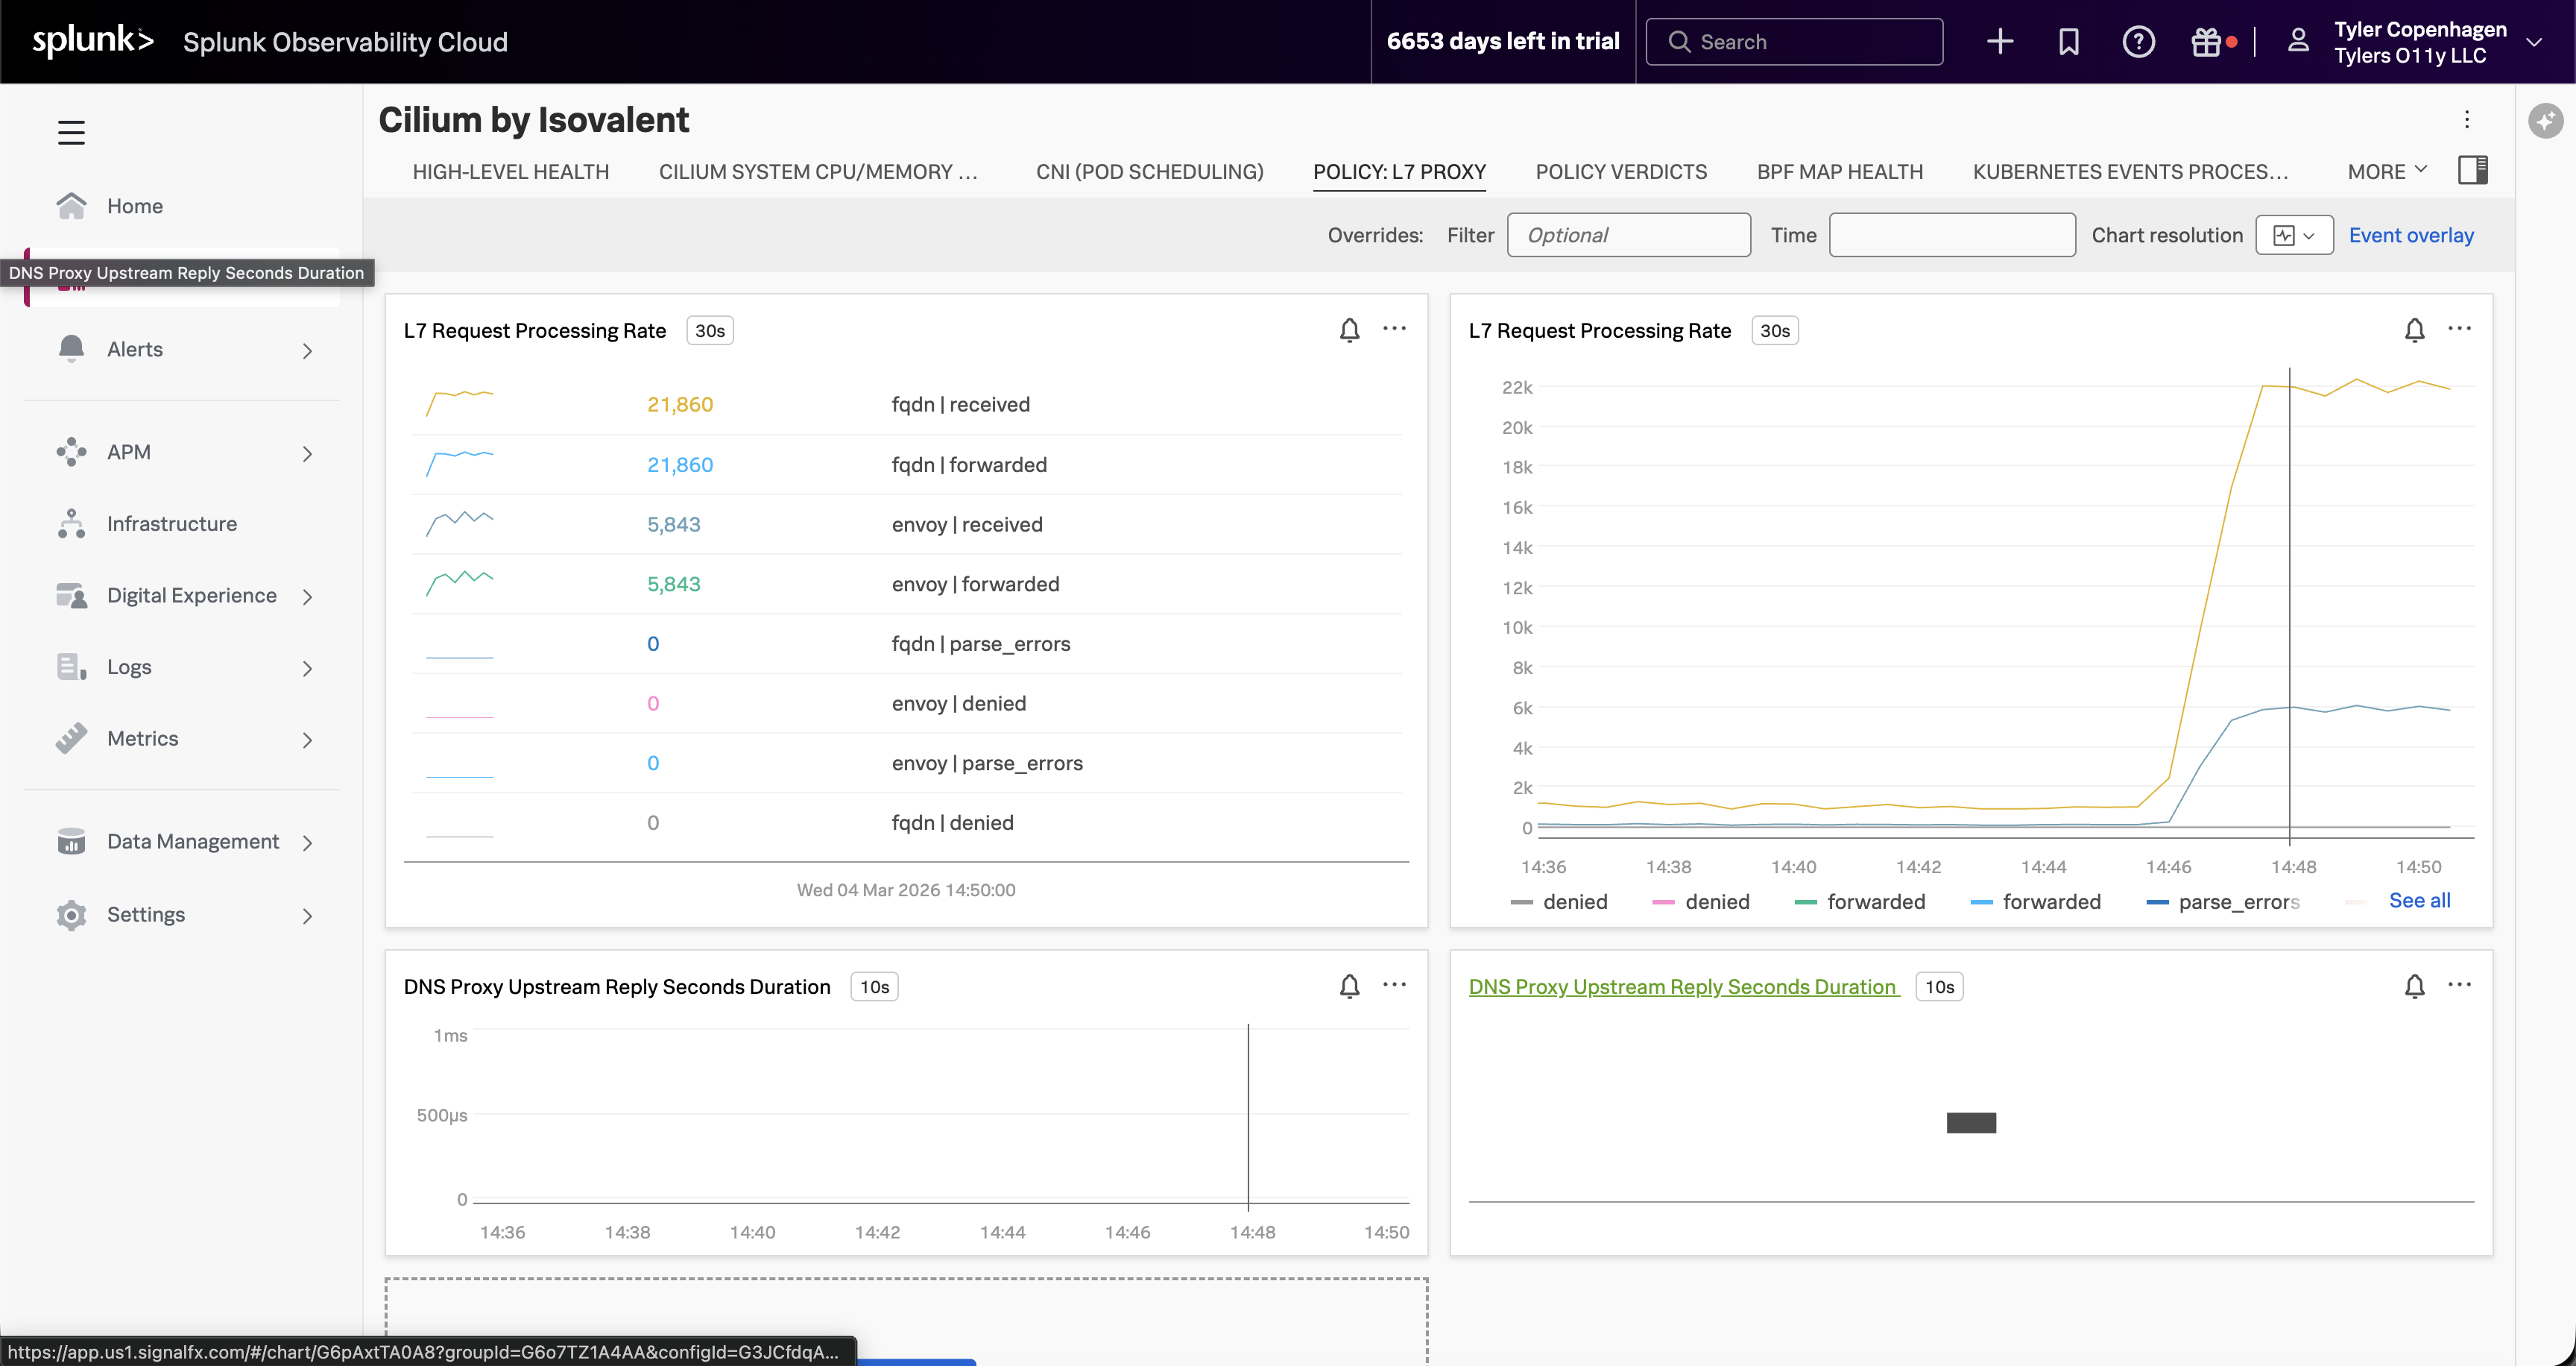
Optionally, switch over to the Cilium by Isovalent dashboard → Policy: L7 Proxy tab.
“If you want to see this from the Cilium side rather than the Hubble side, switch to the Cilium by Isovalent dashboard and look at the Policy: L7 Proxy tab. The L7 Request Processing Rate for FQDN — that’s DNS — is sitting at over 21,000 requests. That’s not per minute. The DNS proxy has been processing an extraordinary volume of FQDN lookups, all of them being received and forwarded, which is why it started backing up. This view also shows the DNS Proxy Upstream Reply latency, which confirms the proxy is under pressure.”
*“There it is. Five replicas, crawling every 0.2 to 0.3 seconds.
APM can’t see this because it instruments code, not DNS. Infrastructure monitoring can’t see this because the pods are healthy — they’re doing exactly what they were configured to do. The only tool that could catch this is something operating at the eBPF level, watching every packet, every DNS request, every connection attempt in real time. That’s Hubble. And because we’ve wired it into Splunk, we caught it in the same dashboard we use for everything else.”
Act 6 — Fix It Live
This part is satisfying because you can watch the charts recover in real time.
“The fix is straightforward — scale the crawlers back down and restore the normal crawl interval.”
Go back to the Hubble by Isovalent dashboard and let it sit for a minute.
“Watch the DNS Queries chart — you can see it coming back down almost immediately. Within a minute or two it’ll be back at baseline. Dropped flows will go to zero. Network flow volume will return to normal.
And if we went back to APM right now, we’d see latency normalizing and the error rate settling back to its expected 10% baseline.
We can close the ticket. Root cause: crawler misconfiguration causing DNS saturation. Resolution: reverted crawler replica count and crawl interval via Helm. Time to resolution: about 15 minutes from when the ticket was opened.”
Remediation Complete
DNS query rate returns to baseline, dropped flows clear, and application health is restored — all visible live in the Hubble dashboard.
Act 7 — What This Actually Means
End by zooming out and making the value statement feel concrete.
“Let’s think about what just happened here. We had a real production-style problem — something breaking for end users — and we went through the standard playbook. APM said nothing was wrong. Infrastructure said nothing was wrong. And without Hubble, the next step probably would have been a war room call, people staring at logs, maybe a full restart of the namespace hoping it would go away.
Instead, we found it in under three minutes from the moment we opened the Hubble dashboard. Not because we’re smarter, but because we had visibility into the right layer.
The reason this works is eBPF. Cilium’s Hubble component hooks into the Linux kernel and observes network events at the source — before they ever reach application code, before they show up in a pod log, before they become a trace in APM. And by shipping those metrics through the OpenTelemetry Collector into Splunk, they sit right alongside your APM data and your infrastructure data in the same platform. You’re not switching tools or context-switching between five different dashboards. You add a layer of visibility that wasn’t there before, and you keep it in the workflow your team already knows.
That’s the story. Network observability isn’t a niche need — it’s the gap that APM and infrastructure monitoring leave behind. Isovalent fills that gap, and Splunk is where you see it.”