Getting Started
2 minutes Authors Chris Putnam, Sam Scudere-Weiss, & Tim HardAccessing your Workshop
Prior to this workshop you should have been provided details for accessing your workshop instance. This workshop utilizes a preconfigured environment which includes Splunk Enterprise and IT Service Intelligence. A link to the instance and the credentials are available in the Splunk Show instance details.
All of the data required for completing this workshop is available in the netops index. This index includes data from Catalyst Center, Merkai, and alerts from Solarwinds.
An automated break scenario runs on a 30 minute cycle. The Catalyst Center sites will be healthy for 15 minutes, followed by 15 minutes of degraded performance. While the environment is unhealthy, Issues and Alerts are generated from Catalyst Center and Solarwinds.
The majority of this workshop will be completed in IT Service Intelligence, so unless otherwise stated, navigation steps will start from there.
Access your workshop instance
1. Login to the Splunk instance using the URL and credentials provided in your Splunk Show workshop details.
2. Navigate to Apps -> IT Service Intelligence.
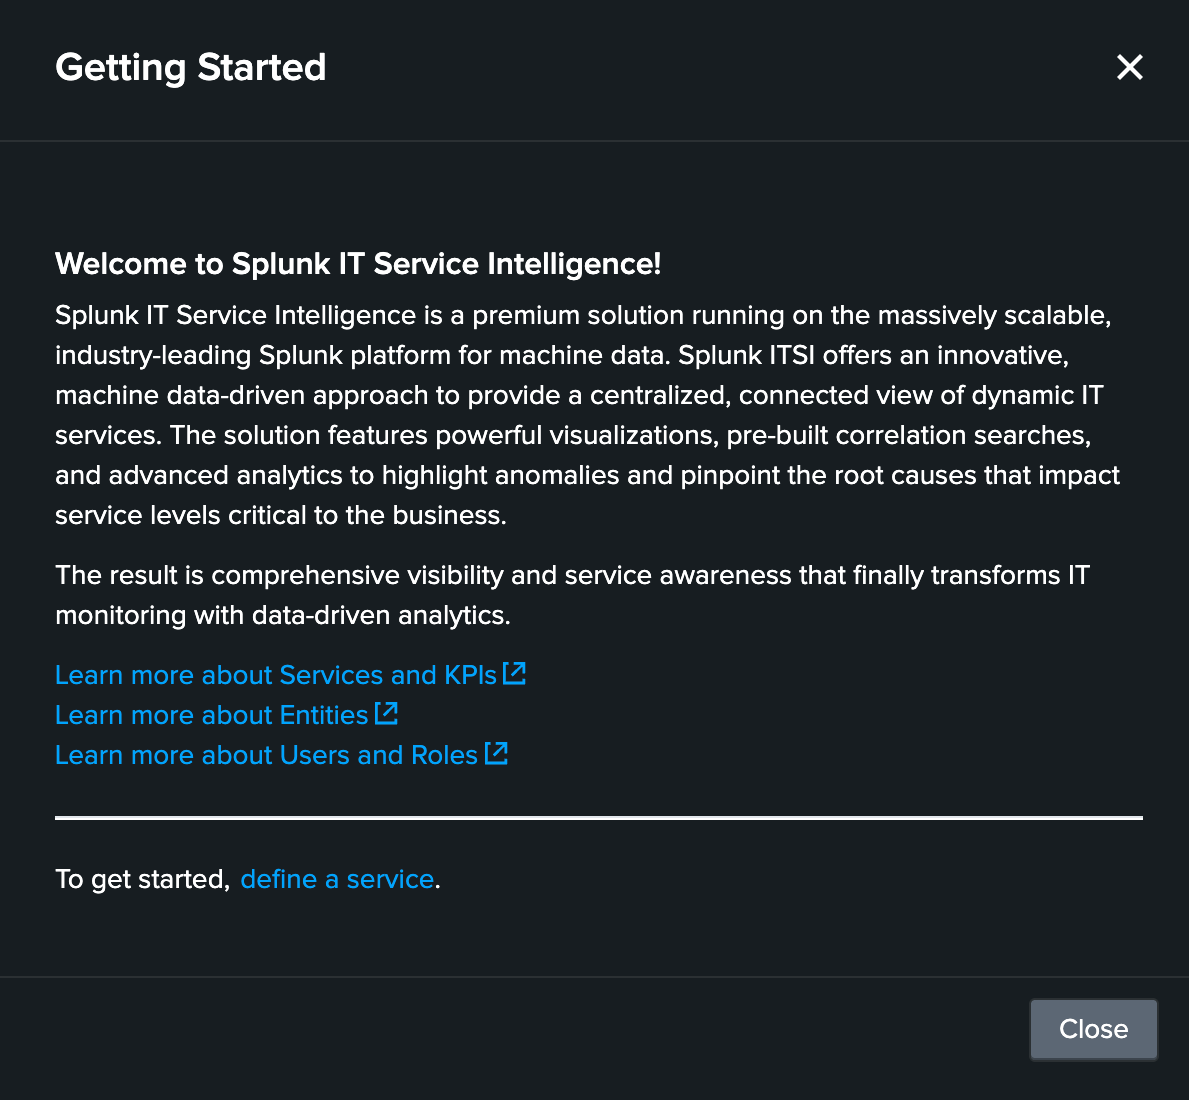
The first time you open ITSI you may have to dismiss the Getting Started Modal (after reading all of the important information, of course)
Getting Data In
While this workshop is using datagen to provide a consistent scenario, in a real environment the following Splunk Apps and Add-ons are required for implementing the use cases covered in this workshop.
1. Cisco Catalyst Add-on for Splunk
The Cisco Catalyst Add-on for Splunk collects data for different Cisco Products - Cisco Identity Services Engine, Cisco SD-WAN, Cisco Catalyst Center, and Cisco Cyber Vision. The add-on parses the data from these sources and stores them into the Splunk indexes.
2. Splunk App for Content Packs
The Splunk App for Content Packs includes prepackaged content that helps with quick setup for your IT Service Intelligence (ITSI) environments. This prepackaged content consists of KPI Base searches, ITSI Glass Tables, templates, and other objects.
Info
This workshop uses the Content Pack for Cisco Enterprise Networks which allows you to automatically import services using the topology information provided by the Cisco Catalyst Add-on for Splunk.
3. SolarWinds Add-on for Splunk (Optional)
The SolarWinds Add-on for Splunk collects SolarWinds alerts and SolarWinds asset inventory (network devices and their various attributes). This add-on also includes a generic input that allows you to schedule any SolarWinds query and index the corresponding output in Splunk. You can then directly analyze the data or use it as a contextual data feed to correlate with other application performance-related data in the Splunk platform.
Info
This add-on is optional for the use cases covered in this workshop as the SolarWinds alerts are sent directly to the Splunk HTTP Event Collector which does not require the add-on. In real world scenarios, the add-on can provide additional context and data enrichment using the asset inventory information.
Additional Apps/Add-ons
1. Cisco Meraki Add-on for Splunk
The Splunk Add-on for Cisco Meraki provides comprehensive network observability and security monitoring across your Meraki organizations. This add-on collects rich data via Cisco Meraki REST APIs and webhooks to deliver insights into network performance, security, and device health. Sample visualizations are also provided to help explore the data and create custom dashboards.
Info
While Cisco Meraki is not covered in this workshop, there is Cisco Meraki data available in the netops index which would be collected using the Cisco Meraki Add-on for Splunk
2. Cisco Enterprise Networking for Splunk Platform
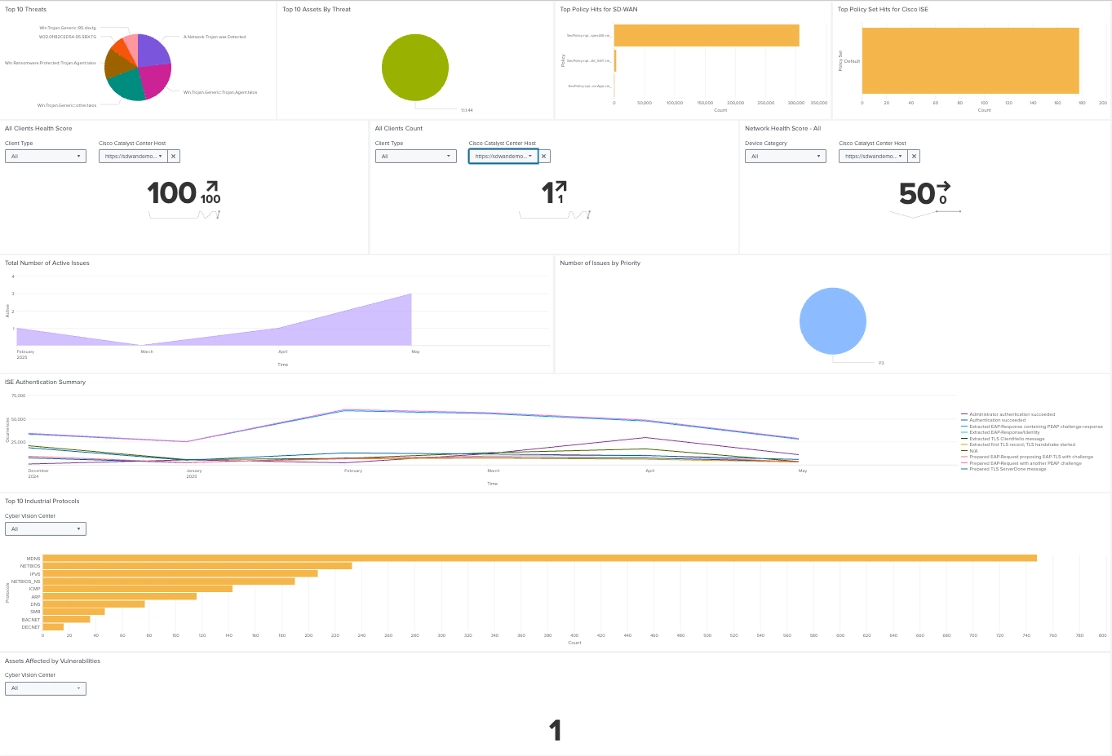
The Cisco Enterprise Networking for Splunk Platform presents visualizations in dashboards for different Cisco Products - Cisco Identity Services Engine, Cisco SD-WAN, Cisco Catalyst Center, Cisco Cyber Vision Cisco Meraki and Cisco ThousandEyes. The App uses the data collected by
- Cisco Catalyst Add-on for Splunk
- Cisco Catalyst Enhanced Netflow Add-on for Splunk
- Cisco Meraki Add-on for Splunk
- Cisco ThousandEyes App for Splunk