Validate the Configuration
2 minutes Authors Chris Putnam, Sam Scudere-Weiss, & Tim HardExercise: Validate the Configuration
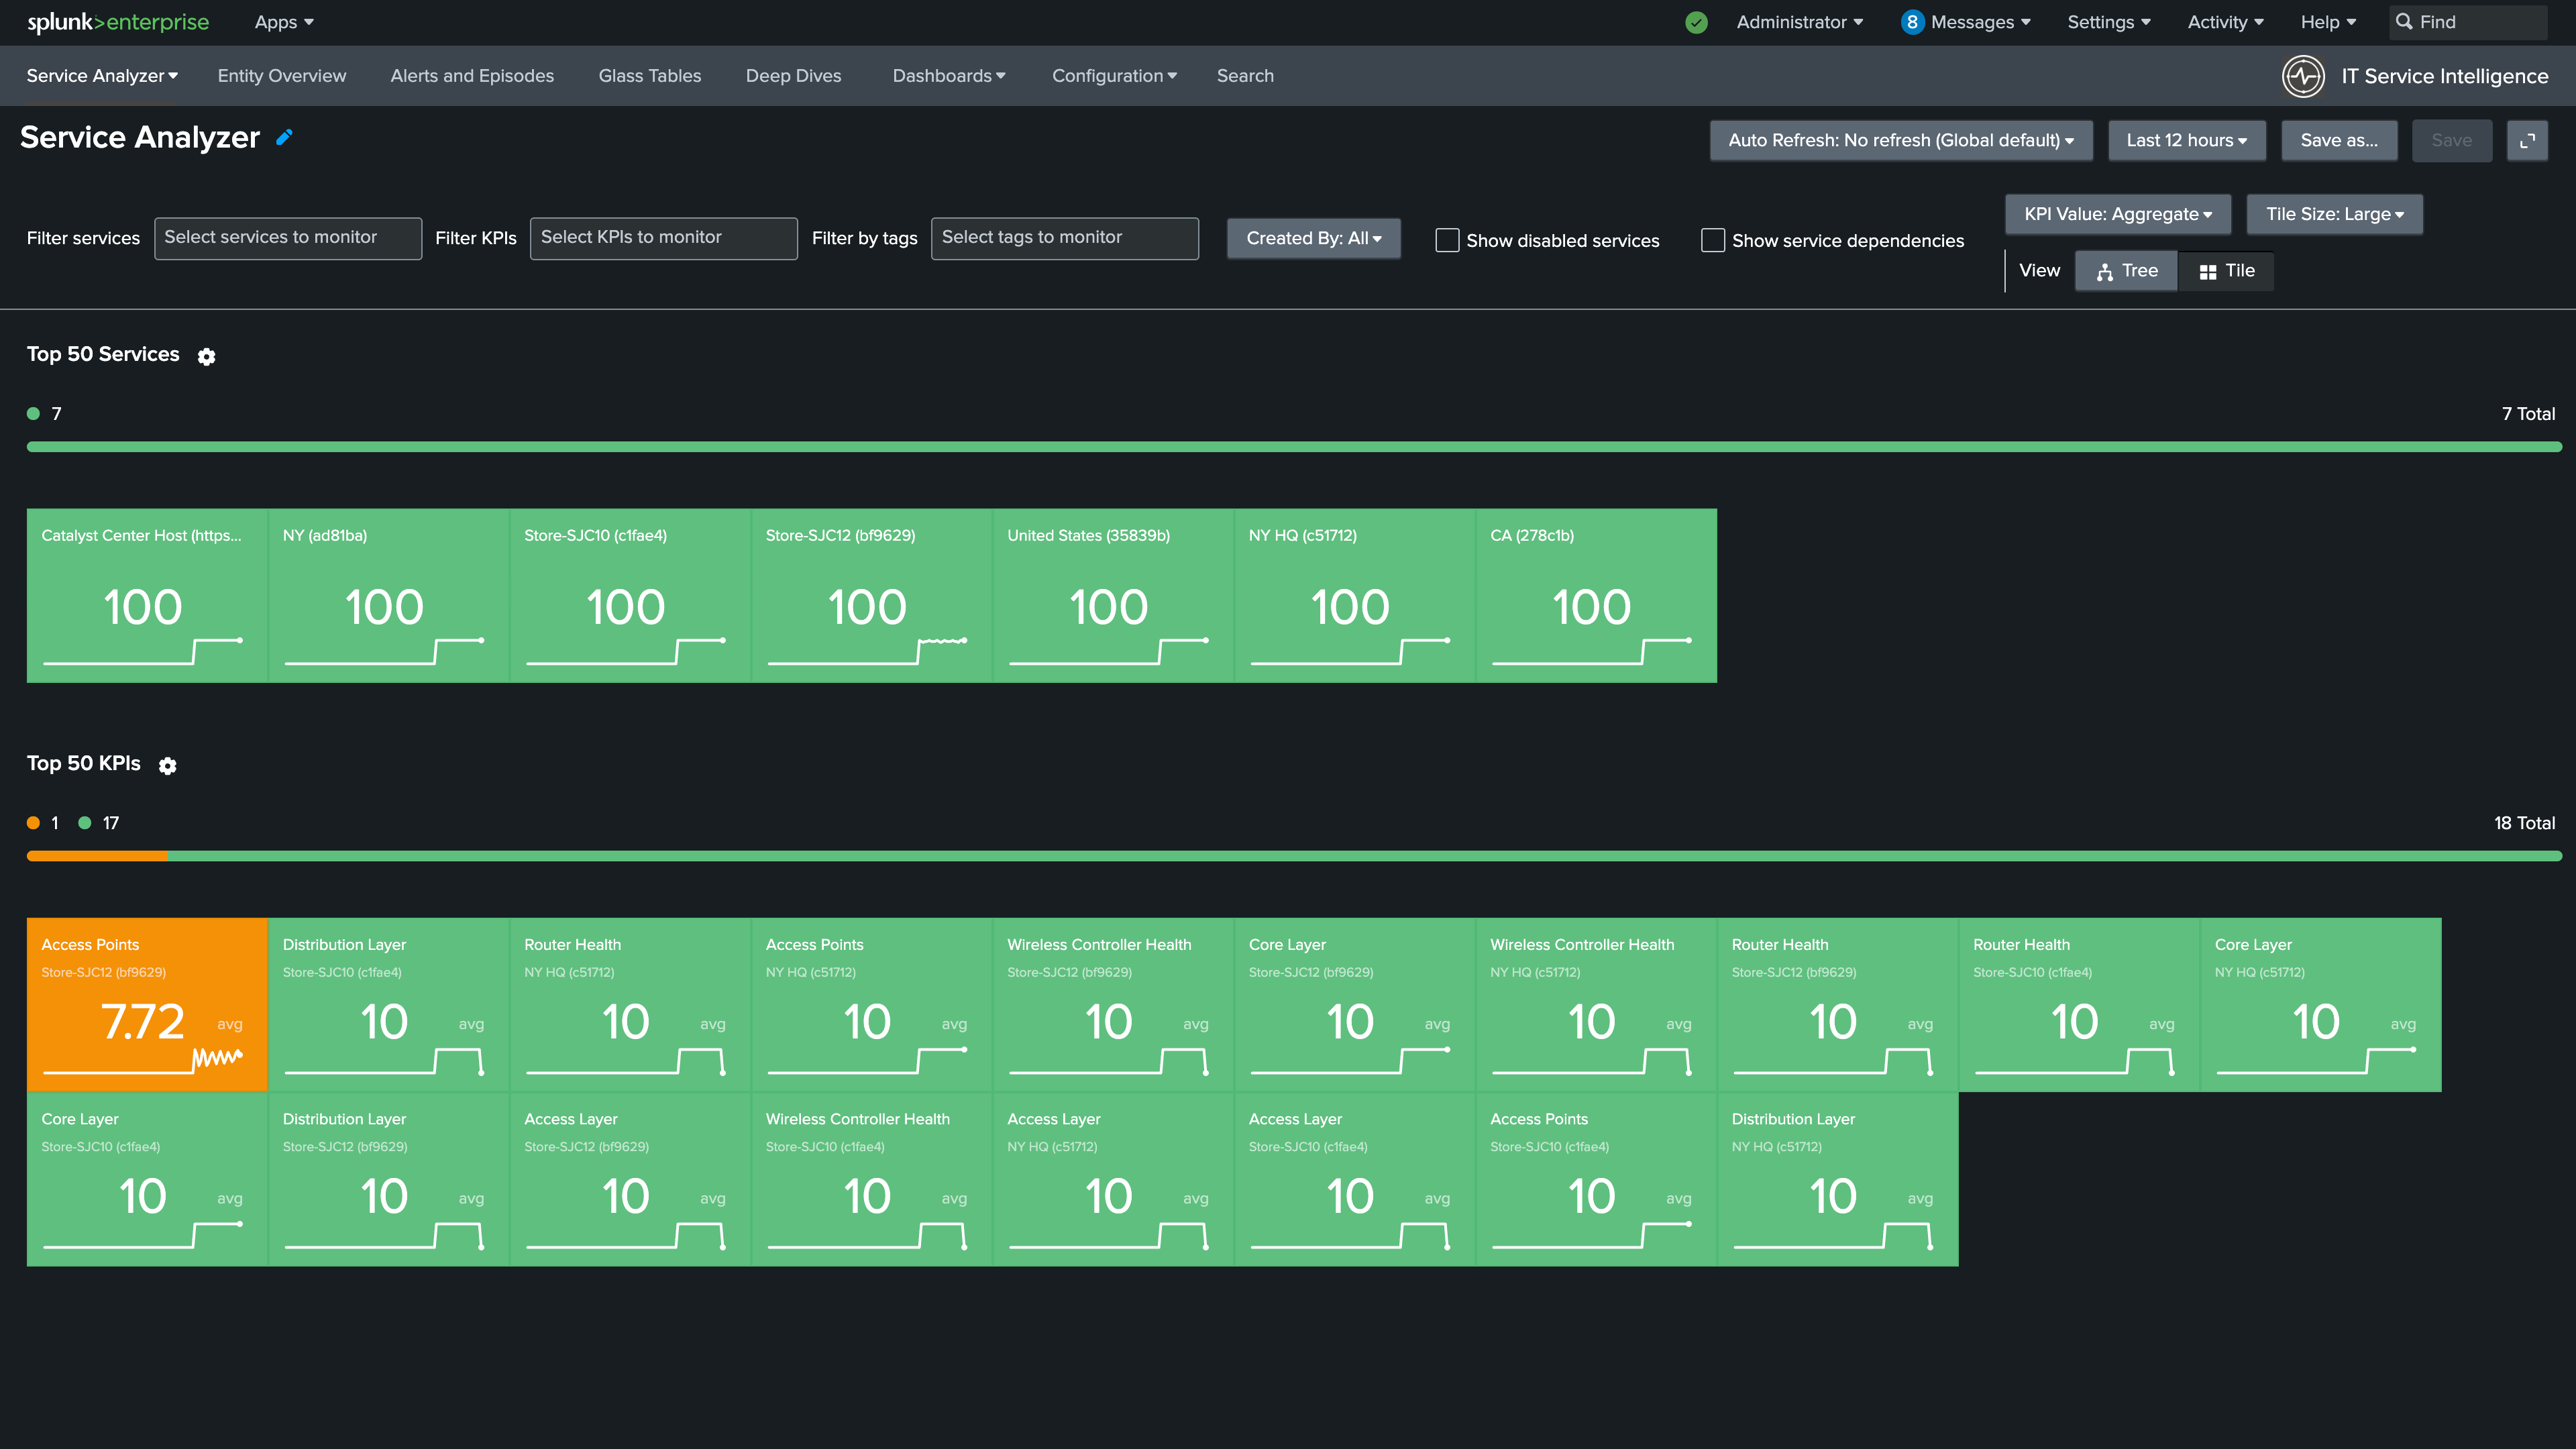
1. Navigate to the Service Analyzer > Default Service Analyzer.
You should see the services you imported and the KPIs that are part of the Catalyst Center Site Service Template.
It may take a few minutes for your services and KPIs to show a health status.
Info
The Service Analyzer shows the imported Catalyst Center site services and their current health status
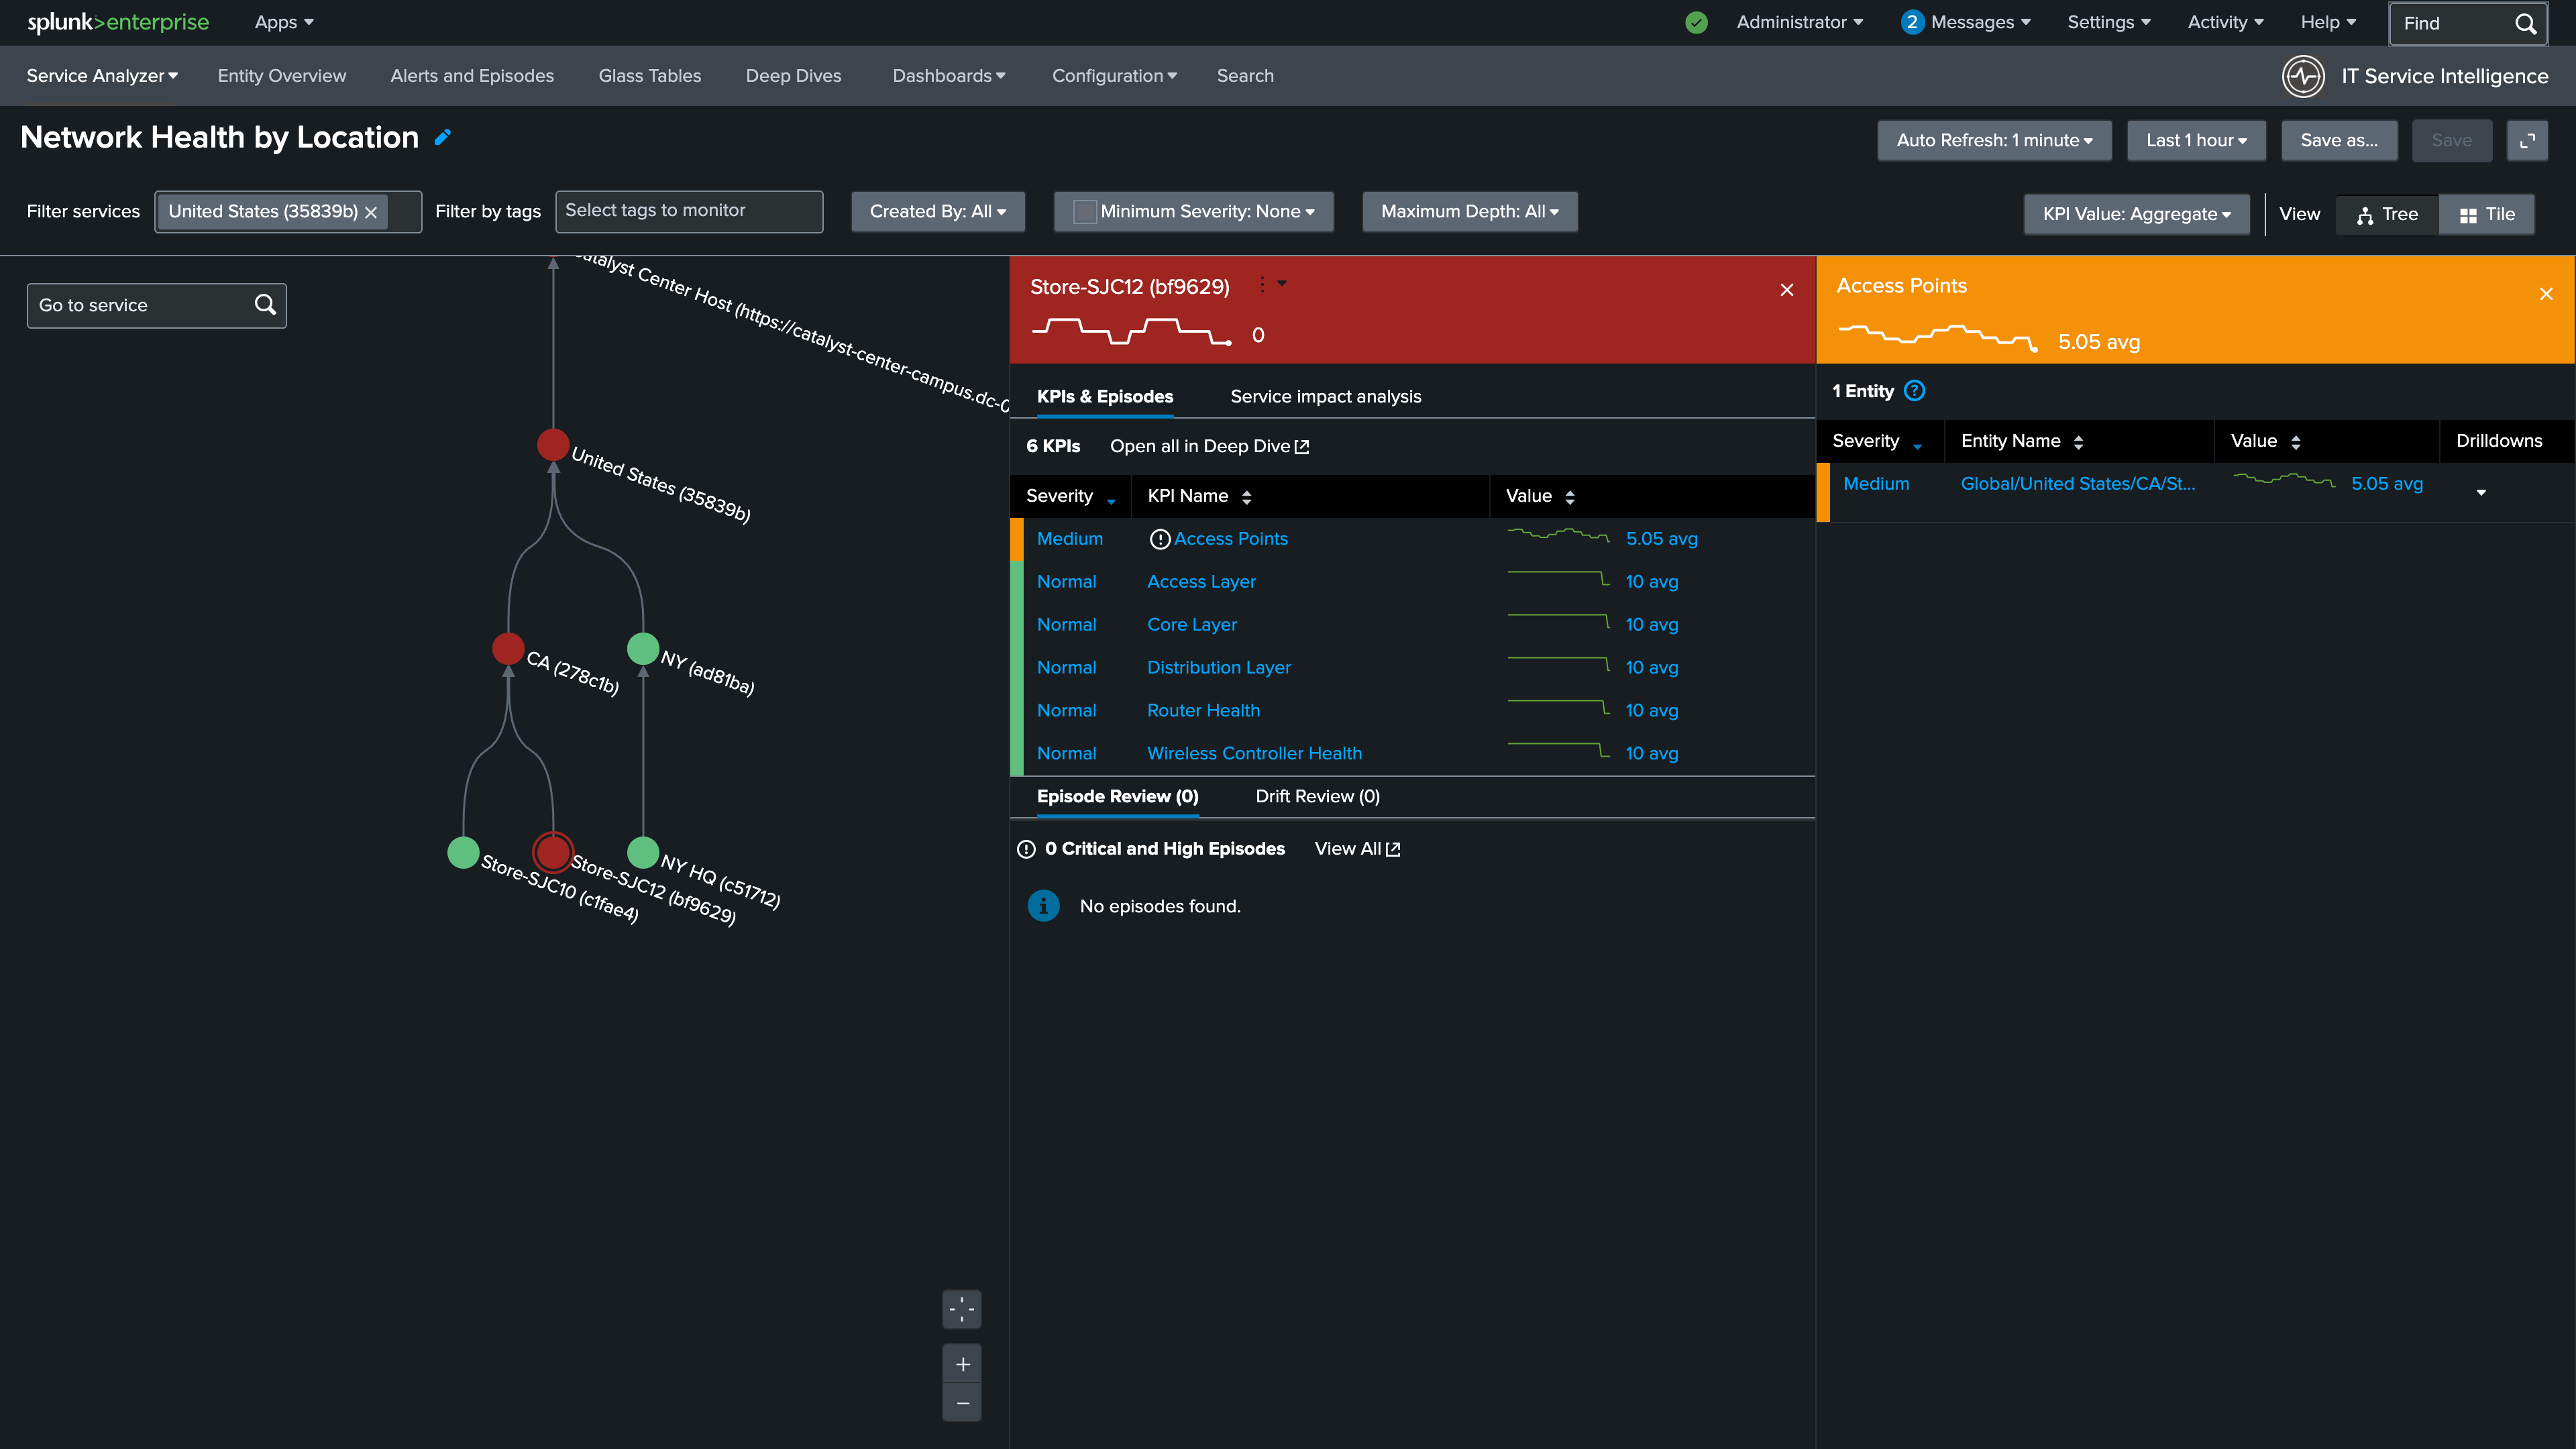
2. Click Tree to switch to the Service Tree view
3. Click one of the Store services in the service tree to view the KPIs associated with the Catalyst Center Site
Info
Clicking a service reveals its individual KPIs and their current health scores per network layer
Congrats!
Your Catalyst Center services are live in ITSI!
In the next section you’ll configure the Inbound Notification Service which will automatically create notable events in ITSI when a Catalyst Center Issue occurs indicating degraded network performance.