Import Catalyst Center Services in ITSI
2 minutes Authors Chris Putnam, Sam Scudere-Weiss, & Tim HardFrom Device Health to Location-Based Network Visibility
Traditional network monitoring tools report on individual devices (a router is up or down, a switch is reachable or not). That level of visibility tells you what failed but not where the impact is felt or how bad it is for the business. When a distribution switch at a branch office starts degrading, your operations team shouldn’t have to manually correlate alerts across tools to figure out that an entire site is affected.
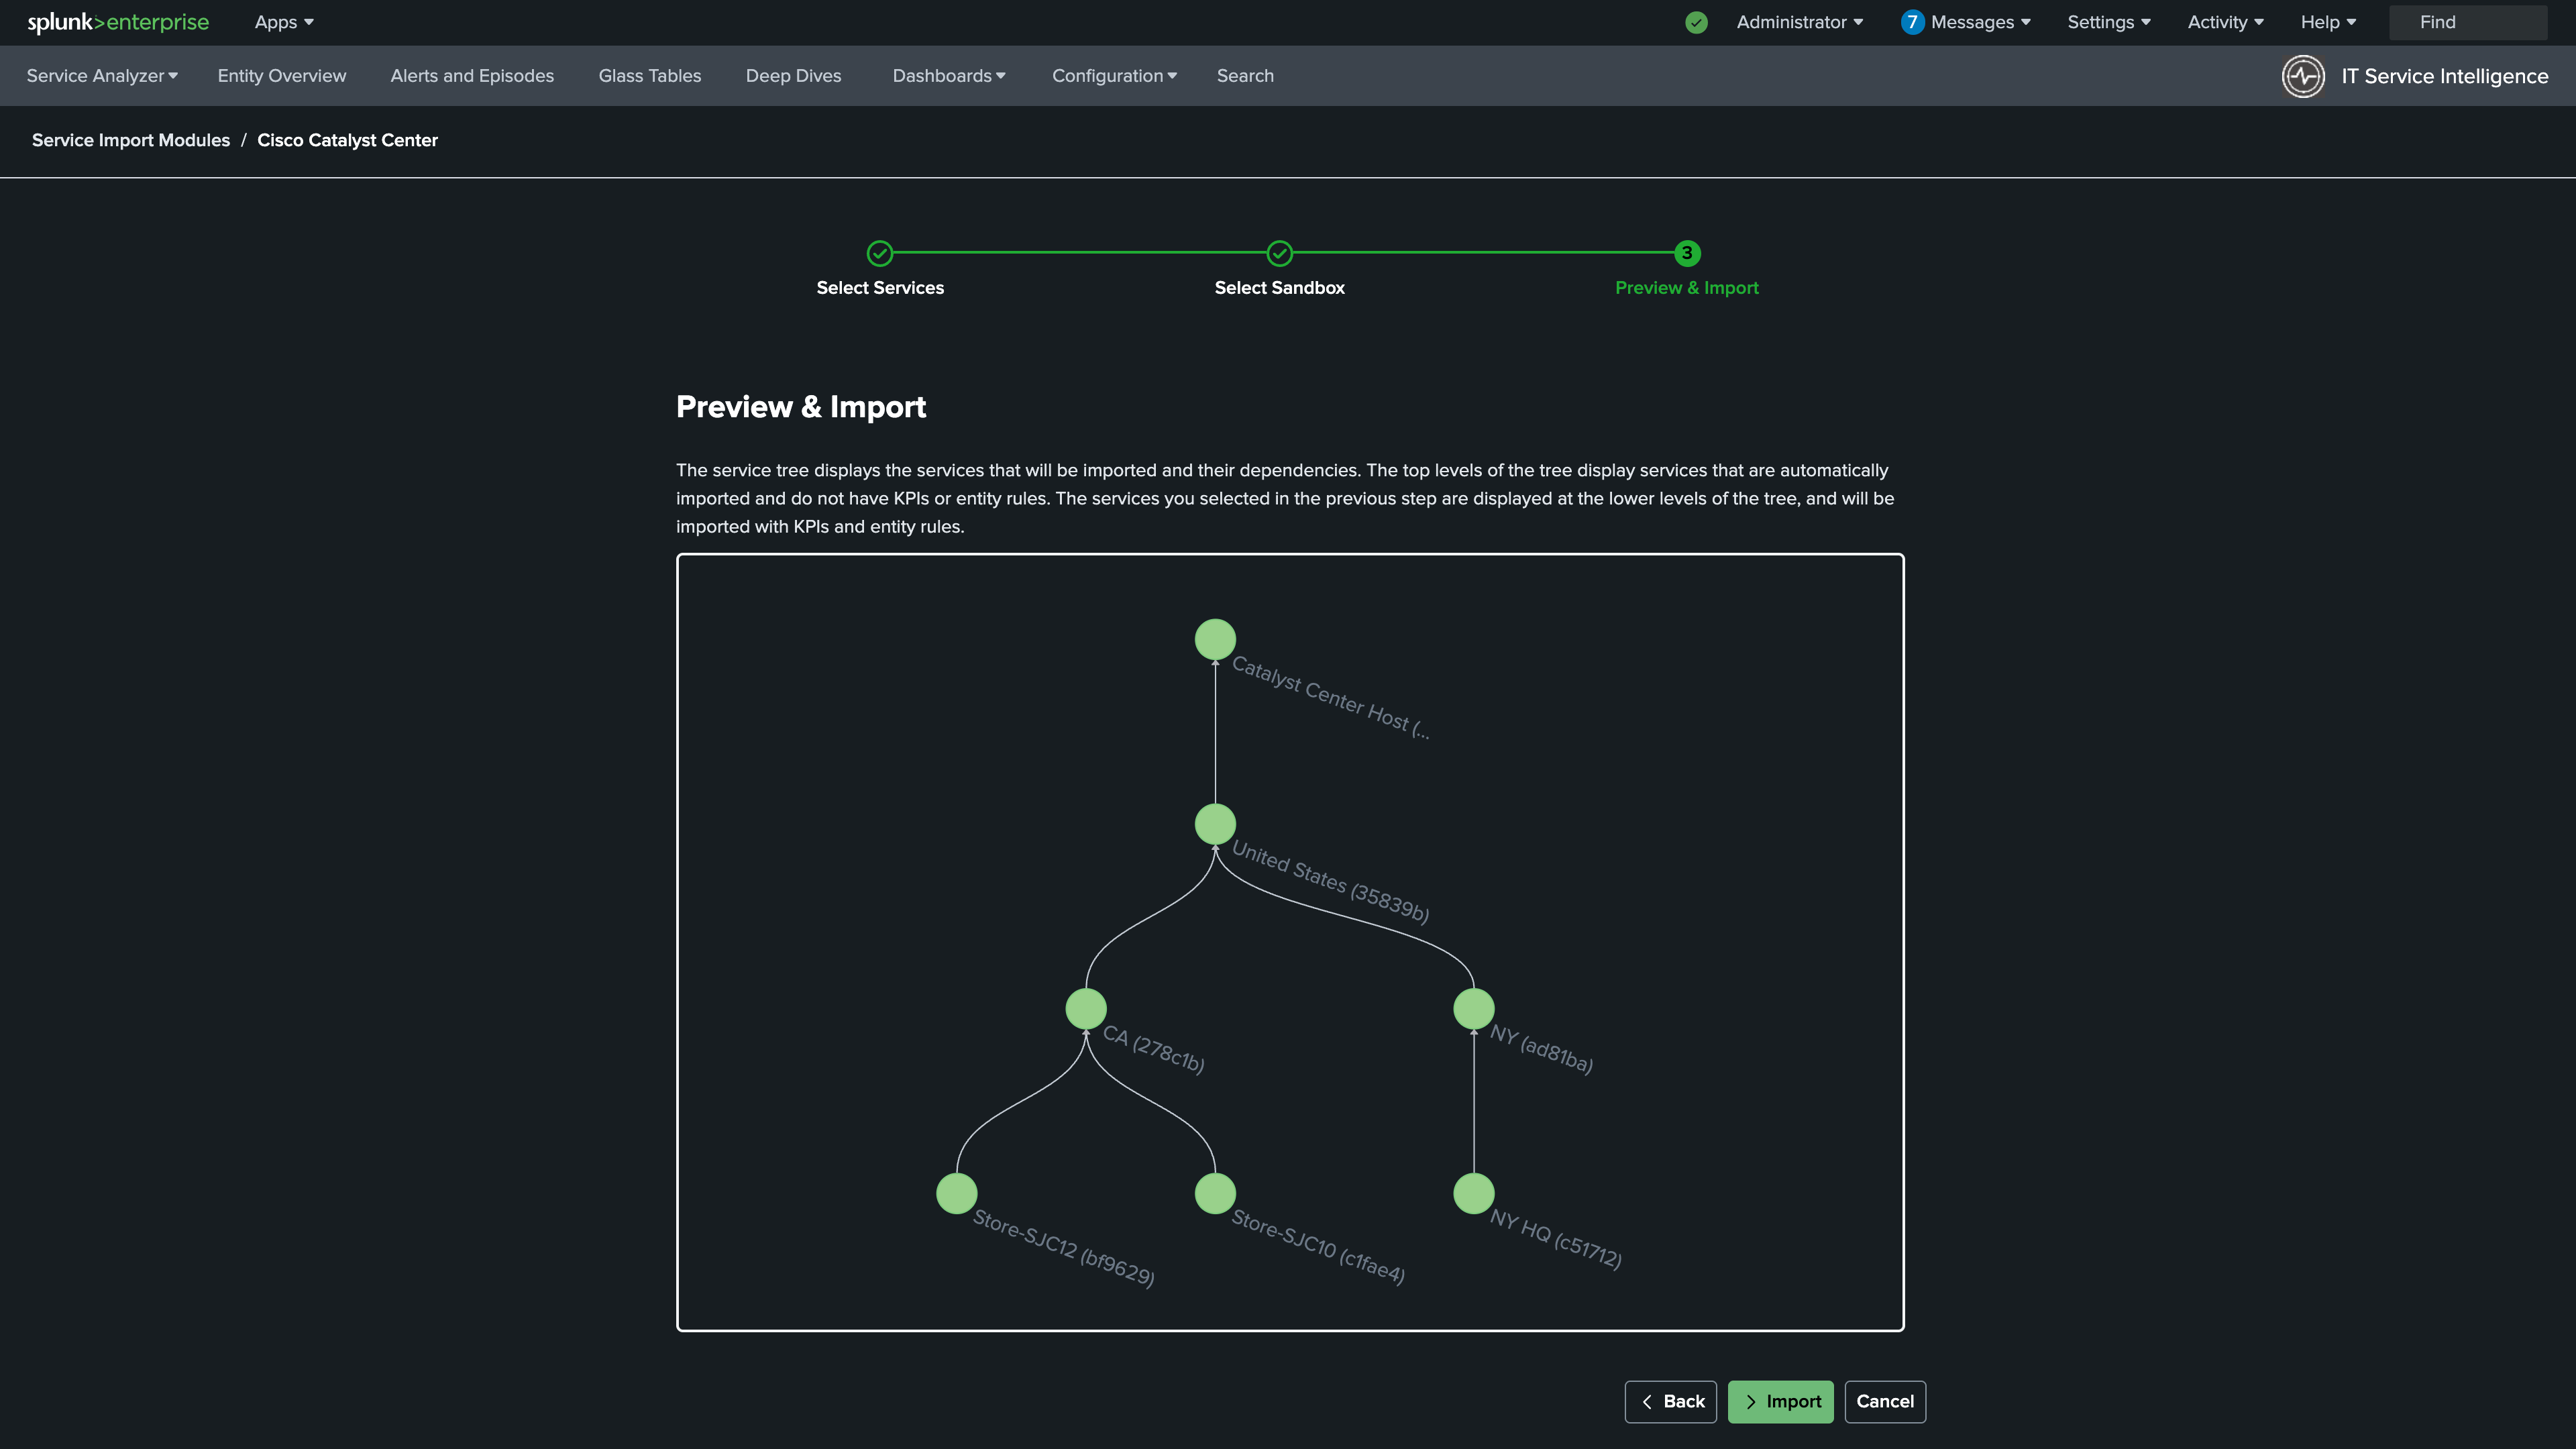
This section addresses that gap. By importing Cisco Catalyst Center topology data into ITSI using the Content Pack for Cisco Enterprise Networks, you create a location-aware service model that aggregates device health up to the site level. Instead of watching 50 individual device alerts, you see a single service health score per site, giving your team an immediate answer to the question: which sites are having problems right now?
Why the Content Pack Matters
The Content Pack for Cisco Enterprise Networks (available through the Splunk App for Content Packs) is the key enabler here. Rather than manually building services and KPIs from scratch, the content pack uses topology data already collected by the Cisco Catalyst Add-on for Splunk to automatically discover and import your Catalyst Center sites as ITSI services. Each site becomes a service, and each service gets a set of pre-built KPIs that reflect the health of every network layer within that site.
The import workflow reads your Cisco Catalyst Center site hierarchy and creates one ITSI service per site. ITSI then runs entity discovery searches to associate the right devices (entities) with each service automatically. No manual mapping required!
The Catalyst Center Site Service Template
At the heart of this integration is the Catalyst Center Site Service Template. When services are imported, this template is applied to each site and provides six out-of-the-box KPIs, each tracking a different layer of the network stack at that location:
| KPI | What It Measures |
|---|---|
| Access Layer | Average HealthScore of Access Layer devices |
| Access Points | Average HealthScore of Access Point devices |
| Core Layer | Average HealthScore of Core Layer devices |
| Distribution Layer | Average HealthScore of Distribution Layer devices |
| Router Health | Average HealthScore of Routers |
| Wireless Controller Health | Average HealthScore of Wireless Controllers |
These KPIs are sourced directly from the Cisco Catalyst Center HealthScore, a 1-10 score that Catalyst Center assigns to each device based on onboarding, connectivity, and radio frequency health. By averaging these scores per network layer, ITSI can pinpoint exactly which part of the stack is dragging down a site’s overall health. The result is that the jump from “Site X is degraded” to “the Access Layer at Site X is the problem” becomes a matter of seconds.
What You’ll Do in This Section
By the end of this section you will have:
- Installed the Content Pack for Cisco Enterprise Networks and imported Catalyst Center sites as ITSI services
- Validated that the Catalyst Center Site KPIs are populating correctly with real network health data