Scenario Review
10 minutes Authors Chris Putnam, Sam Scudere-Weiss, & Tim HardScenario: Network Issue at a Retail Store
Our scenario involves an organization that has campus, branch, and store locations. When a networking issue occurs, the Operations team needs to quickly understand exactly which sites are impacted and which components of the network are unhealthy. This scenario walkthrough shows how ITSI uses device health data from Cisco Catalyst Center and correlates it with alerts from other tools (in this case, Solarwinds) to provide a complete picture of the issue in minutes.
In real environments, organizations typically have many different tools monitoring the same systems. When an issue occurs they all start triggering alerts and alarms. This creates alert storms, making it very difficult to understand where to start troubleshooting. The result is significant delays in issue resolution and alert fatigue across the operations team.
ITSI addresses this challenge by understanding network health by site and network layer, and by providing highly actionable episodes that correlate alerts across any number of different monitoring solutions. Instead of pivoting between consoles, your team gets a single view of what is happening, where it is happening, and which alerts from which tools are related.
Scenario Flow: Root Cause Analysis with Catalyst Center
Scenario Review
1. Open the Service Analyzer in ITSI. Notice that the Access Points KPI is showing a degraded health status
Info
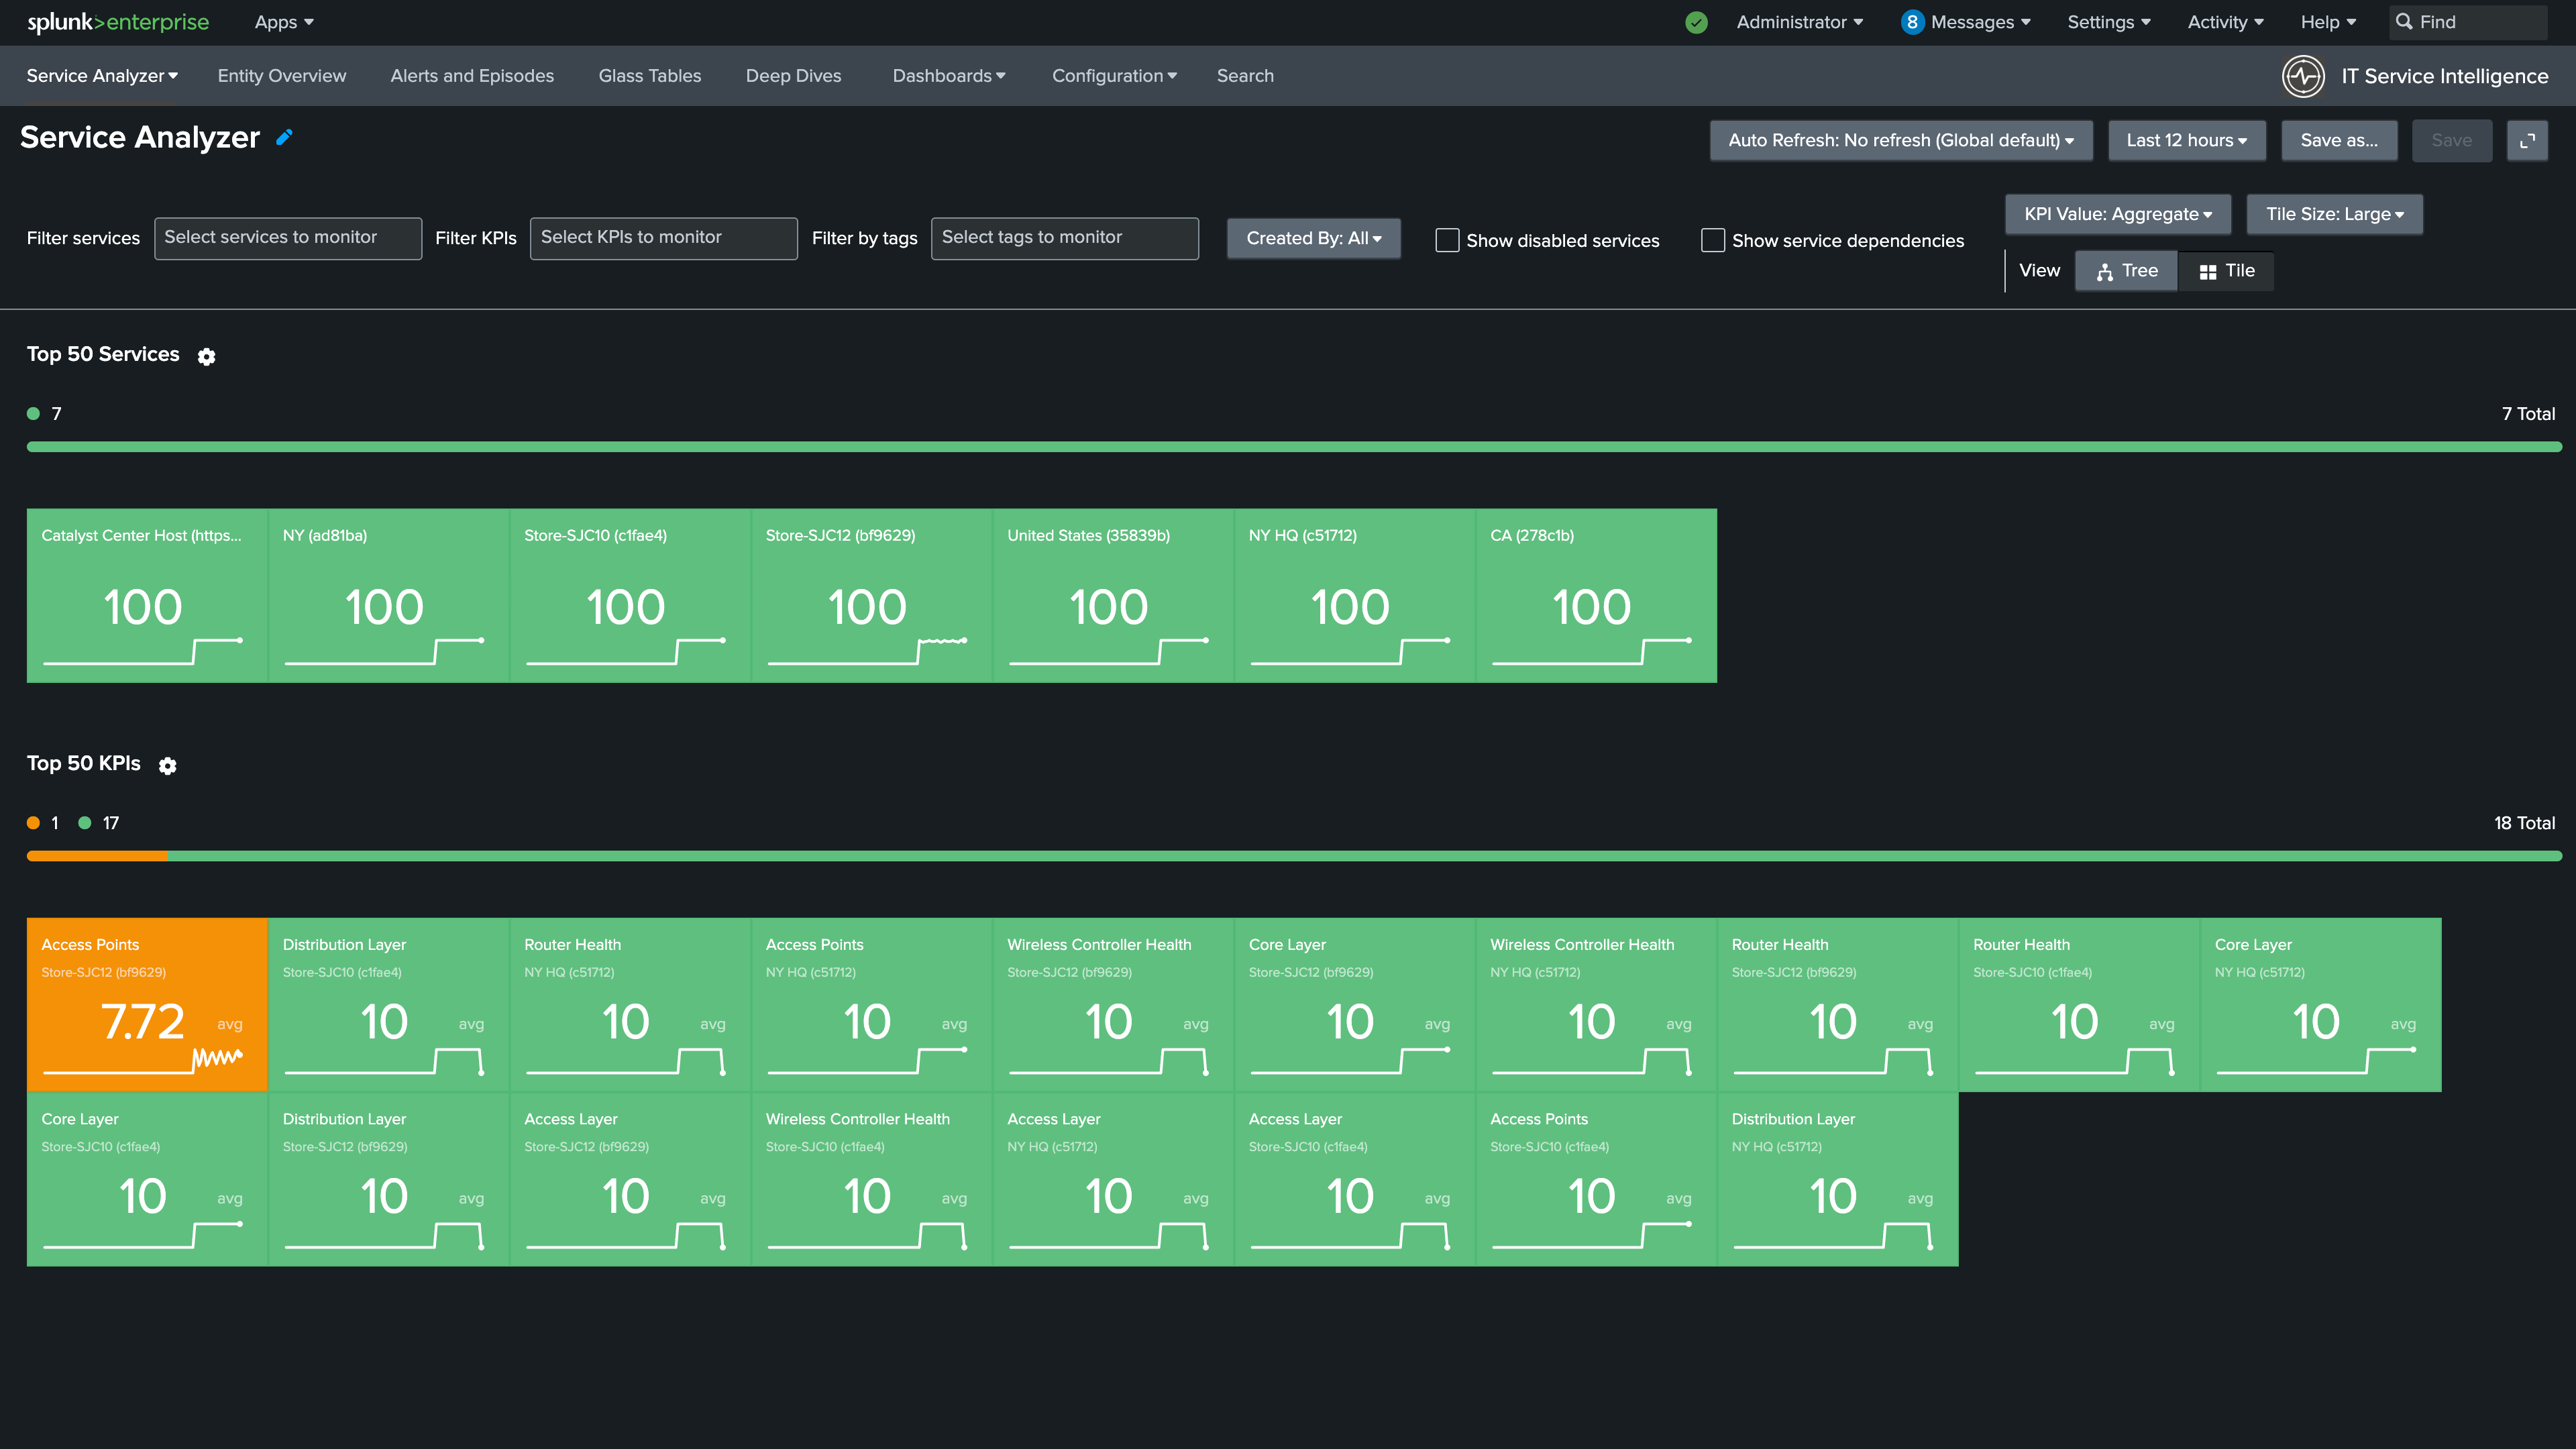
2. Select Tree on the right to view the Service Tree
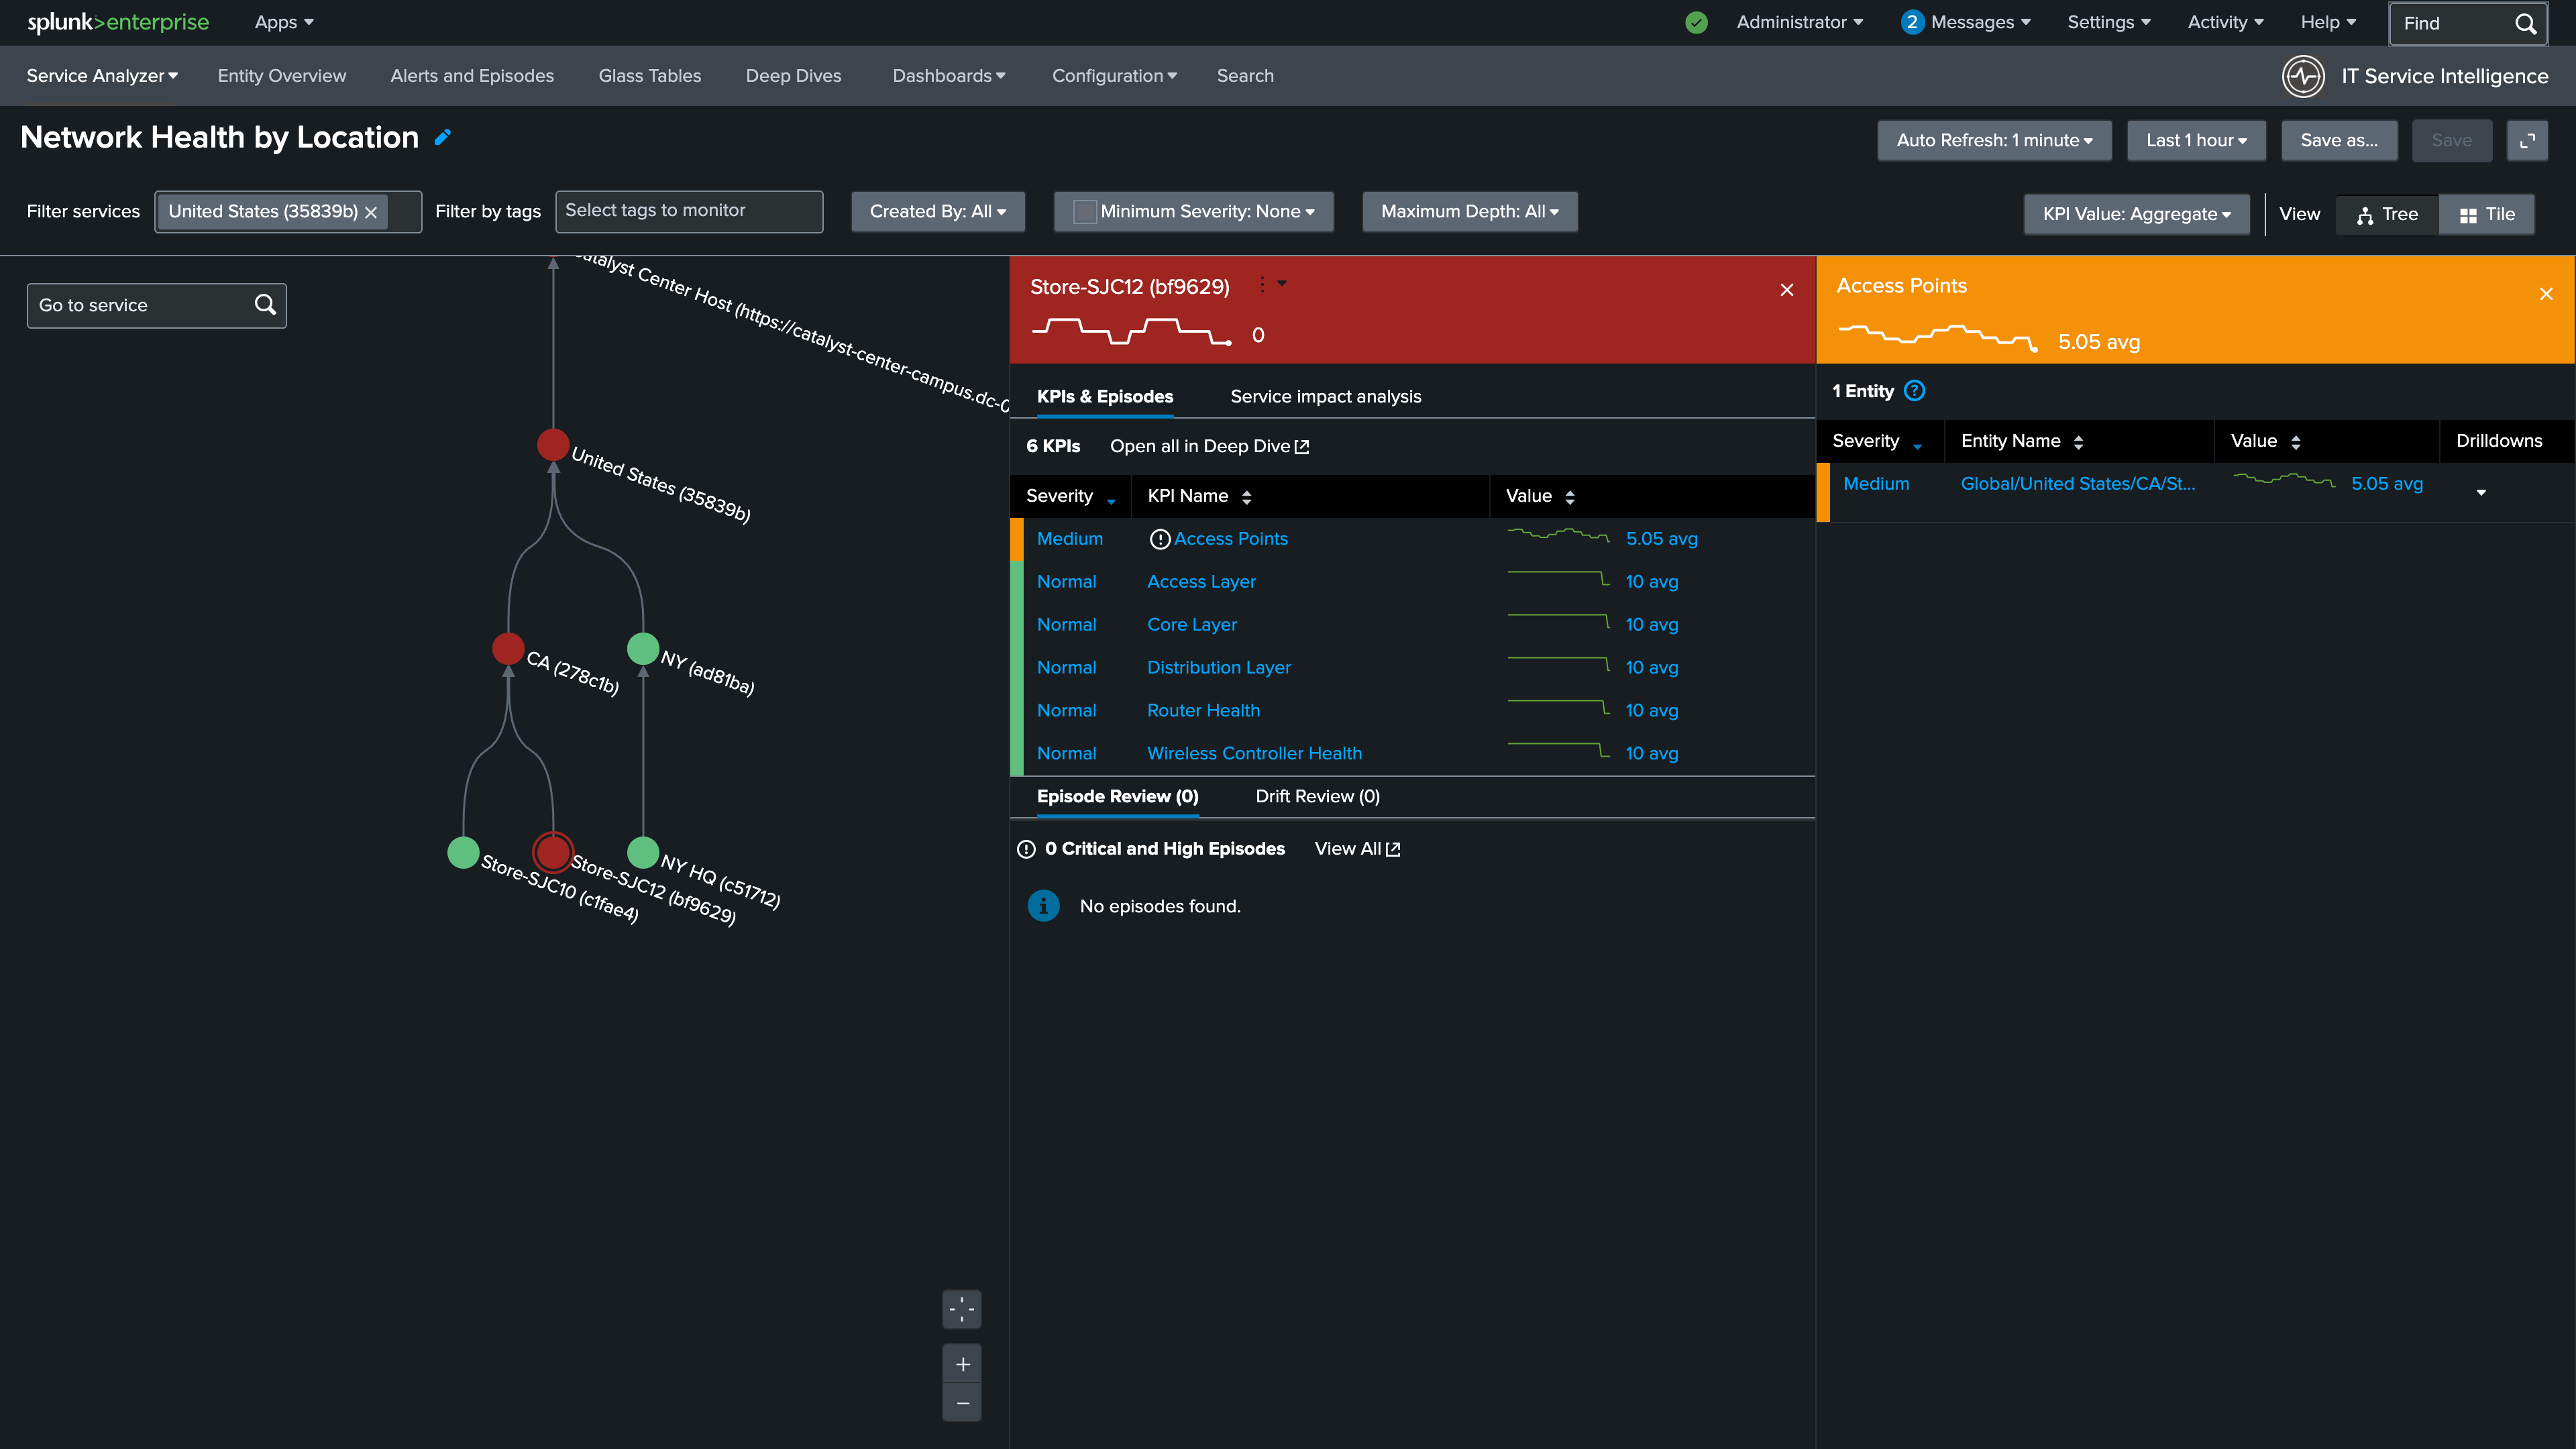
3. Select the Store-SJC12 service to expand its KPIs. Notice that the Access Points KPI is unhealthy, which indicates there is a wireless issue at this location
4. Select the Access Points KPI to drill into the entity details. You should see that this issue is impacting Floor-1 at this location
Info
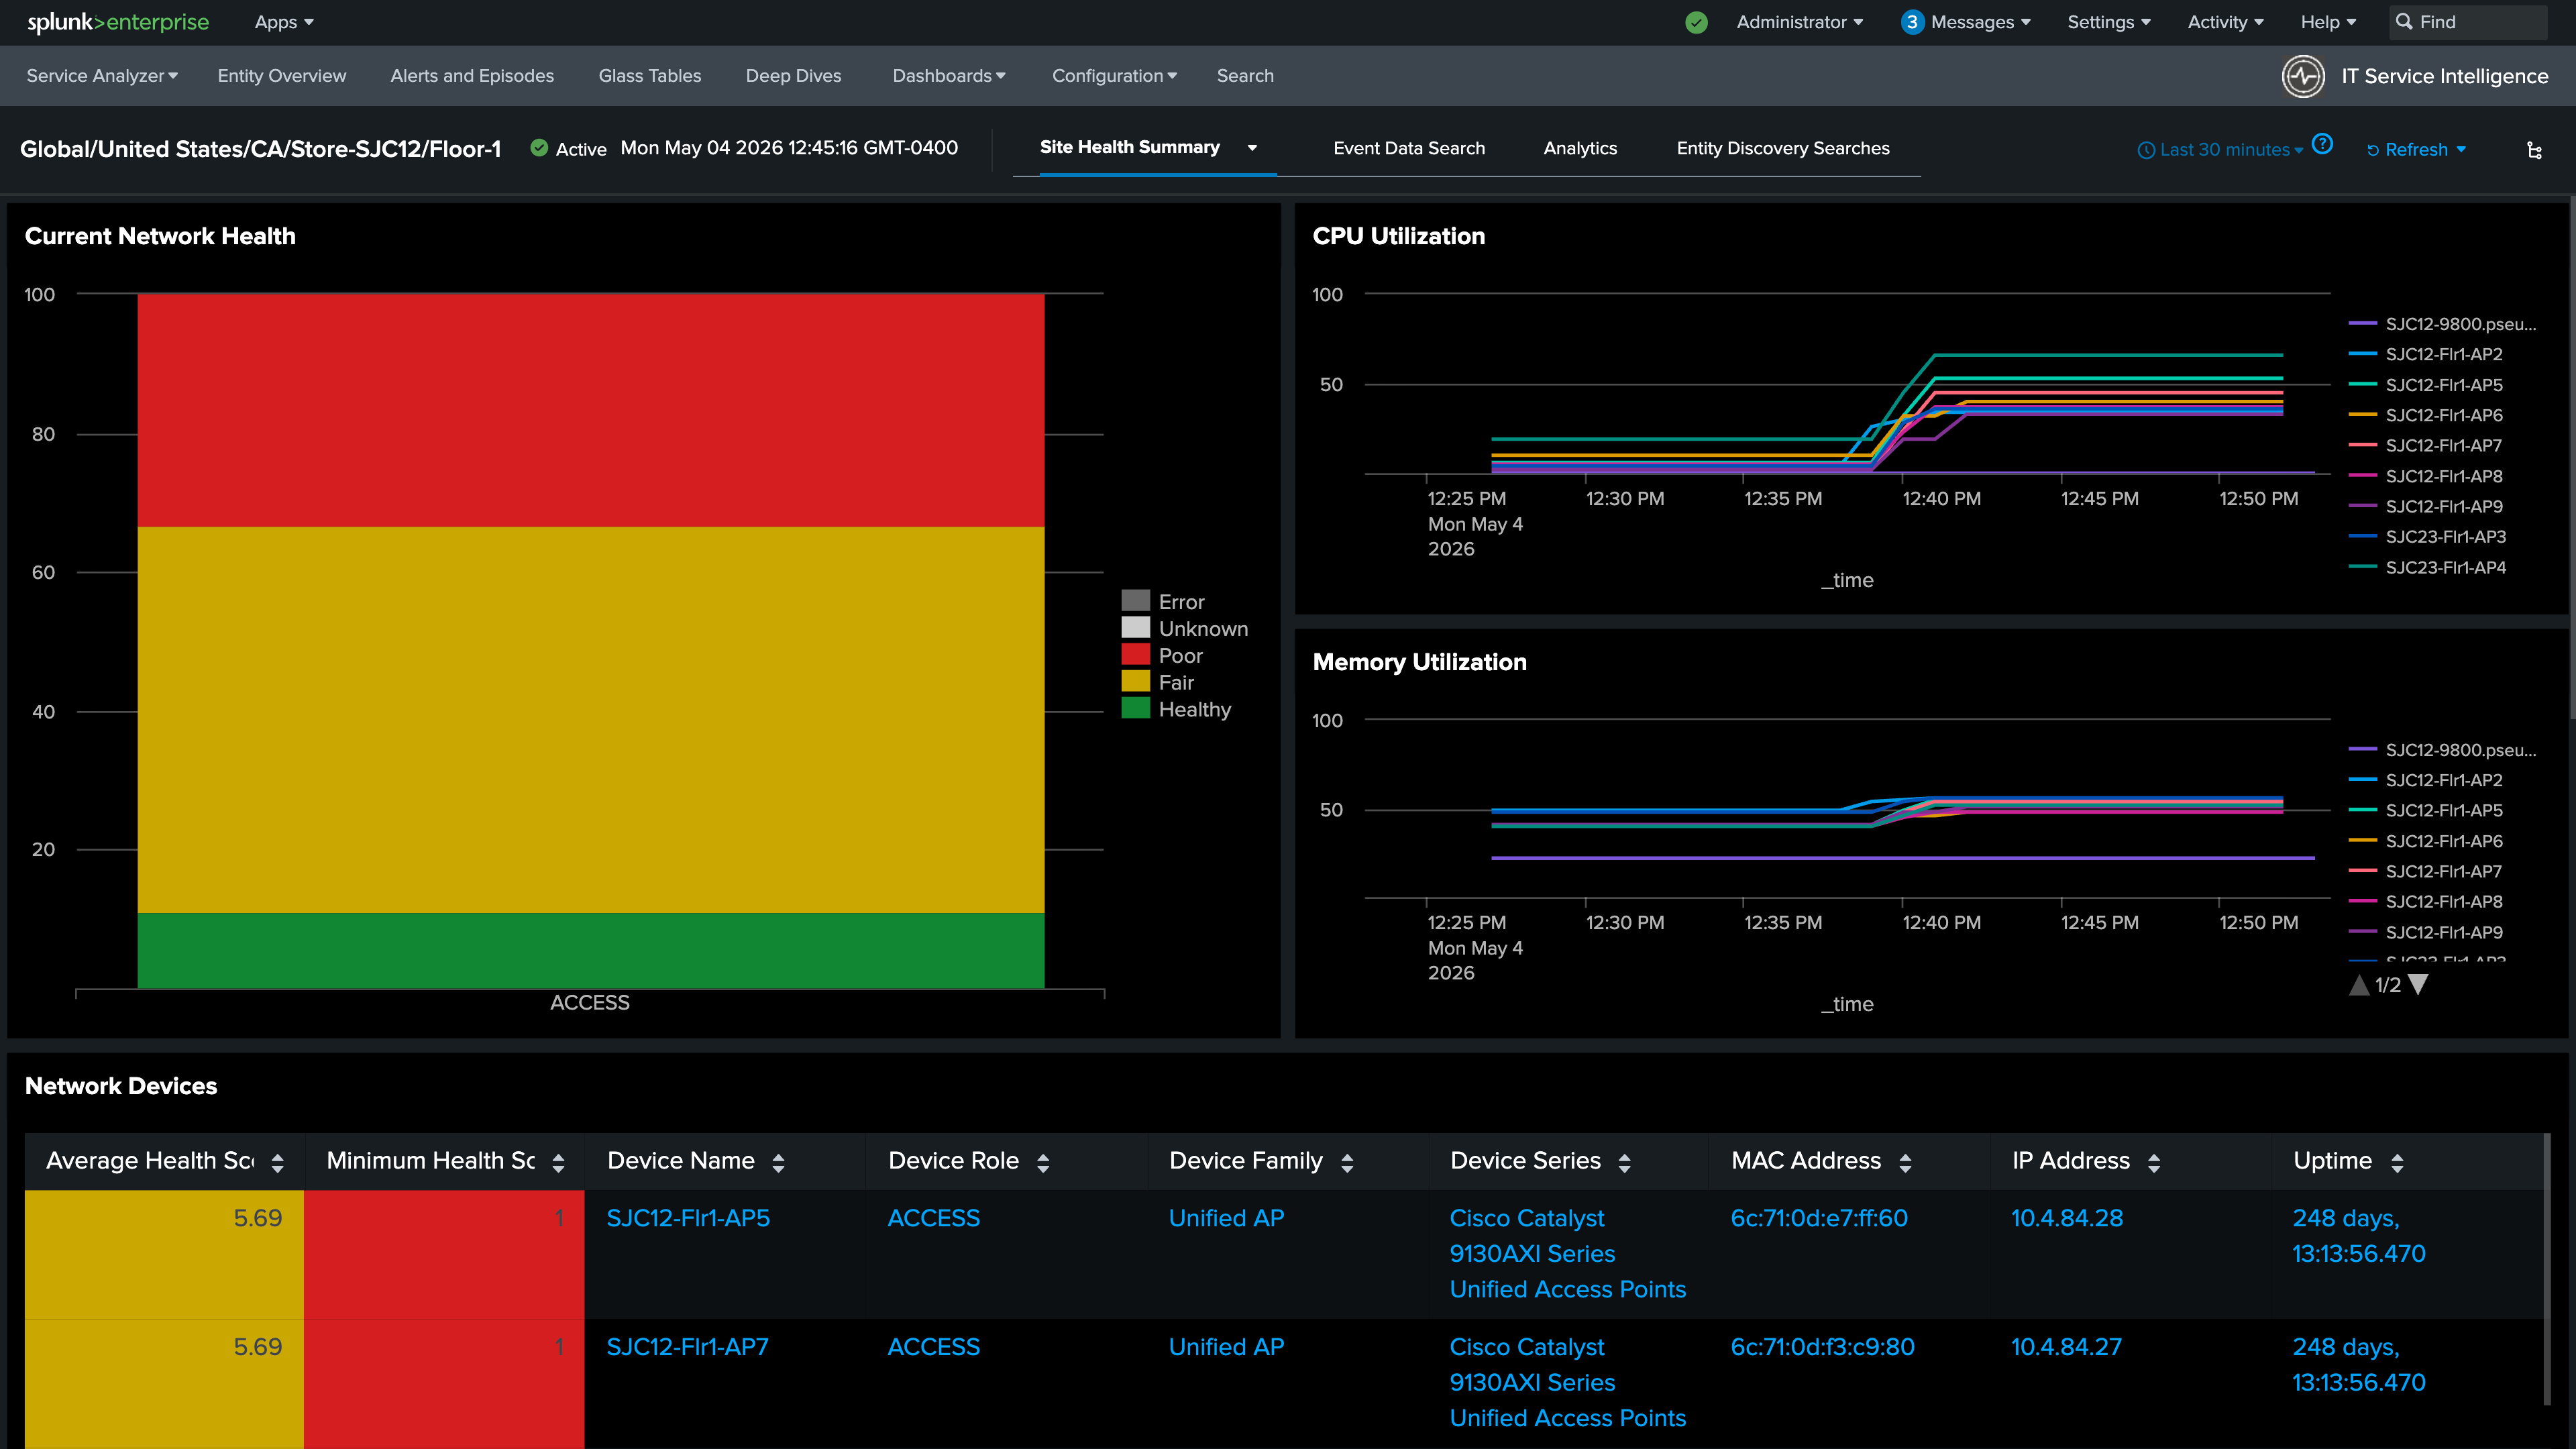
Bonus
Drill down into the entity using the Site Health Summary link to see the health of the wireless access points at this store in more detail. This dashboard provides a granular view of individual device health scores sourced directly from Catalyst Center.
5. Check the Episode Review section located below the KPI health details. If there are any High or Critical episodes currently open for this site, they will appear here.
Info
This scenario starts at a Medium severity and escalates to High as additional alerts are generated. Depending on where you are in the 30-minute break cycle, there may not be any episodes in this list yet. If you don’t see any, continue to the next step and check the full Alerts and Episodes view.
If no episodes are currently High or Critical, navigate to Alerts and Episodes to review the full list of episodes. Depending on how long the scenario has been running, you may see previously resolved episodes for this site. This demonstrates how ITSI can automatically close open episodes and set their status to Resolved when the underlying issue clears
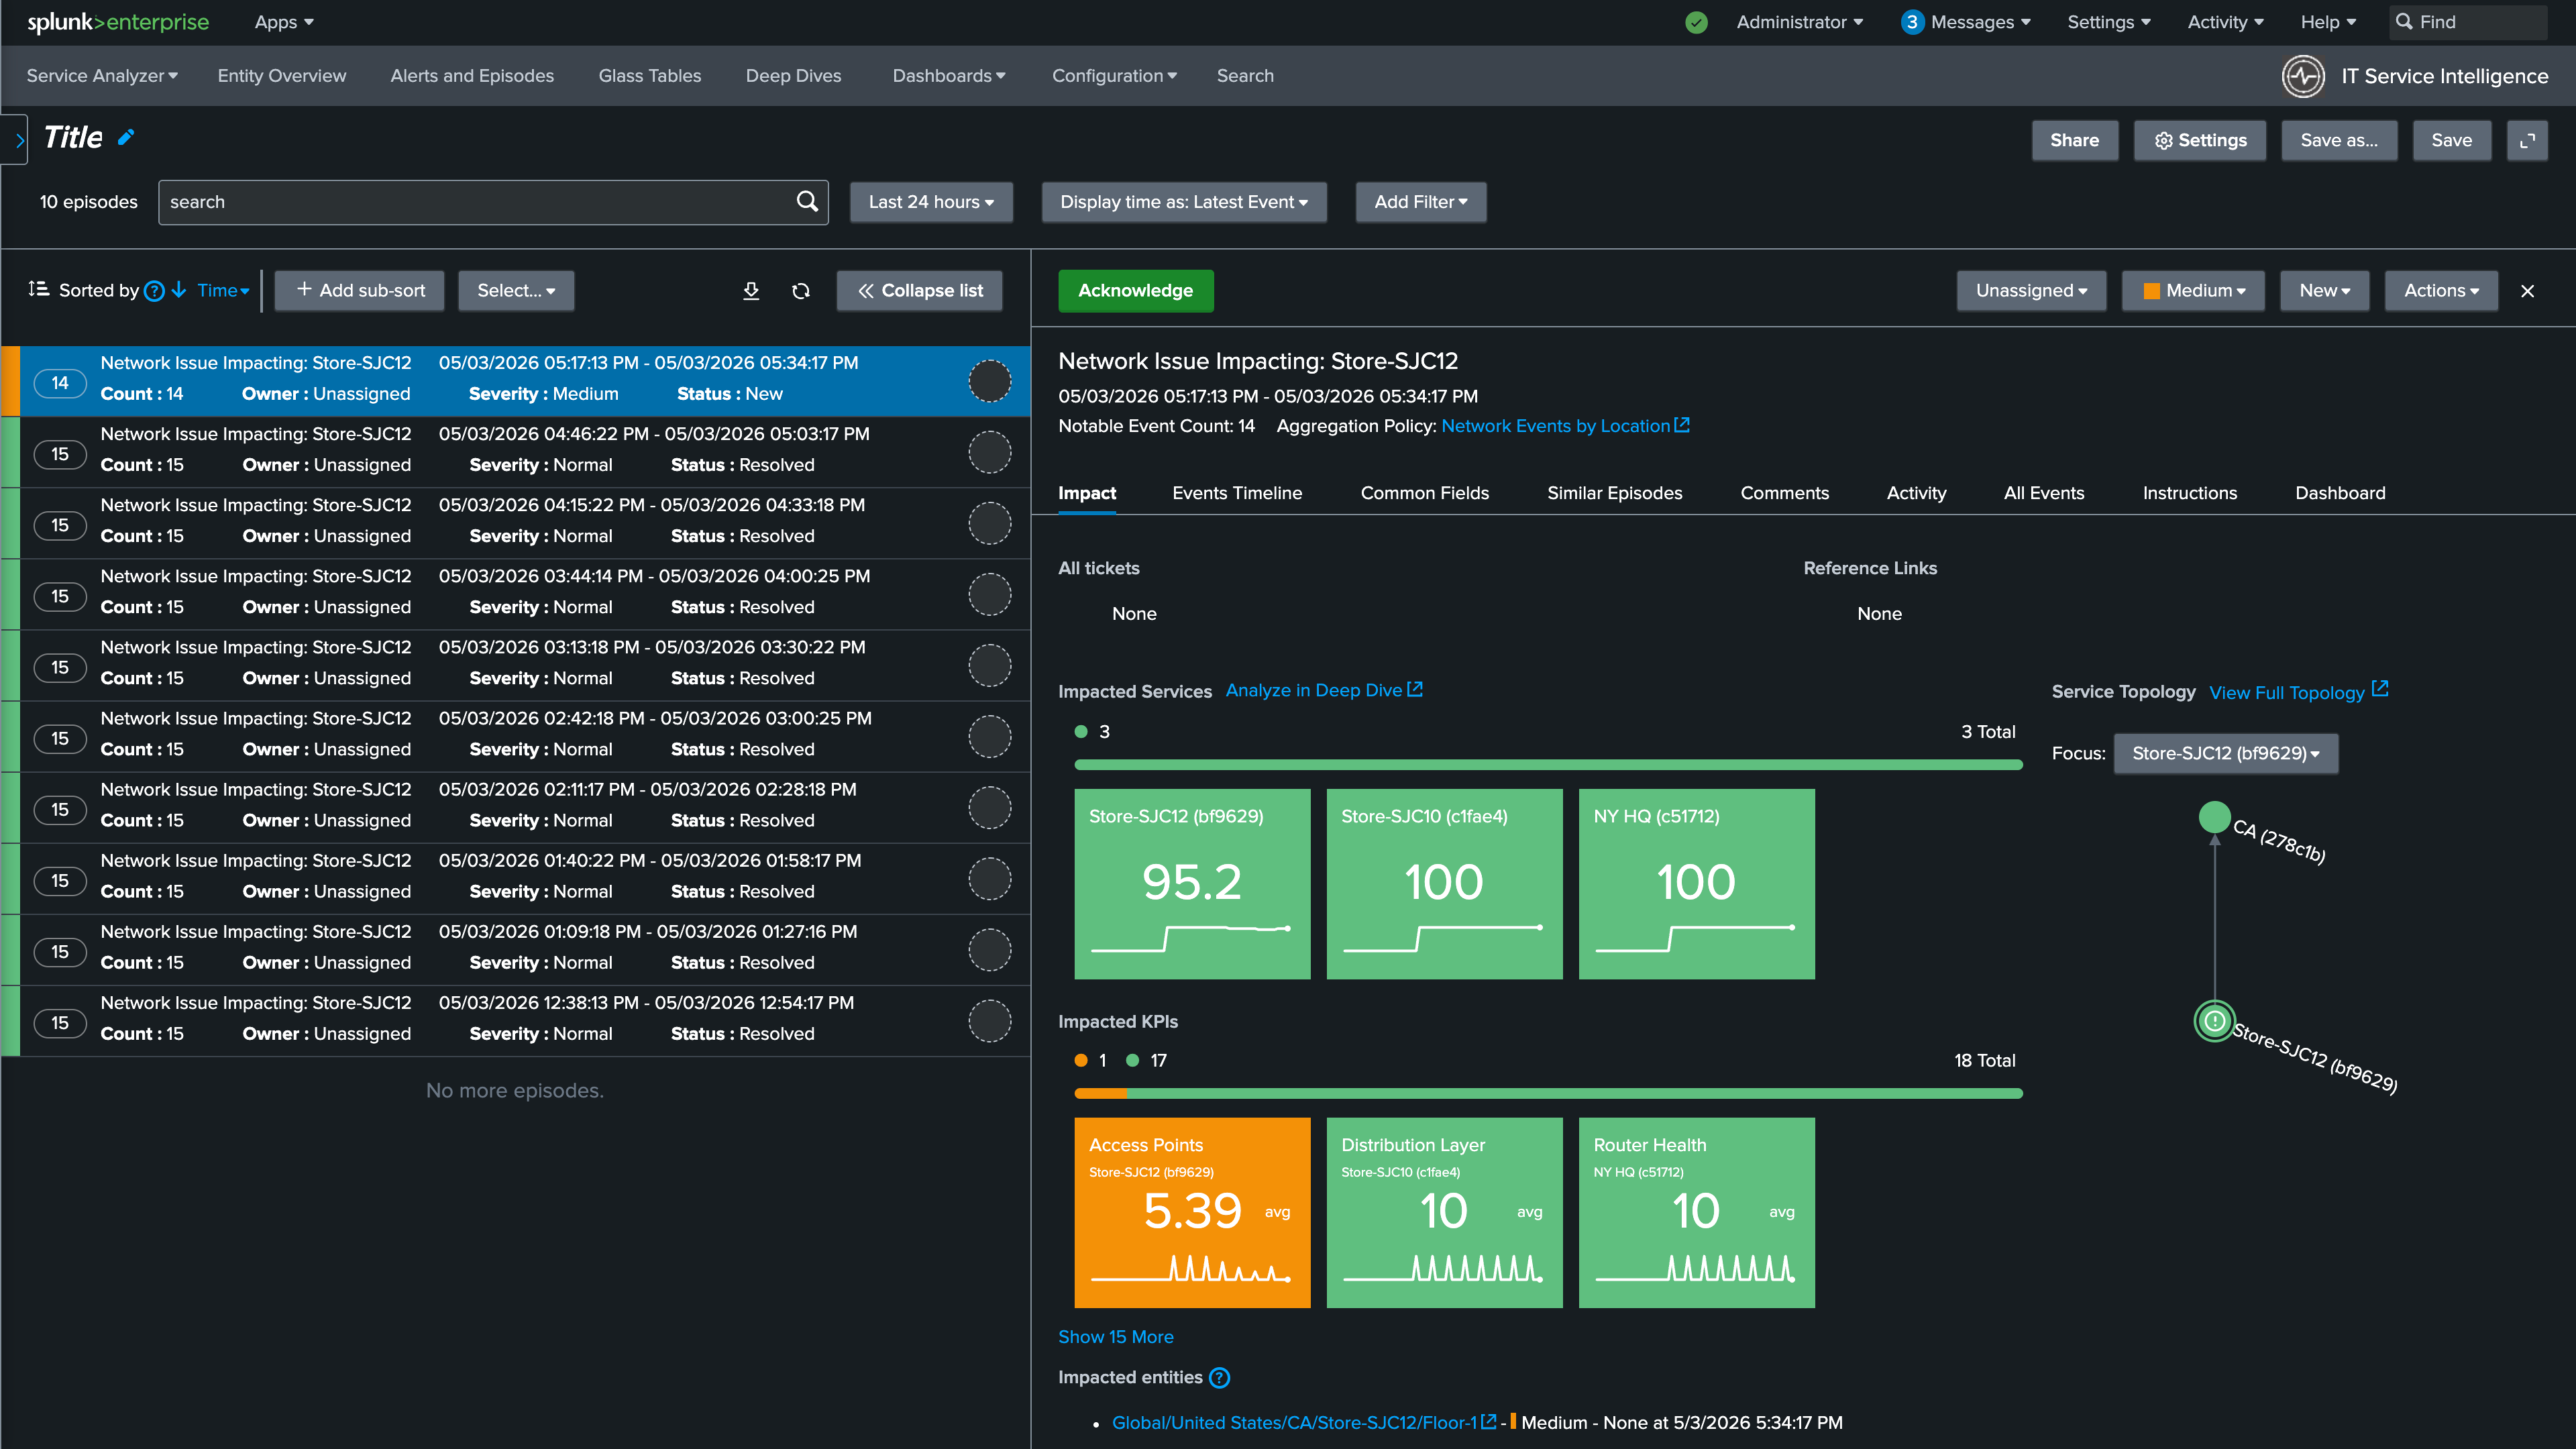
6. If there is an ongoing episode, select it. If not, select one of the recently resolved episodes to review
7. Review the impacted services and KPIs in the episode detail. This view shows exactly which services and KPIs were affected during this episode.
Info
8. Select the Events Timeline tab to review the order in which the events occurred
9. From the Sort dropdown, select Root cause analysis to reorder the events chronologically
Info
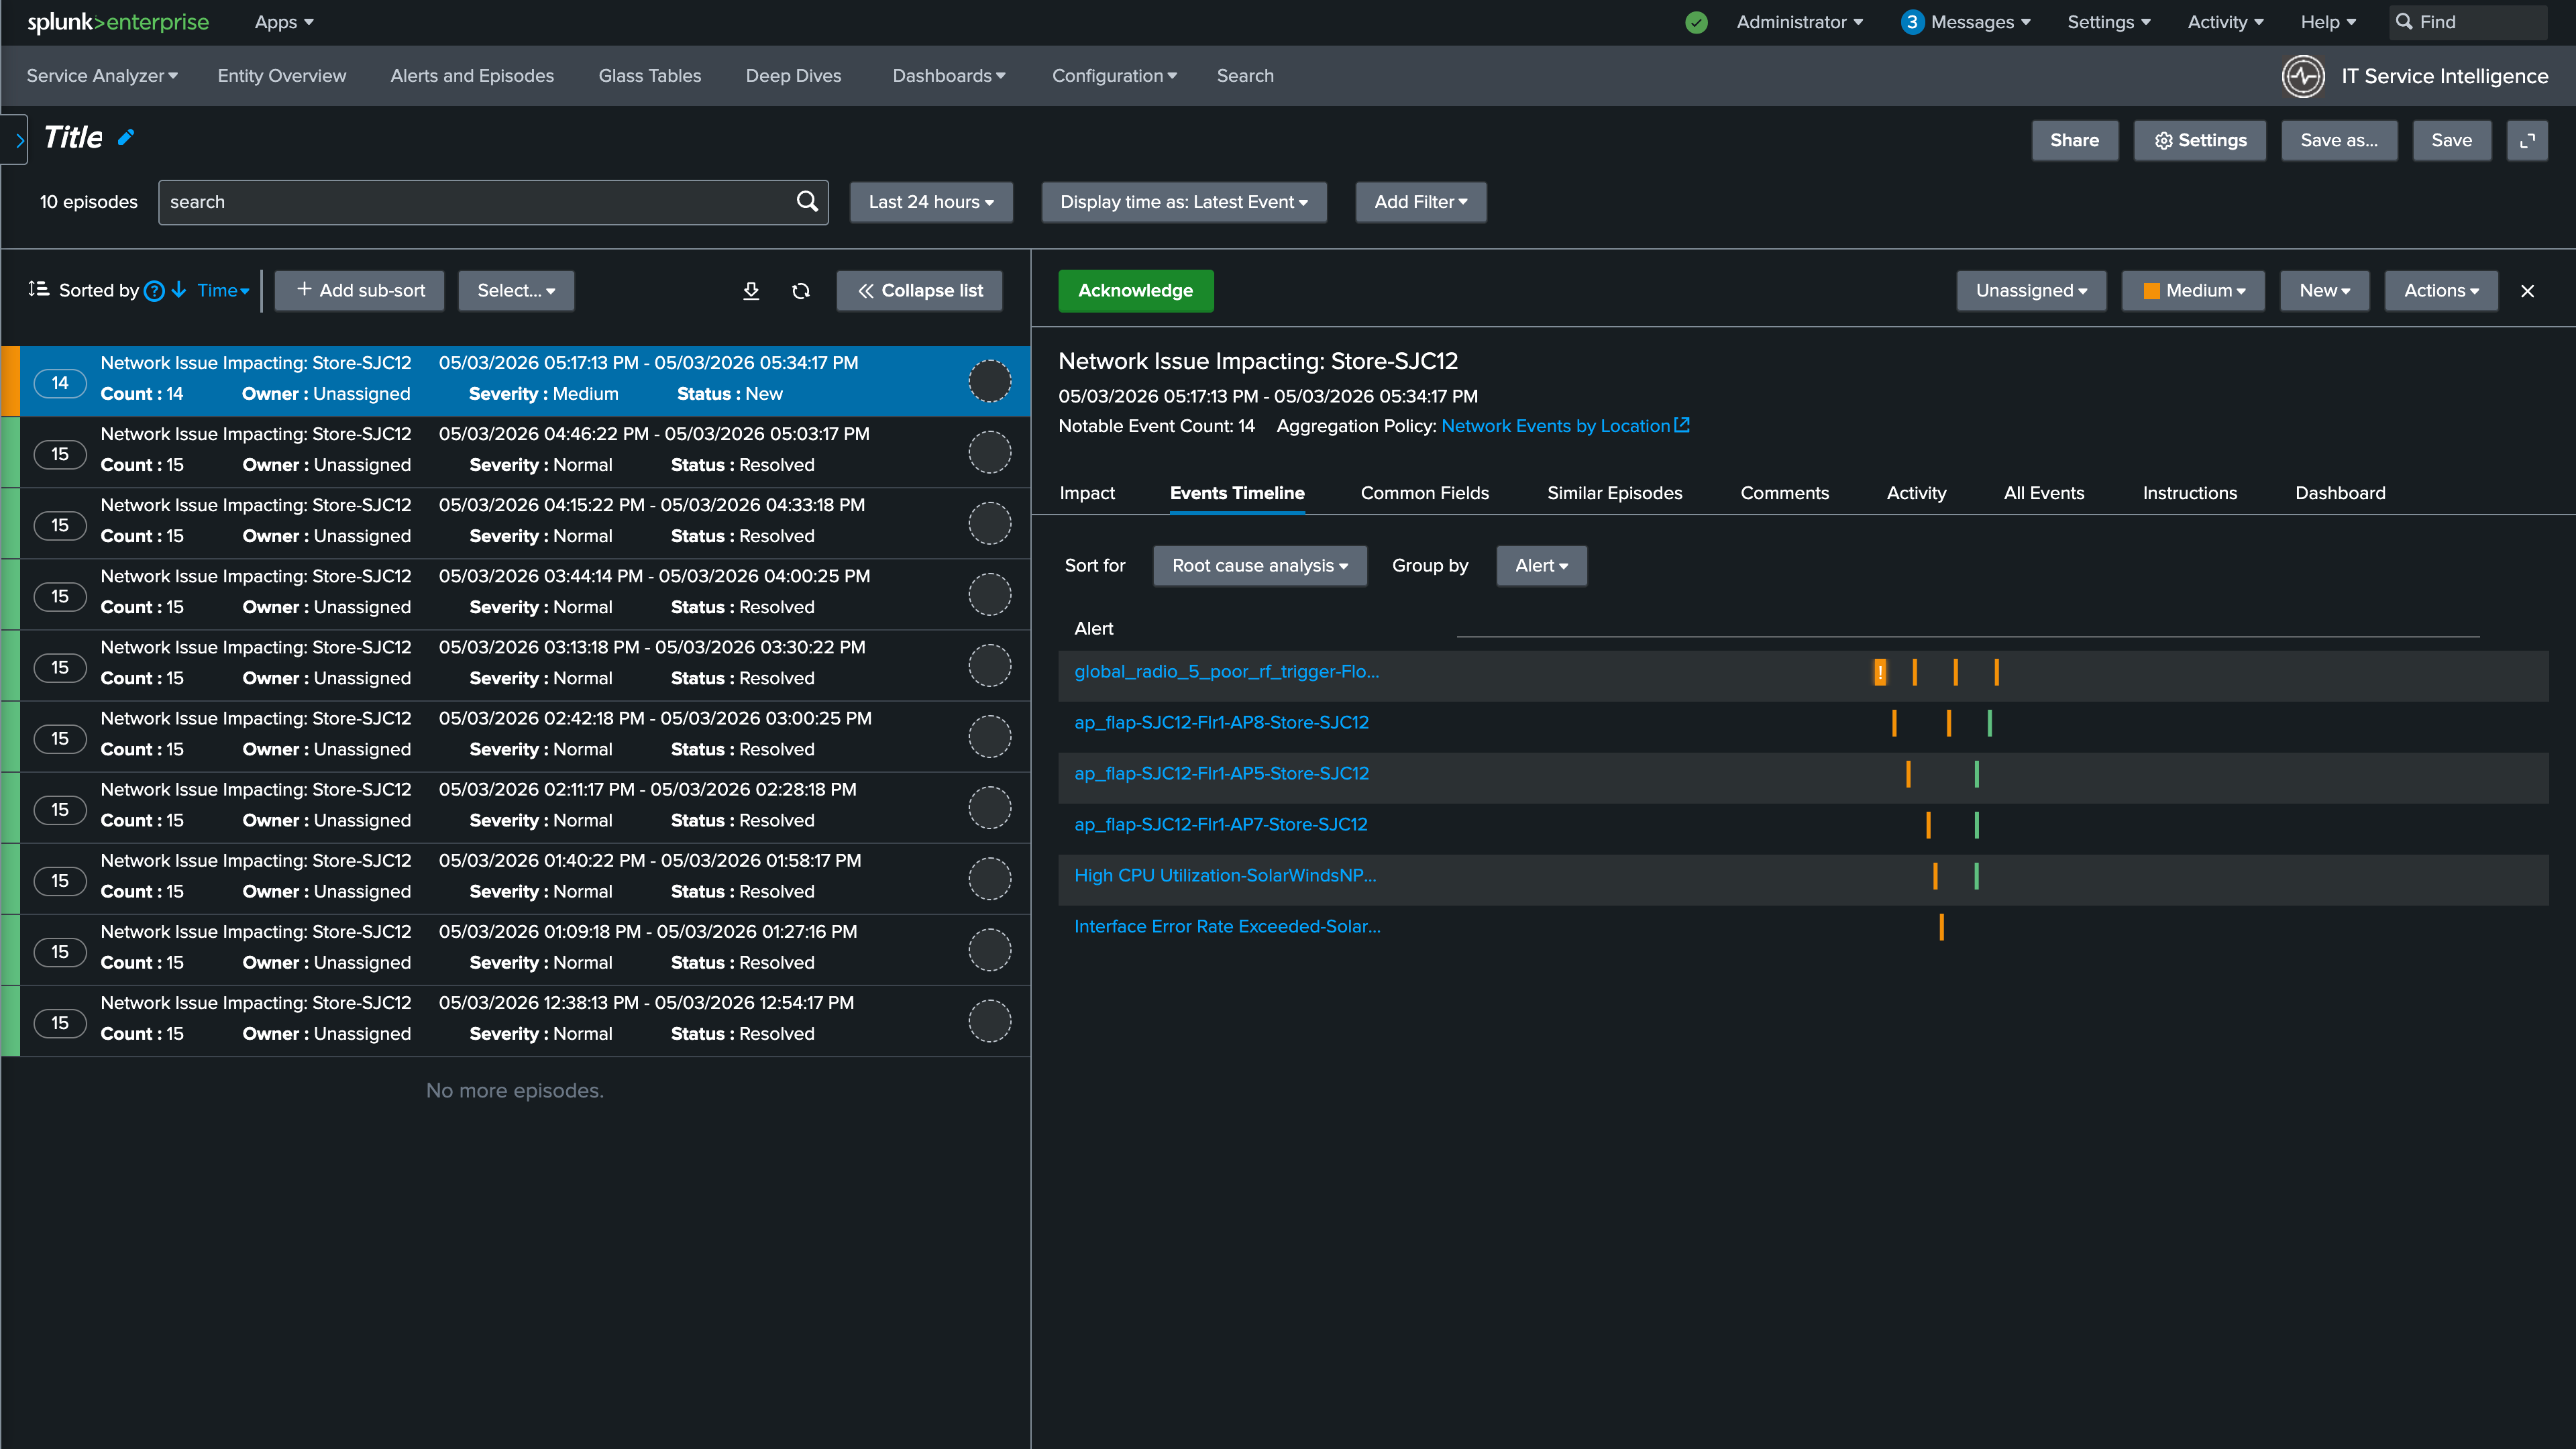
10. Review the individual alerts by selecting them from the list. Notice that this episode includes alerts from both Solarwinds and Catalyst Center. This is because the episode is using the Network Events by Location NEAP you created in the previous section, which groups all alerts for a given site regardless of their source
Info
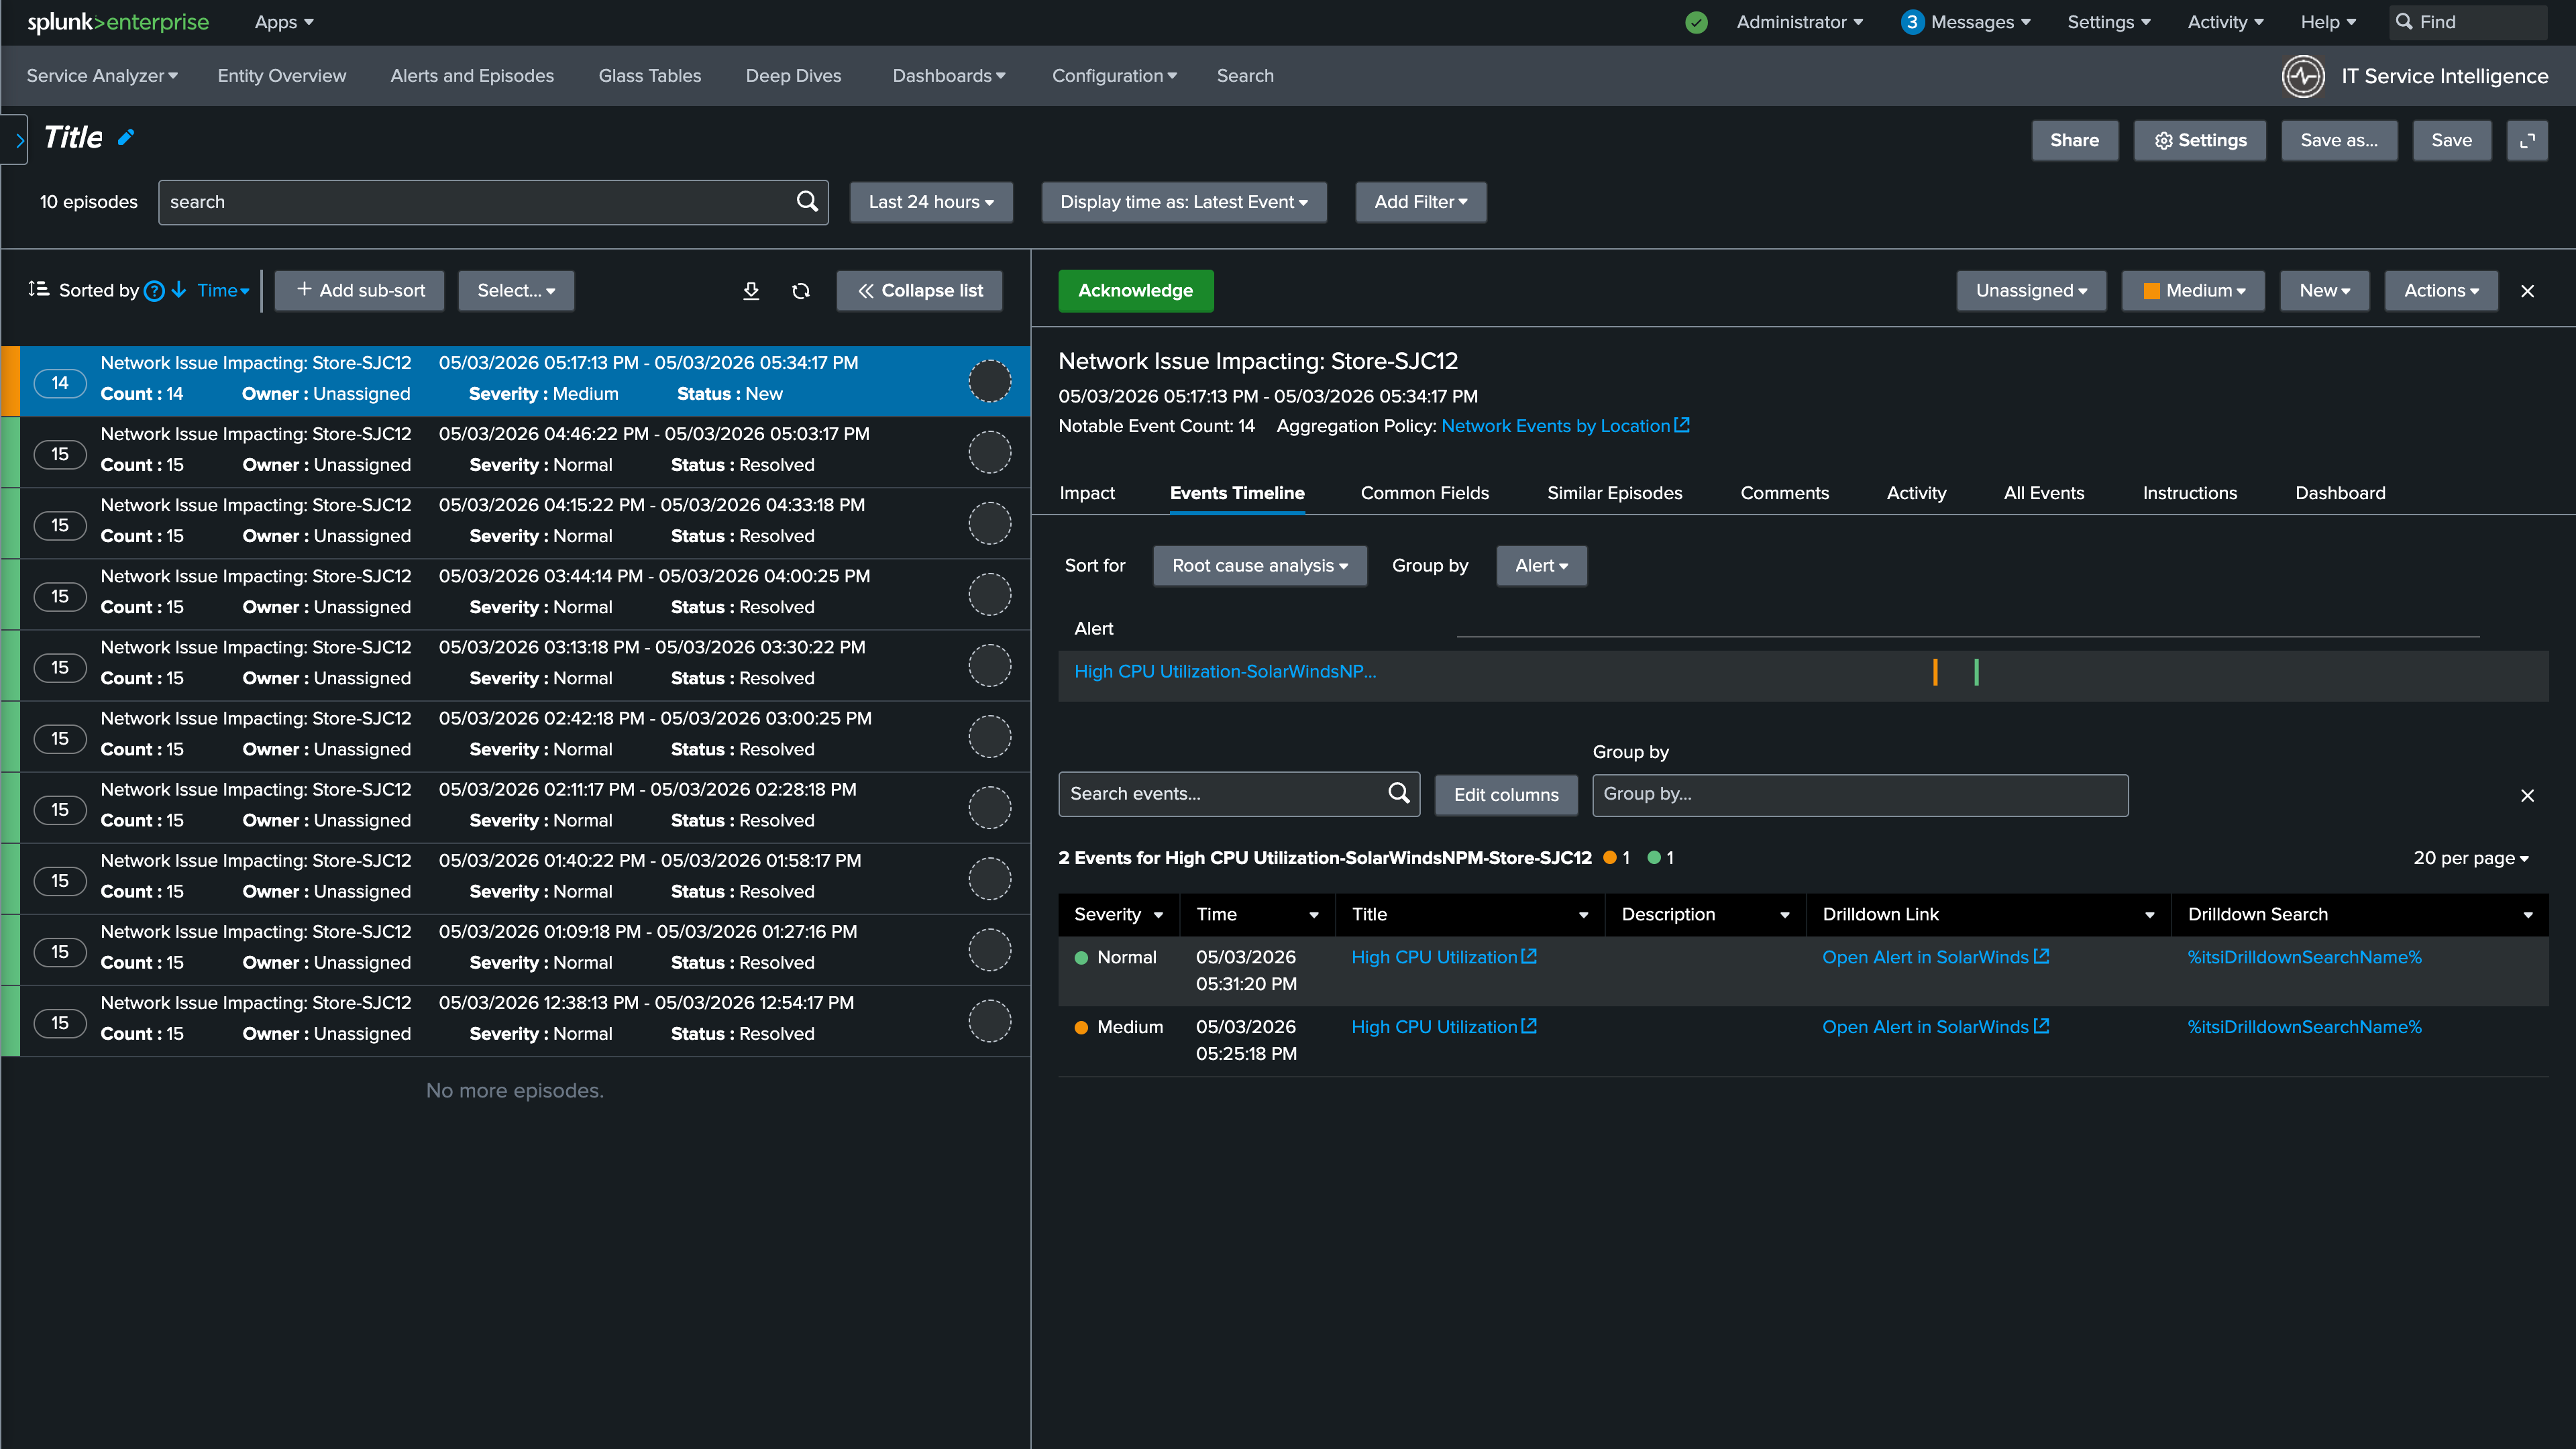
You are now able to see alerts in context, understand when they occurred, and track severity changes as the situation evolves. When a clearing event is received from either Catalyst Center or Solarwinds, the alert severity will automatically change to Normal. The action rule you configured in the NEAP will then automatically resolve the episode once all contributing alerts have returned to normal, closing the loop without any manual intervention.
Workshop Complete!
Why This Matters
Throughout this workshop you configured ITSI to provide location-based network visibility using Catalyst Center topology data, ingested and normalized alerts from two independent monitoring tools, and built a custom aggregation policy that correlates those alerts into a single actionable episode per site.
The result is a system that eliminates tool-swivel, reduces alert noise, and gives operations teams an immediate answer to three critical questions: Where is the problem? What is affected? Is it getting better or worse?
By automating episode creation and resolution, ITSI reduces mean time to resolution and ensures that your team spends their time investigating real issues instead of chasing duplicate alerts across disconnected consoles.
Happy Splunking!