

RUM
Analyzing RUM Metrics
- See RUM Metrics and Session information in the RUM UI
- See correlated APM traces in the RUM & APM UI
1. RUM Overview Pages #
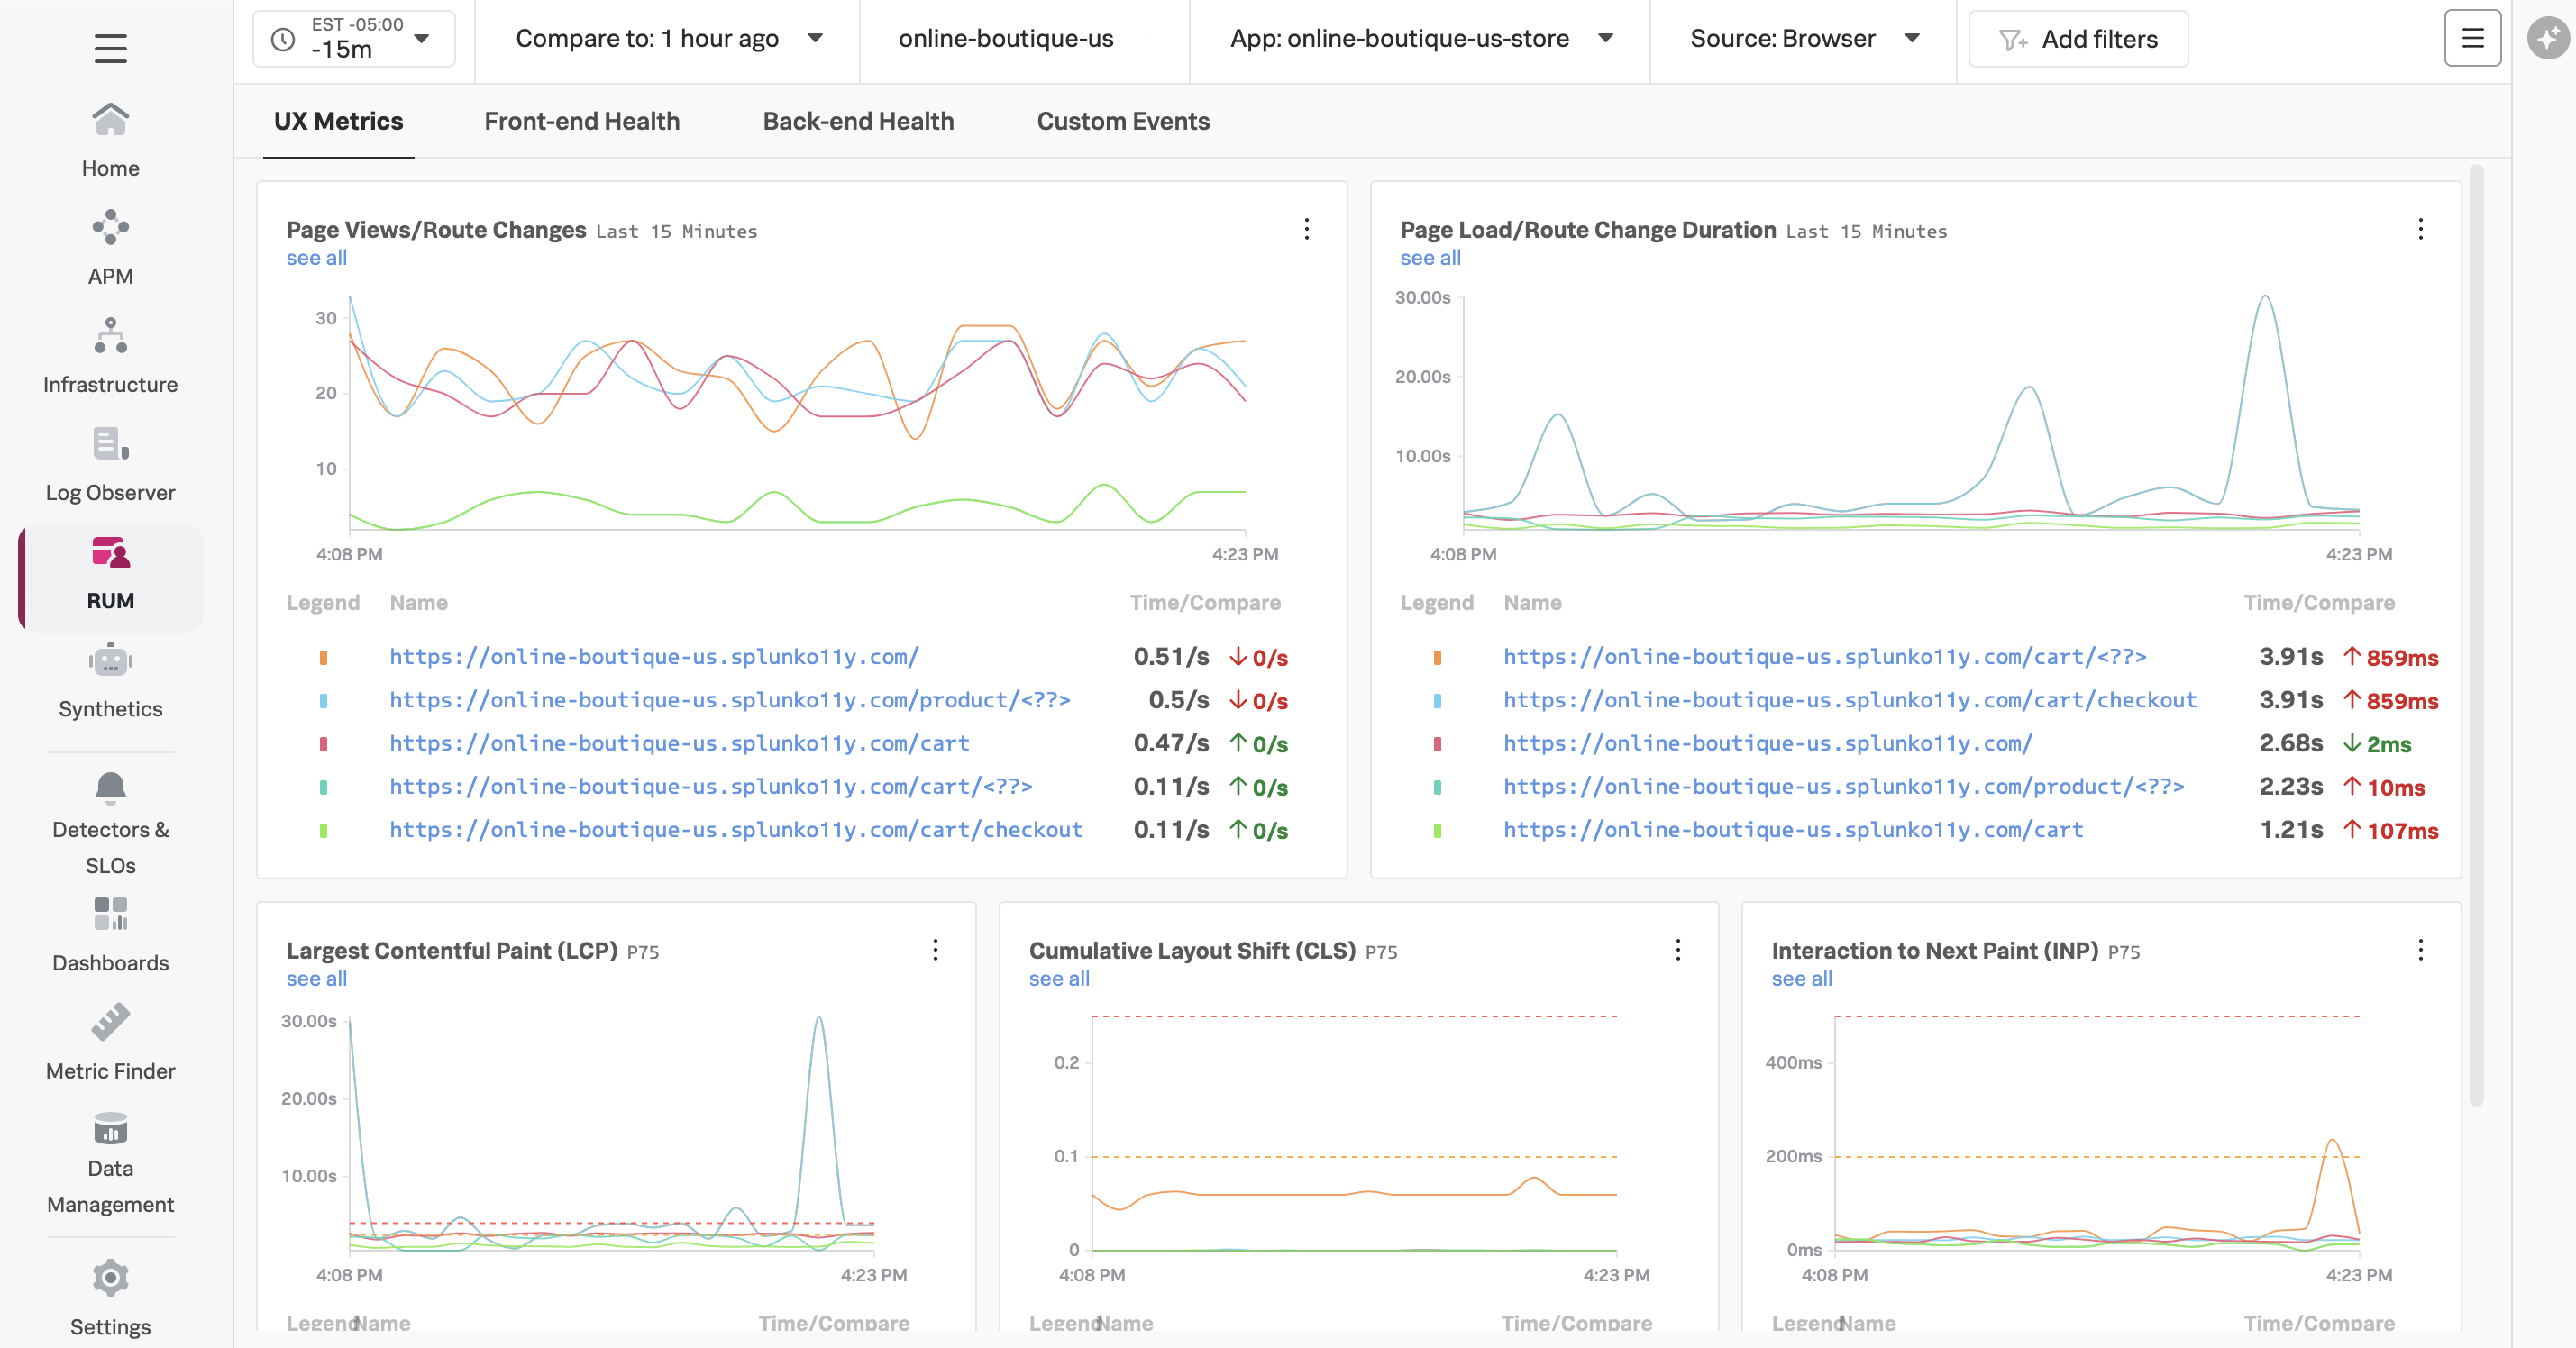
From your RUM Application Summary Dashboard you can see detailed information by opening the Application Overview Page via the tripple dot

This will take you to the RUM Application Overview Page screen as shown below.
2. RUM Browser Overview #
2.1. Header #
The RUM UI consists of five major sections. The first is the selection header, where you can set/filter a number of options:
- A drop down for the time window you’re reviewing (You are looking at the past 15 minutes in this case)
- A drop down to select the Comparison window (You are comparing current performance on a rolling window - in this case compared to 1 hour ago)
- A drop down with the available Environments to view
- A drop down list with the Various Web apps
- Optionally a drop down to select Browser or Mobile metrics (Might not be available in your workshop)

2.2. UX Metrics #
By default, RUM prioritizes the metrics that most directly reflect the experience of the end user.
Additional Tags
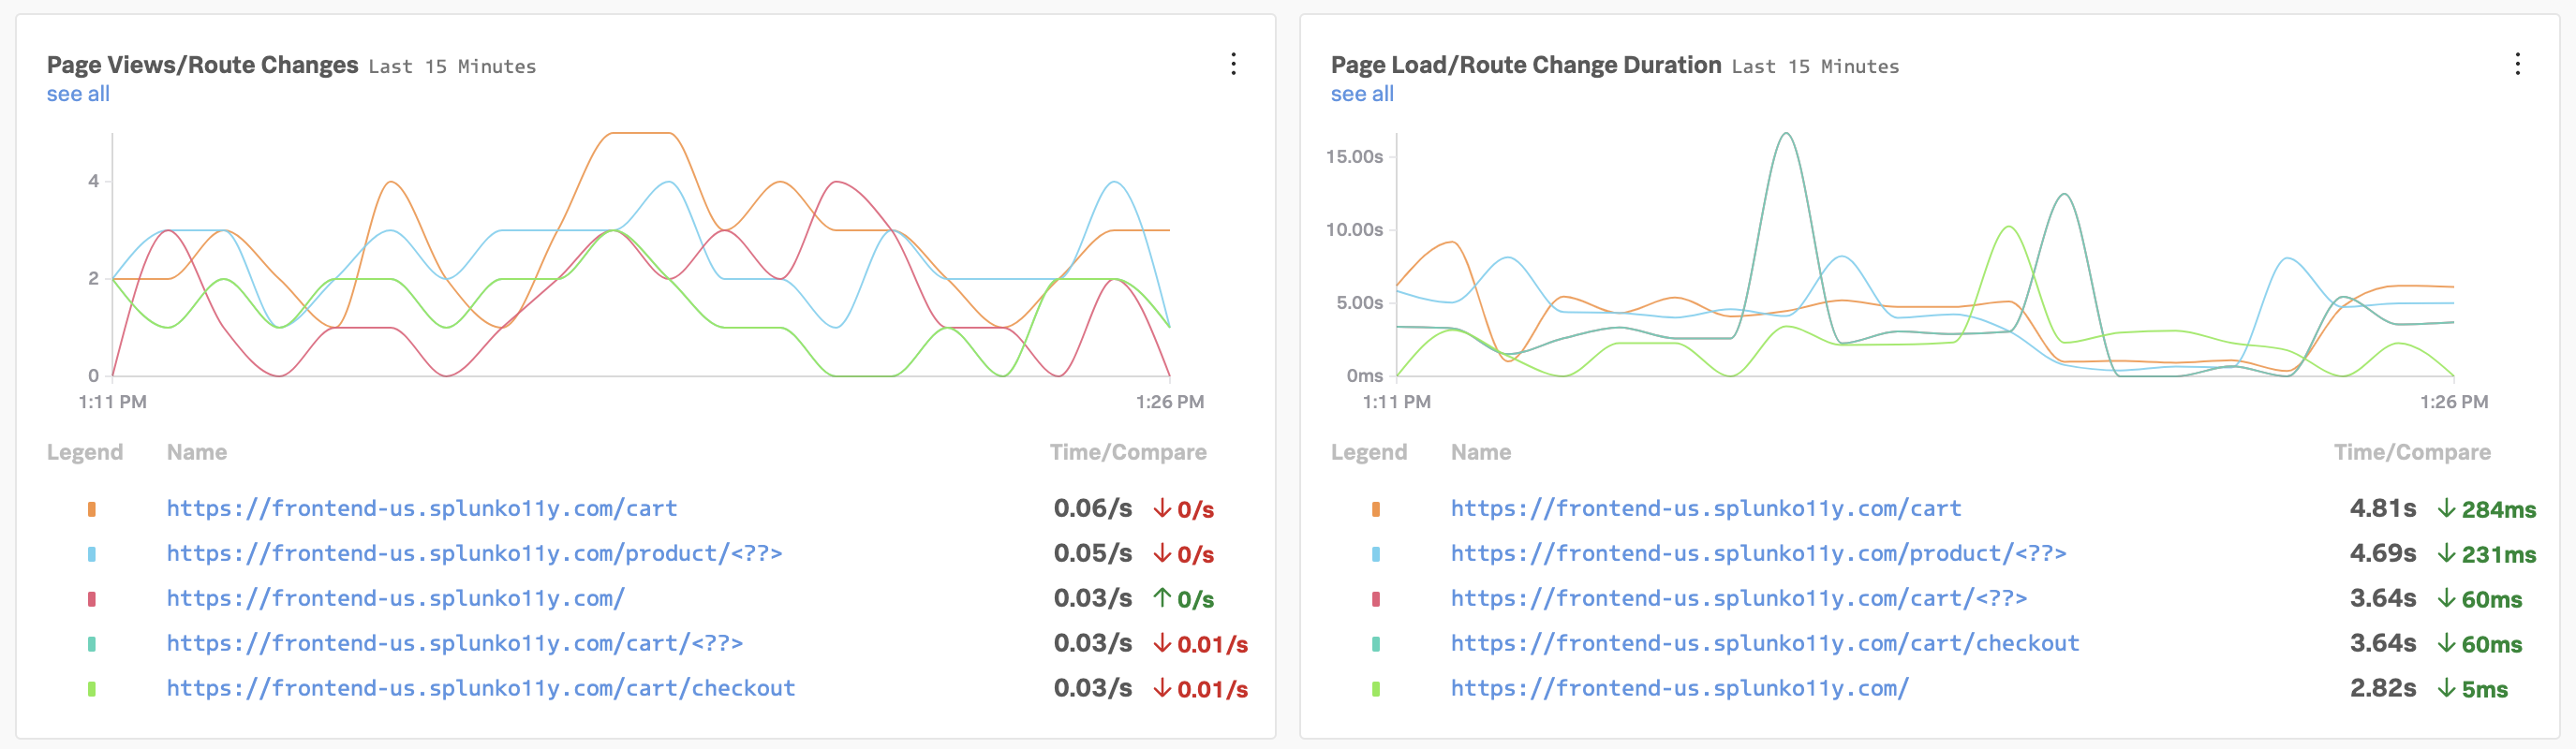
First, we see page load and route change information, which can help us understand if something unexpected is impacting user traffic trends.
Next, Google has defined Core Web Vitals to quantify the user experience as measured by loading, interactivity, and visual stability. Splunk RUM builds in Google’s thresholds into the UI, so you can easily see if your metrics are in an acceptable range.
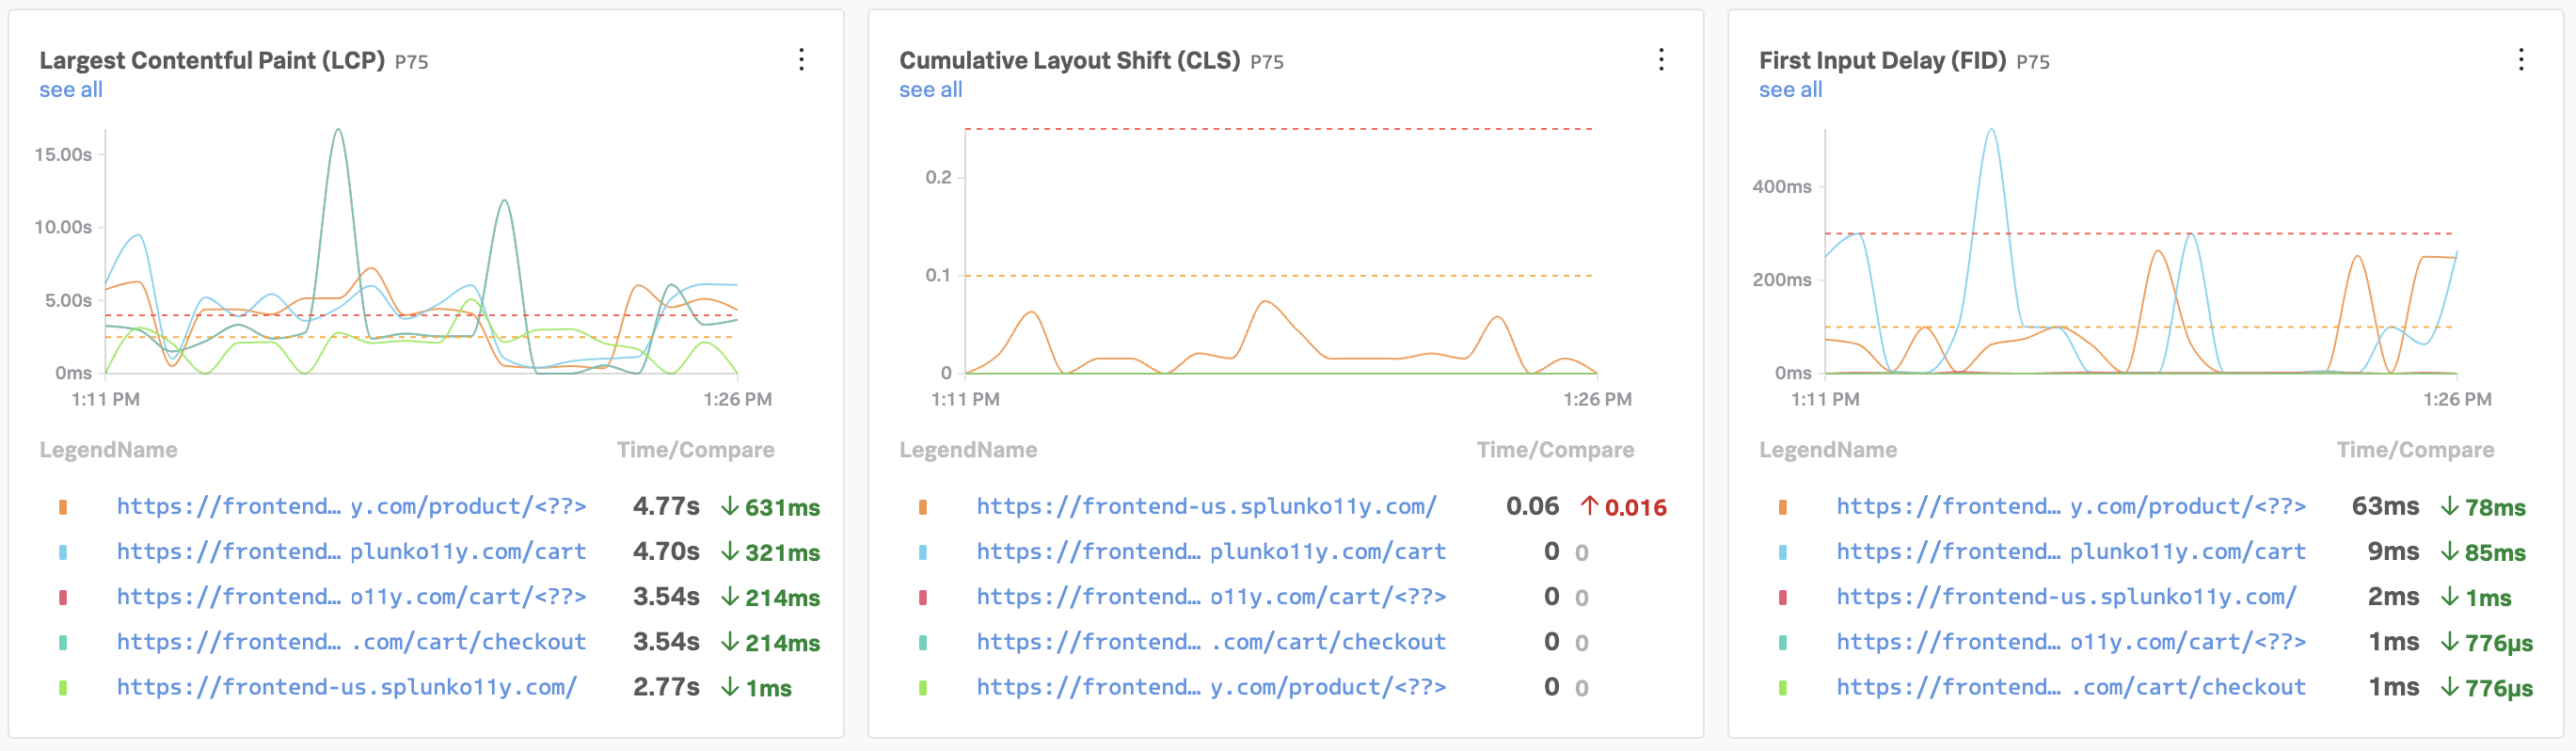
- Largest Contentful Paint (LCP), measures loading performance. How long does it take for the largest block of content in the viewport to load? To provide a good user experience, LCP should occur within 2.5 seconds of when the page first starts loading.
- First Input Delay (FID), measures interactivity. How long does it take to be able to interact with the app? To provide a good user experience, pages should have a FID of 100 milliseconds or less.
- Cumulative Layout Shift (CLS), measures visual stability. How much does the content move around after the initial load? To provide a good user experience, pages should maintain a CLS of 0.1. or less.
Improving Web Vitals is a key component to optimizing your end user experience, so being able to quickly understand them and create detectors if they exceed a threshold is critical.
Google has some great resources if you want to learn more, for example the business impact of Core Web Vitals .
2.3. Front-end health #
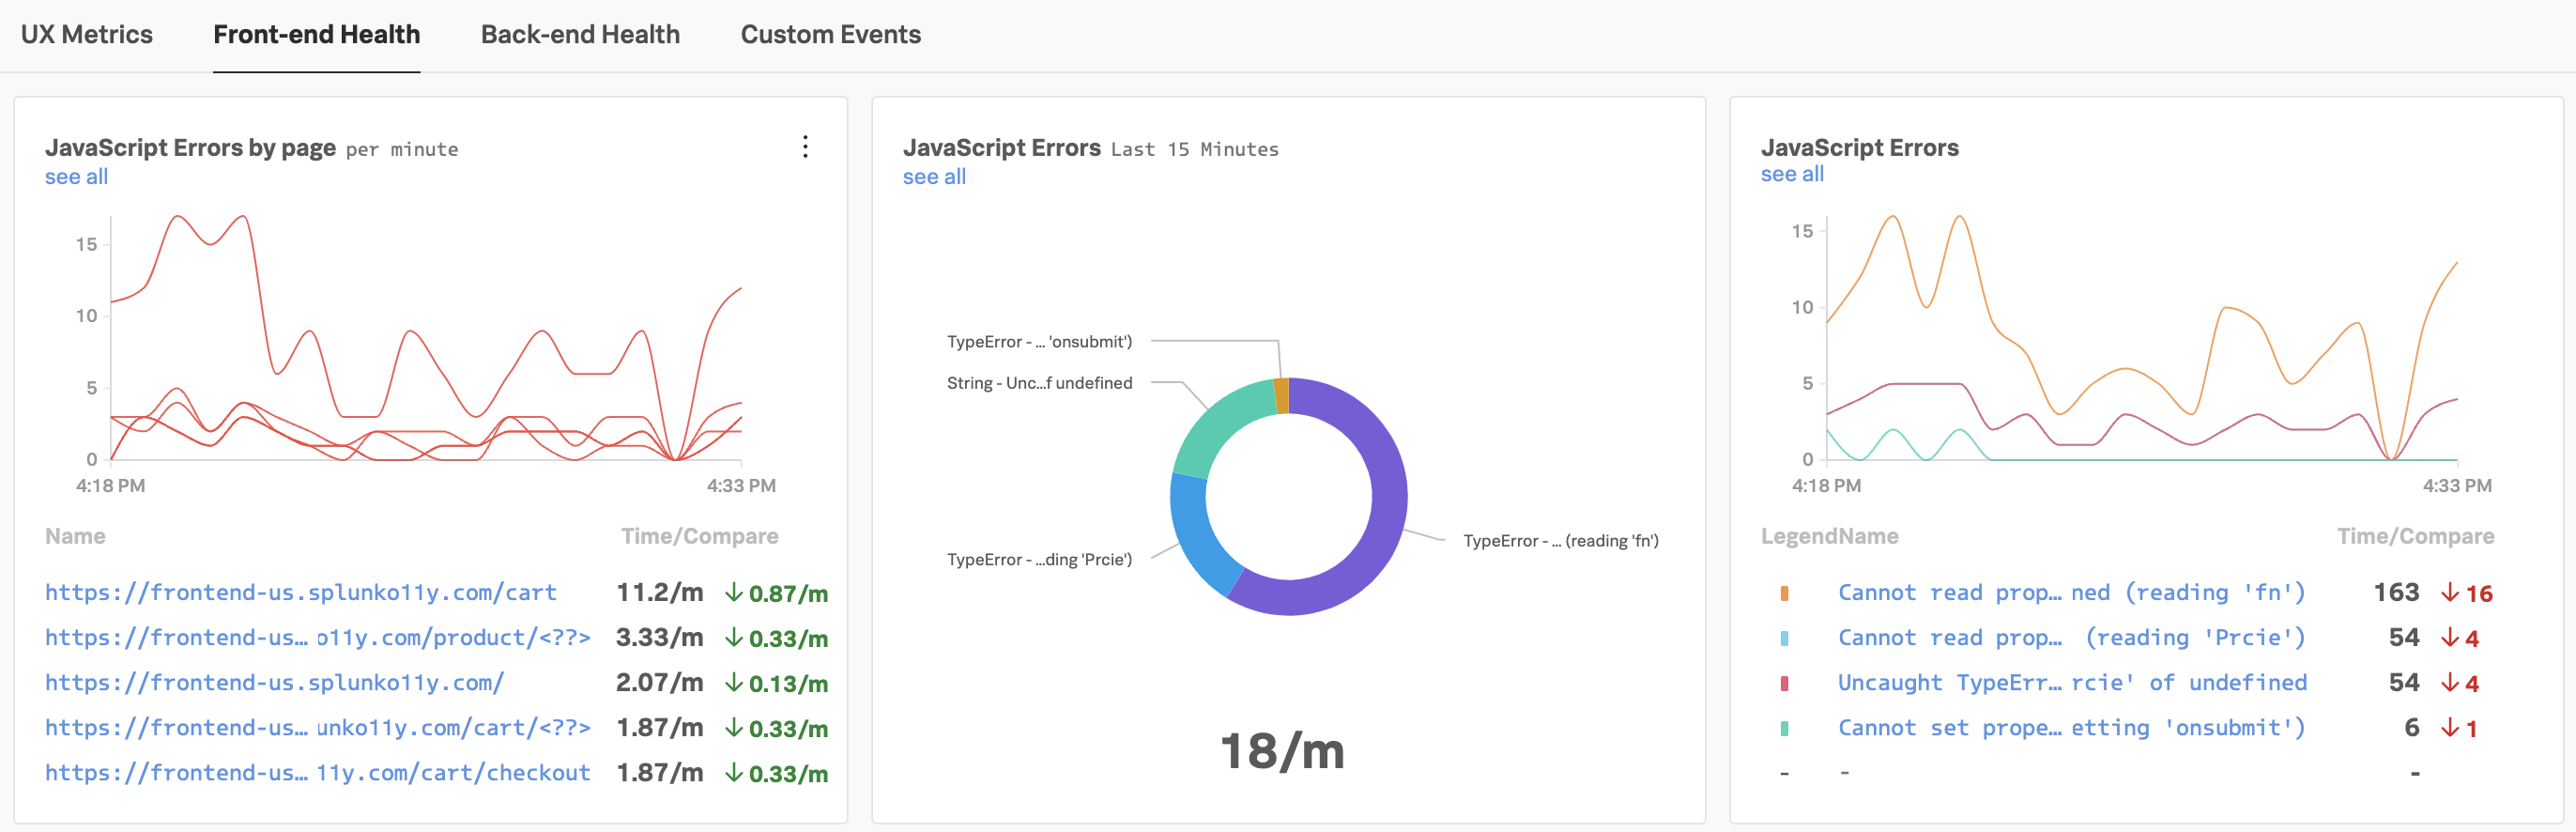
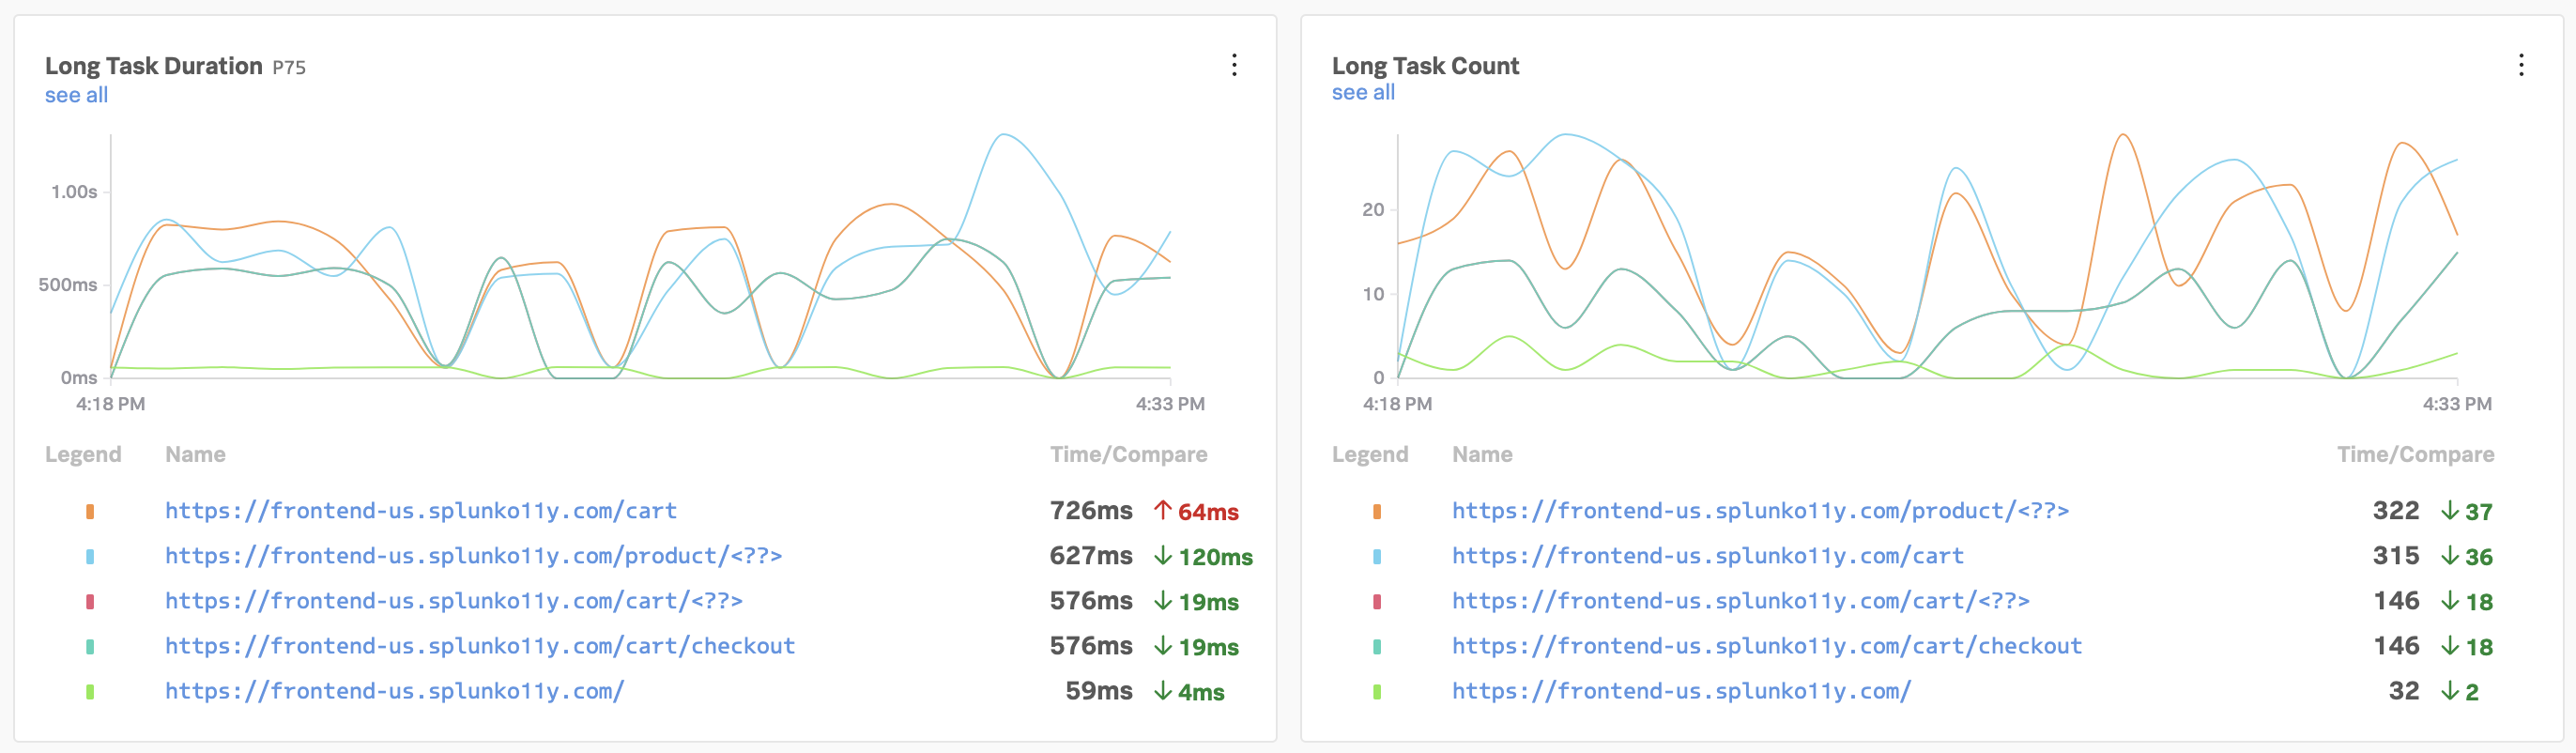
Common causes of frontend issues are javascript errors and long tasks, which can especially affect interactivity. Creating detectors on these indicators helps us investigate interactivity issues sooner than our users report it, allowing us to build workarounds or roll back related releases faster if needed. Learn more about optimizing long tasks for better end user experience!
2.4. Back-end health #
Common back-end issues affecting user experience are network issues and resource requests. In this example, we clearly see a spike in Time To First Byte that lines up with a resource request spike, so we already have a good starting place to investigate.
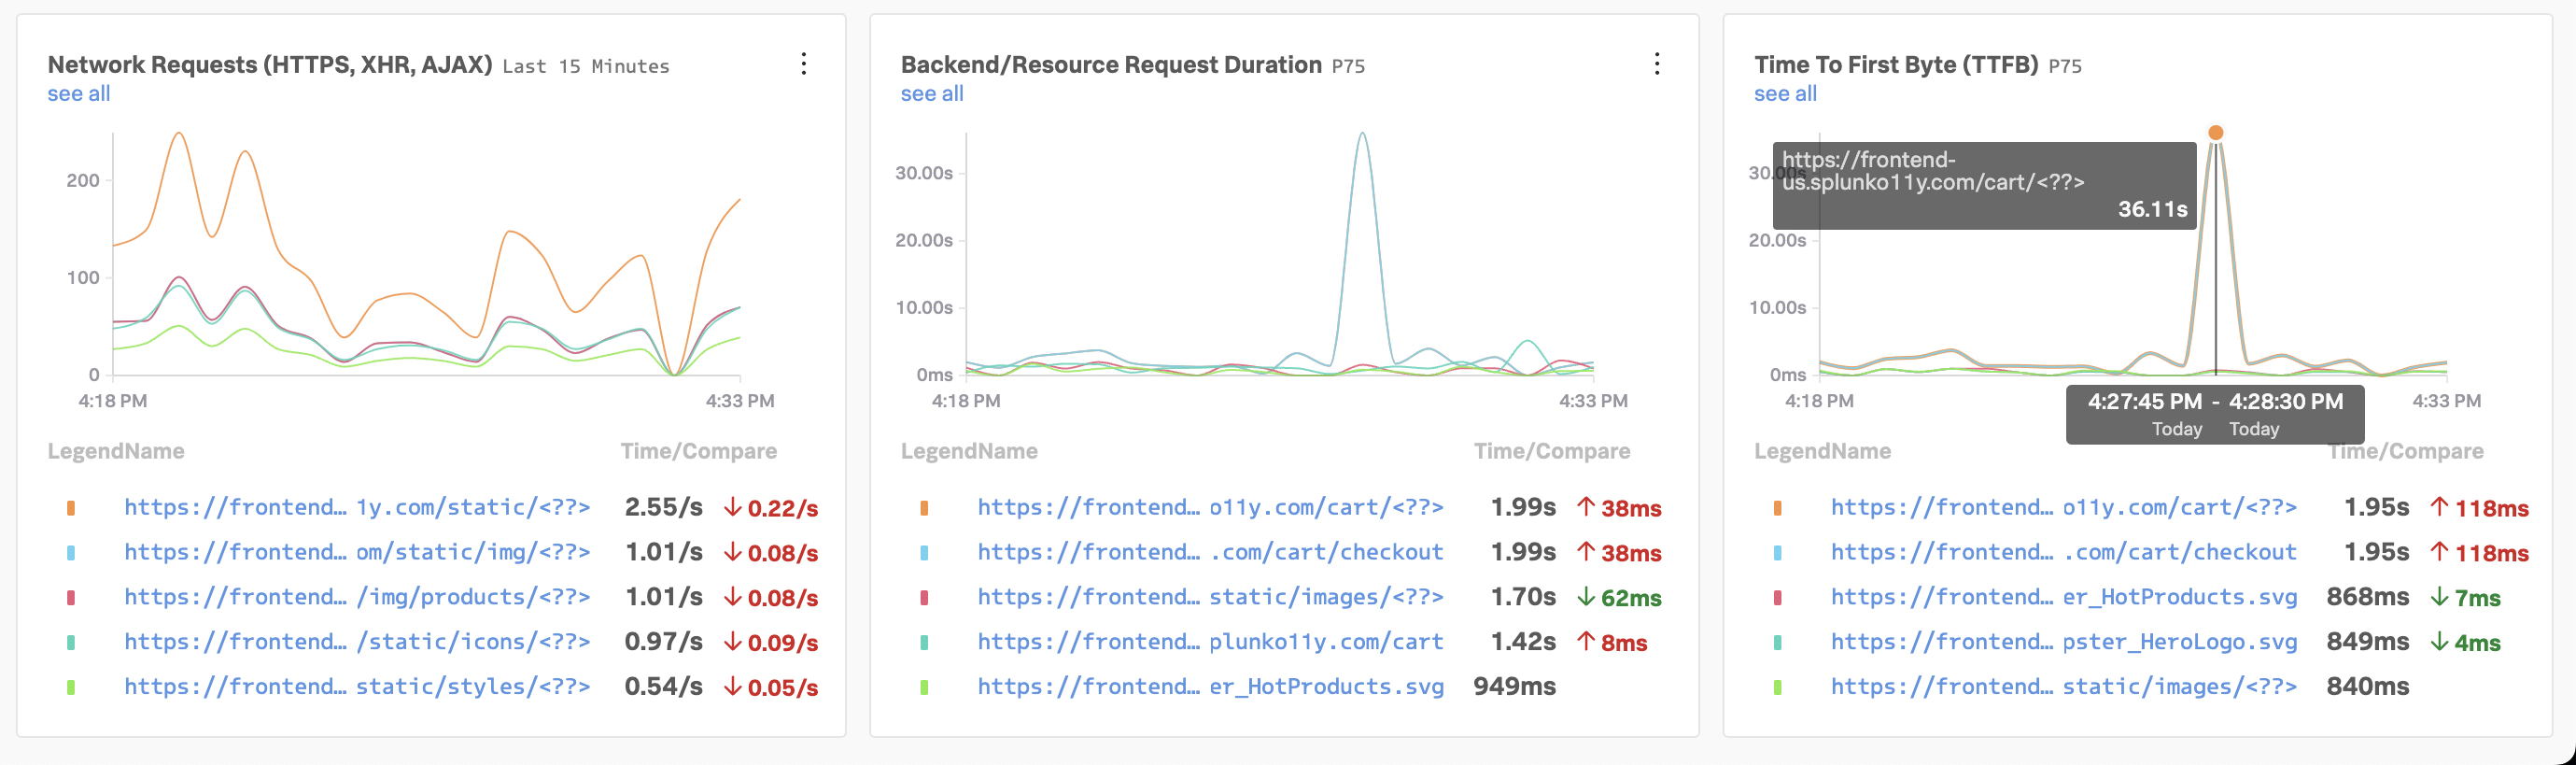
- Time To First Byte (TTFB), measures how long it takes for a client’s browser to receive the first byte of the response from the server. The longer it takes for the server to process the request and send a response, the slower your visitors’ browser is at displaying your page.