During this technical Optimize Cloud Monitoring Workshop, you will build out an environment based on a lightweight Kubernetes1 cluster.
To simplify the workshop modules, a pre-configured AWS/EC2 instance is provided.
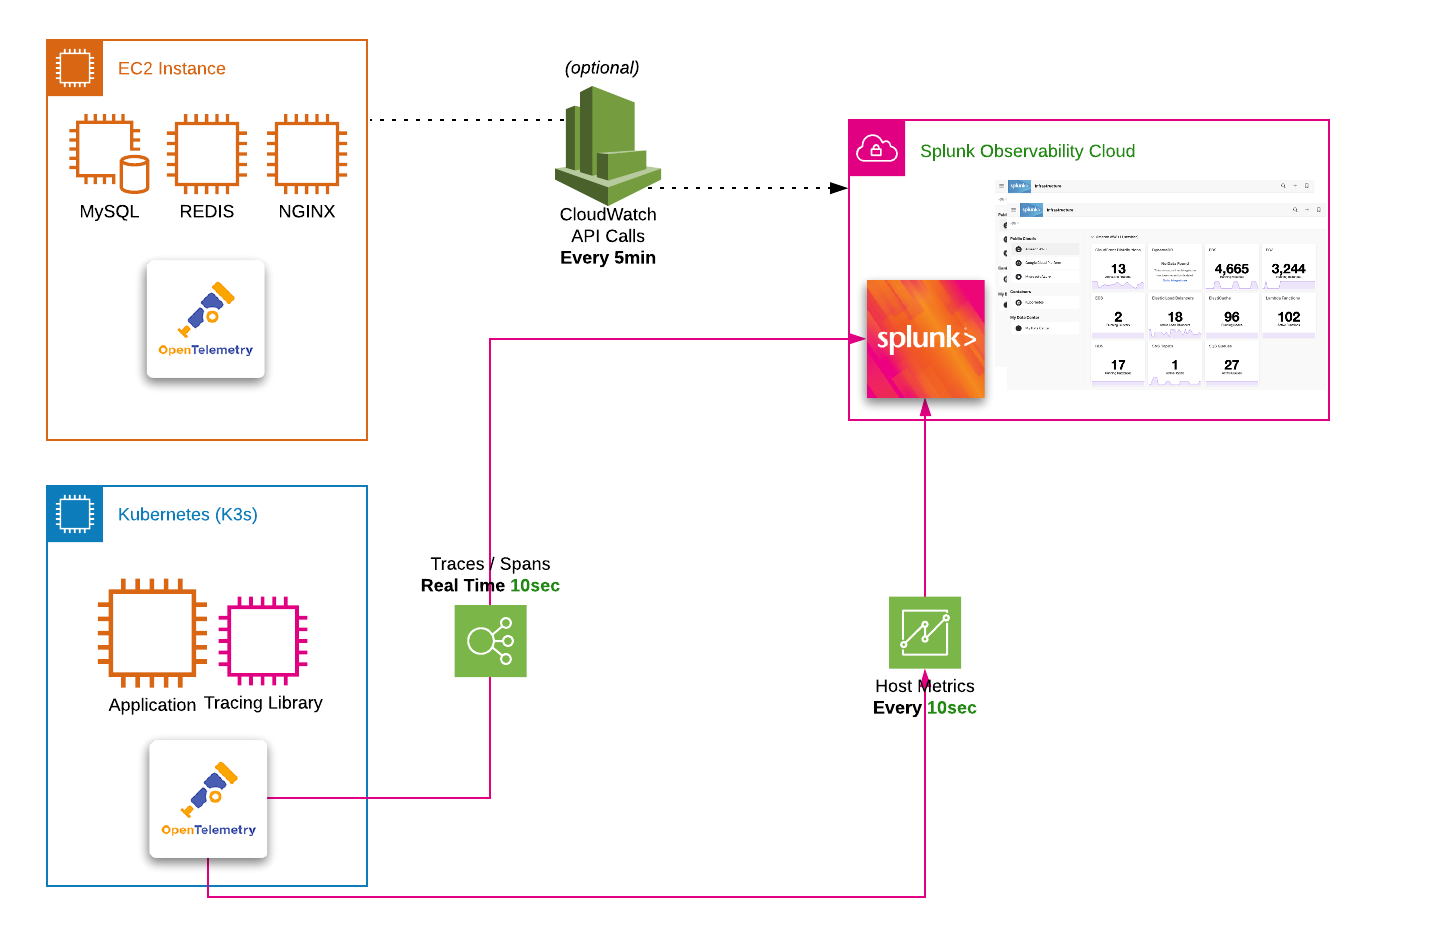
The instance is pre-configured with all the software required to deploy the Splunk OpenTelemetry Connector2 and the microservices-based OpenTelemetry Demo Application3 in Kubernetes which has been instrumented using OpenTelemetry to send metrics, traces, spans and logs.
This workshop will introduce you to the benefits of standardized data collection, how content can be re-used across teams, correlating metrics and logs, and creating detectors to fire alerts. By the end of these technical workshops, you will have a good understanding of some of the key features and capabilities of the Splunk Observability Cloud.
Here are the instructions on how to access your pre-configured AWS/EC2 instance
Kubernetes is a portable, extensible, open-source platform for managing containerized workloads and services, that facilitates both declarative configuration and automation. ↩︎
OpenTelemetry Collector offers a vendor-agnostic implementation on how to receive, process and export telemetry data. In addition, it removes the need to run, operate and maintain multiple agents/collectors to support open-source telemetry data formats (e.g. Jaeger, Prometheus, etc.) sending to multiple open-source or commercial back-ends. ↩︎
The OpenTelemetry Demo Application is a microservice-based distributed system intended to illustrate the implementation of OpenTelemetry in a near real-world environment. ↩︎
Subsections of 1. Getting Started
How to connect to your workshop environment
5 minutesAuthor
Tim Hard
How to retrieve the IP address of the AWS/EC2 instance assigned to you.
Connect to your instance using SSH, Putty1 or your web browser.
Verify your connection to your AWS/EC2 cloud instance.
Using Putty (Optional)
Using Multipass (Optional)
1. AWS/EC2 IP Address
In preparation for the workshop, Splunk has prepared an Ubuntu Linux instance in AWS/EC2.
To get access to the instance that you will be using in the workshop please visit the URL to access the Google Sheet provided by the workshop leader.
Search for your AWS/EC2 instance by looking for your first and last name, as provided during registration for this workshop.
Find your allocated IP address, SSH command (for Mac OS, Linux and the latest Windows versions) and password to enable you to connect to your workshop instance.
It also has the Browser Access URL that you can use in case you cannot connect via SSH or Putty - see EC2 access via Web browser
Important
Please use SSH or Putty to gain access to your EC2 instance if possible and
make a note of the IP address as you will need this during the workshop.
2. SSH (Mac OS/Linux)
Most attendees will be able to connect to the workshop by using SSH from their Mac or Linux device, or on Windows 10 and above.
To use SSH, open a terminal on your system and type ssh splunk@x.x.x.x (replacing x.x.x.x with the IP address found in Step #1).
When prompted Are you sure you want to continue connecting (yes/no/[fingerprint])? please type yes.
Enter the password provided in the Google Sheet from Step #1.
Upon successful login, you will be presented with the Splunk logo and the Linux prompt.
3. SSH (Windows 10 and above)
The procedure described above is the same on Windows 10, and the commands can be executed either in the Windows Command Prompt or PowerShell.
However, Windows regards its SSH Client as an “optional feature”, which might need to be enabled.
You can verify if SSH is enabled by simply executing ssh
If you are shown a help text on how to use the SSH command (like shown in the screenshot below), you are all set.
If the result of executing the command looks something like the screenshot below, you want to enable the “OpenSSH Client” feature manually.
To do that, open the “Settings” menu, and click on “Apps”. While in the “Apps & features” section, click on “Optional features”.
Here, you are presented with a list of installed features. On the top, you see a button with a plus icon to “Add a feature”. Click it.
In the search input field, type “OpenSSH”, and find a feature called “OpenSSH Client”, or respectively, “OpenSSH Client (Beta)”, click on it, and click the “Install”-button.
Now you are set! In case you are not able to access the provided instance despite enabling the OpenSSH feature, please do not shy away from reaching
out to the course instructor, either via chat or directly.
If you are blocked from using SSH (Port 22) or unable to install Putty you may be able to connect to the workshop instance by using a web browser.
Note
This assumes that access to port 6501 is not restricted by your company’s firewall.
Open your web browser and type http://x.x.x.x:6501 (where X.X.X.X is the IP address from the Google Sheet).
Once connected, login in as splunk and the password is the one provided in the Google Sheet.
Once you are connected successfully you should see a screen similar to the one below:
Unlike when you are using regular SSH, copy and paste does require a few extra steps to complete when using a browser session. This is due to cross browser restrictions.
When the workshop asks you to copy instructions into your terminal, please do the following:
Copy the instruction as normal, but when ready to paste it in the web terminal, choose Paste from the browser as show below:
This will open a dialogue box asking for the text to be pasted into the web terminal:
Paste the text in the text box as shown, then press OK to complete the copy and paste process.
Note
Unlike regular SSH connection, the web browser has a 60-second time out, and you will be disconnected, and a Connect button will be shown in the center of the web terminal.
Simply click the Connect button and you will be reconnected and will be able to continue.
For this workshop, we’ll be using the OpenTelemetry Demo Application running in Kubernetes. This application is for an online retailer and includes more than a dozen services written in many different languages. While metrics, traces, and logs are being collected from this application, this workshop is primarily focused on how Splunk Observability Cloud can be used to more efficiently monitor infrastructure.
The initial setup can be completed by executing the following steps on the command line of your EC2 instance.
cd ~/workshop/optimize-cloud-monitoring &&\
./deploy-application.sh
You’ll be asked to enter your favorite city. This will be used in the OpenTelemetry Collector configuration as a custom tag to show how easy it is to add additional context to your observability data.