Collect Data with Standards
Deploy Gateway
Gateway #
First we will deploy the OTel Gateway. The workshop instructor will deploy the gateway, but we will walk through the steps here if you wish to try this yourself on a second instance.
The steps:
- Click the Data Management icon in the toolbar
- Click the + Add integration button
- Click Deploy the Splunk OpenTelemetry Collector button
- Click Next
- Select Linux
- Change mode to Data forwarding (gateway)
- Set the environment to prod
- Choose the access token for this workshop
- Click Next
- Copy the installer script and run it in the provided linux environment.
Once our gateway is started we will notice… Nothing. The gateway, by default, doesn’t send any data. It can be configured to send data, but it doesn’t by default.
We can review the config file with:
sudo cat /etc/otel/collector/splunk-otel-collector.confAnd see that the config being used is gateway_config.yaml.
Tip
| Diagram | What it Tells Us |
|---|---|
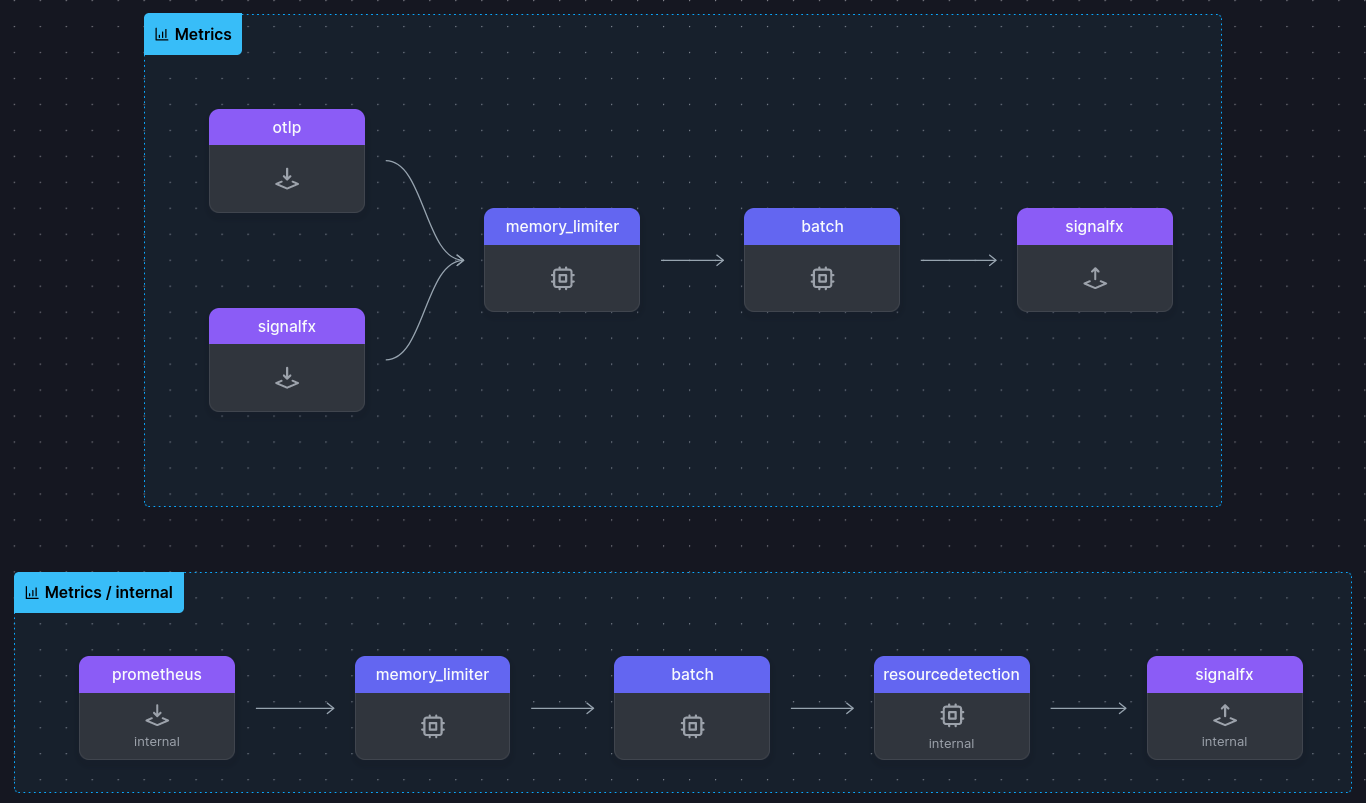 | Metrics: The gateway will receive metrics over otlp or signalfx protocols, and then send these metrics to Splunk Observability Cloud with the signalfx protocol. There is also a pipeline for prometheus metrics to be sent to Splunk. That pipeline is labeled internal and is meant to be for the collector. (In other words if we want to receive prometheus directly we should add it to the main pipeline.) |
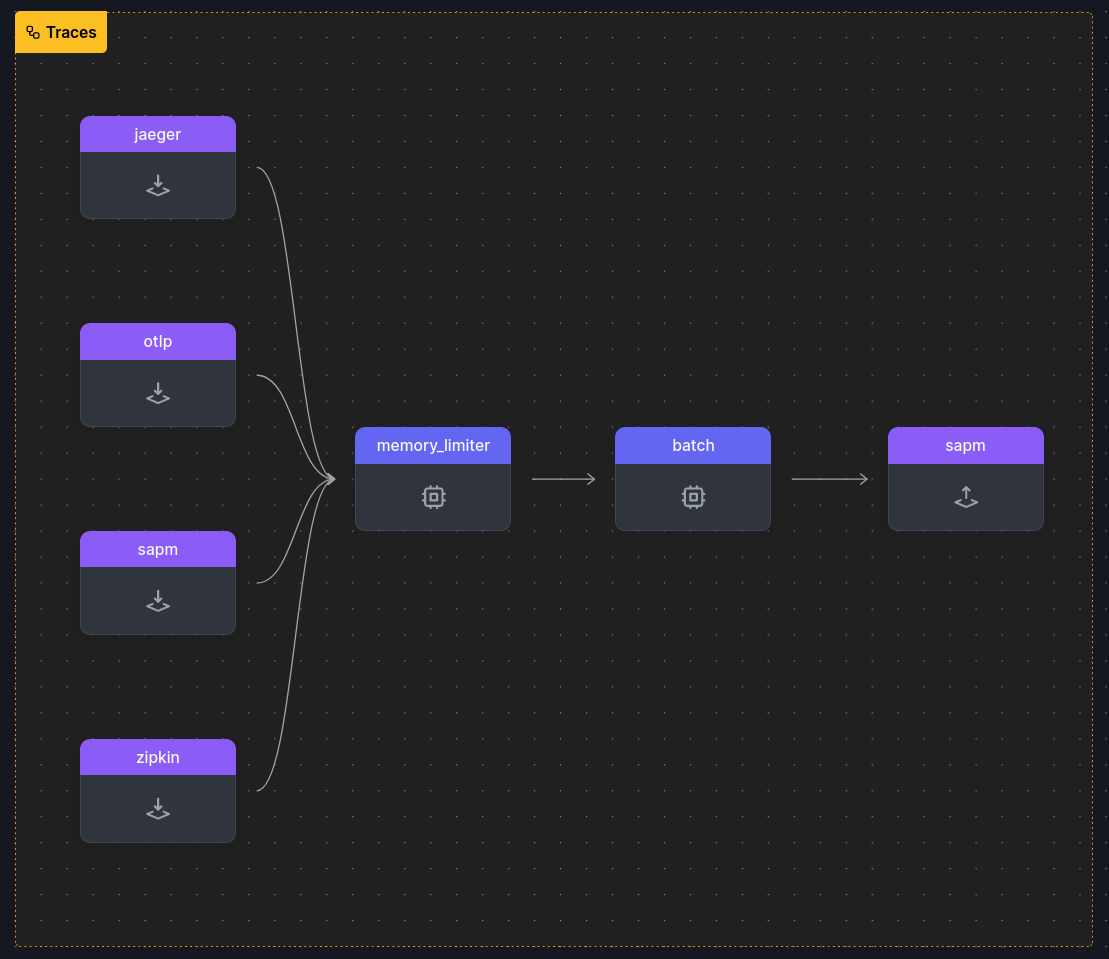 | Traces: The gateway will receive traces over jaeger, otlp, sapm, or zipkin and then send these traces to Splunk Observability Cloud with the sapm protocol. |
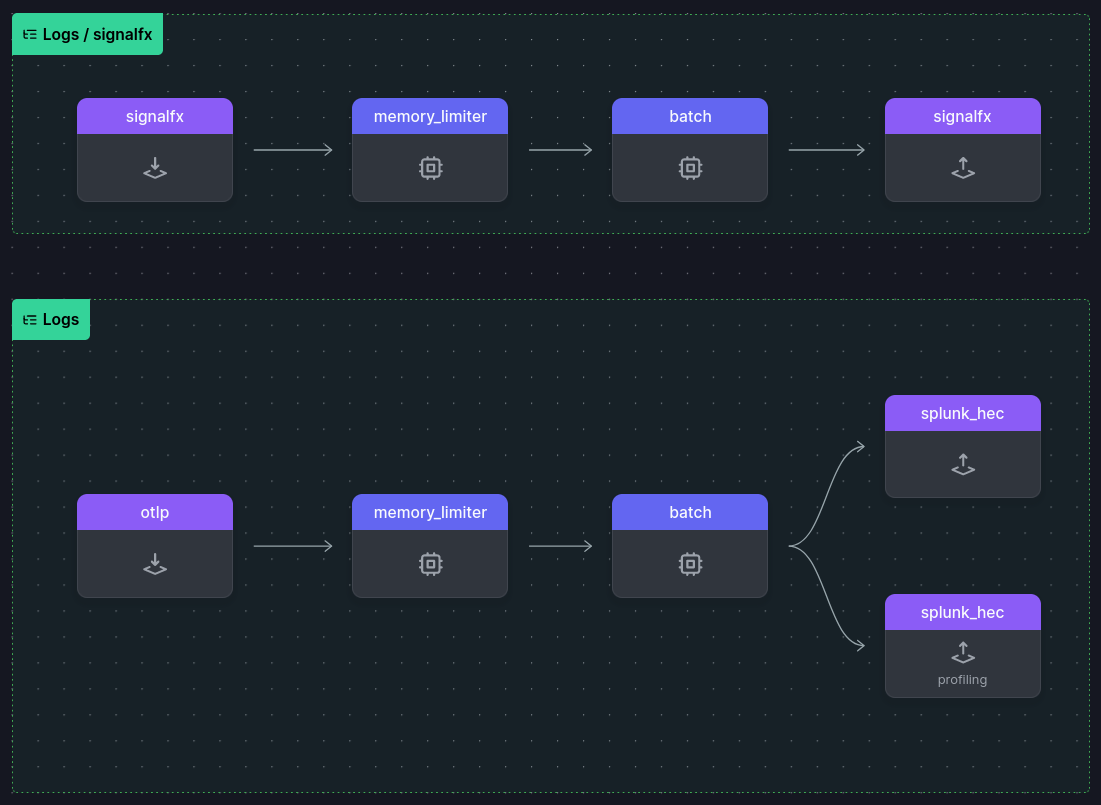 | Logs: The gateway will receive logs over otlp and then send these logs to 2 places: Splunk Enterprise (Cloud) (for logs) and Splunk Observability Cloud (for profiling data). There is also a pipeline labeled signalfx that is sending signalfx to Splunk Observability Cloud; these are events that can be used to add events to charts, as well as the process list. |
We’re not going to see any host metrics, and we aren’t send any other data through the gateway yet. But we do have the internal metrics being sent in.
You can find it by creating a new chart and adding a metric:
- Click the + in the top-right
- Click Chart
- For the signal of Plot A, type
otelcol_process_uptime - Add a filter with the + to the right, and type:
host.id:<name of instance>
You should get a chart like the following: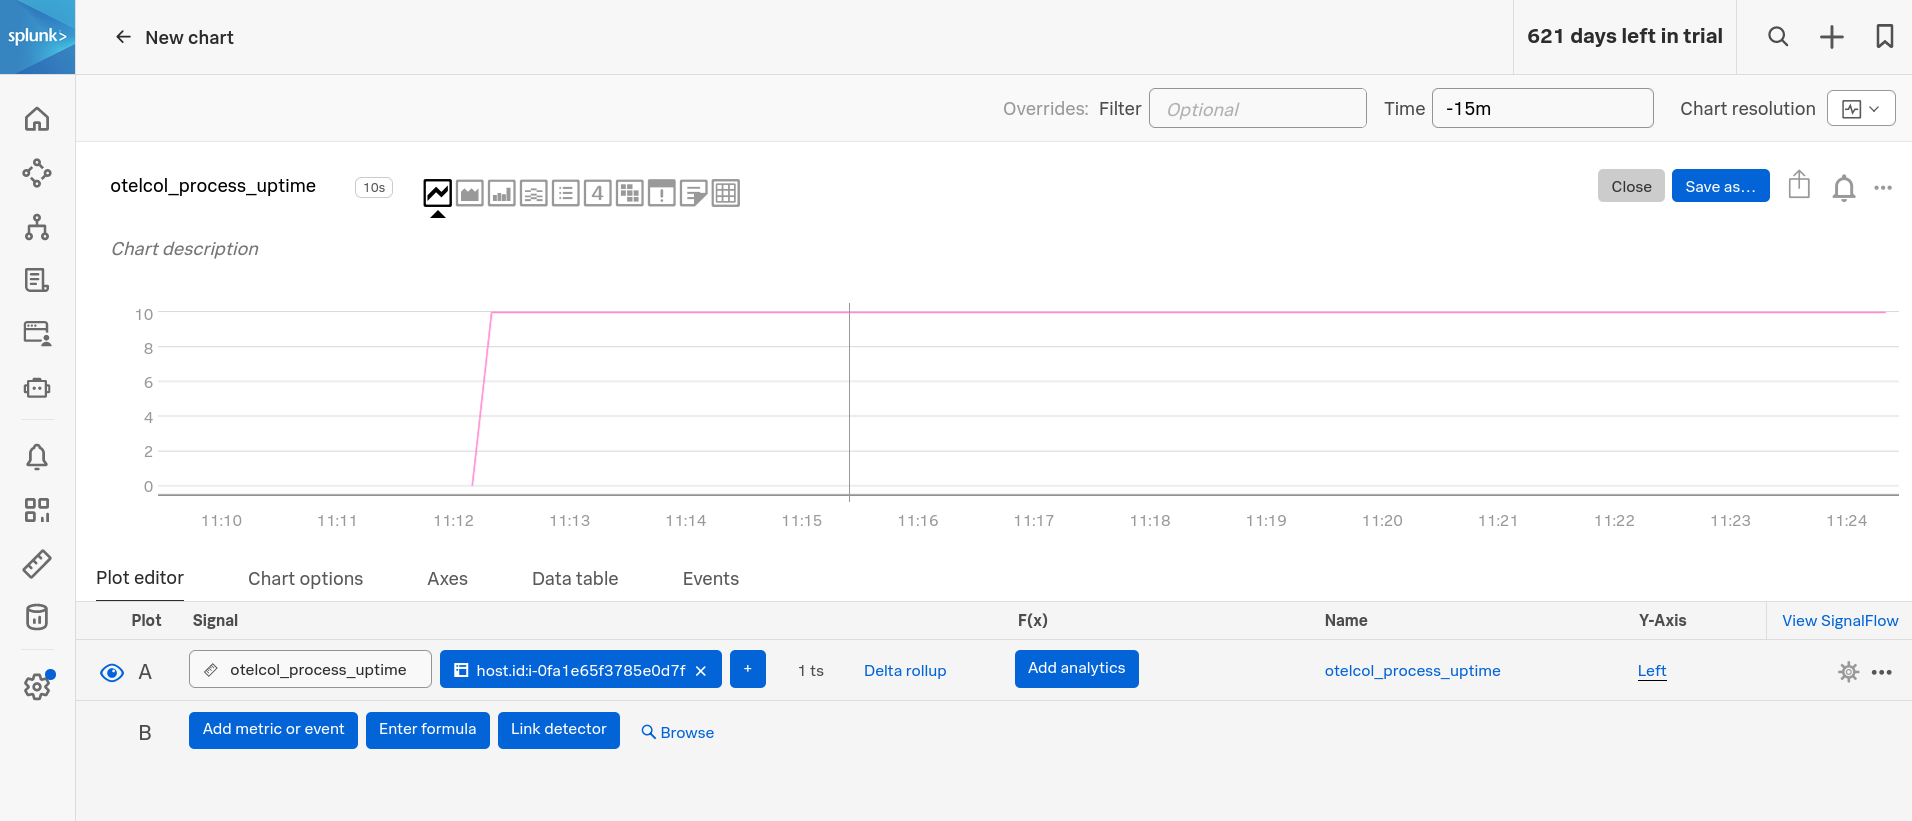
You can look at the Metric Finder to find other internal metrics to explore.
Add Metadata #
Before we deploy a collector (agent) let’s add some metada onto metrics and traces with the gateway. That’s how we will know data is passing through it.
The attributes processor let’s us add some metadata.
sudo vi /etc/otel/collector/agent_config.yamlHere’s what we want to add to the processors section:
processors:
  attributes/gateway_config:
    actions:
      - key: gateway
        value: oac
        action: insert
And then to the pipelines (adding attributes/gateway_config to each):
service:
  pipelines:
    traces:
      receivers: [jaeger, otlp, smartagent/signalfx-forwarder, zipkin]
      processors:
      - memory_limiter
      - batch
      - resourcedetection
      - attributes/gateway_config
      #- resource/add_environment
      exporters: [sapm, signalfx]
      # Use instead when sending to gateway
      #exporters: [otlp, signalfx]
    metrics:
      receivers: [hostmetrics, otlp, signalfx, smartagent/signalfx-forwarder]
      processors: [memory_limiter, batch, resourcedetection, attributes/gateway_config]
      exporters: [signalfx]
      # Use instead when sending to gateway
      #exporters: [otlp]
And finally we need to restart the gateway:
sudo systemctl restart splunk-otel-collector.serviceWe can make sure it is still running fine by checking the status:
sudo systemctl status splunk-otel-collector.service Next #
Next, let’s deploy a collector and then configure it to this gateway.