Splunk Integration
Configure the OpenTelemetry-based metrics stream from ThousandEyes into Splunk Observability Cloud.
About Splunk Observability Cloud #
Splunk Observability Cloud is a real-time observability platform purpose-built for monitoring metrics, traces, and logs at scale. It ingests OpenTelemetry data and provides advanced dashboards and analytics to help teams detect and resolve performance issues quickly. This section explains how to integrate ThousandEyes data with Splunk Observability Cloud using OpenTelemetry.
Scope Of This Section
Get or Create a Splunk Observability Cloud Access Token
To send ThousandEyes metrics to Splunk Observability Cloud, you need an access token with the Ingest scope.
For this workshop we will use the token provided. You can get it from the instance:
. ~/workshop/petclinic/scripts/check_env.sh | grep ACCESS_TOKENOr you can get it from the Splunk Observability Cloud UI, as shown in the clip below.
Create an Integration
This integration is the one-way telemetry stream that gets ThousandEyes metrics into Splunk Observability Cloud dashboards and detectors.
Using the ThousandEyes UI
To integrate Splunk Observability Cloud with ThousandEyes:
- Log in to your account on the ThousandEyes platform and go to Manage > Integration > Integration 1.0
- Click New Integration and select ThousandEyes for OpenTelemetry
- Enter a Name for the integration
- Set the Target to HTTP
- Enter the Endpoint URL:
https://ingest.{REALM}.signalfx.com/v2/datapoint/otlp- Replace
{REALM}with your Splunk environment (e.g.,us1,eu0)
- Replace
- For Preset Configuration, select Splunk Observability Cloud
- For Auth Type, select Custom
- Add the following Custom Headers:
X-SF-Token: {TOKEN}(Enter your Splunk Observability Cloud access token created in Step 1)Content-Type: application/x-protobuf
- For OpenTelemetry Signal, select Metric
- For Data Model Version, select v2
- Select the tests you want to send.
Add test later
If you add a new test, you will need to add it back to this integration later
- Click Save to complete the integration setup

You have now successfully integrated your ThousandEyes data with Splunk Observability Cloud.
Pending State
What Comes Next
ThousandEyes Dashboard in Splunk Observability Cloud
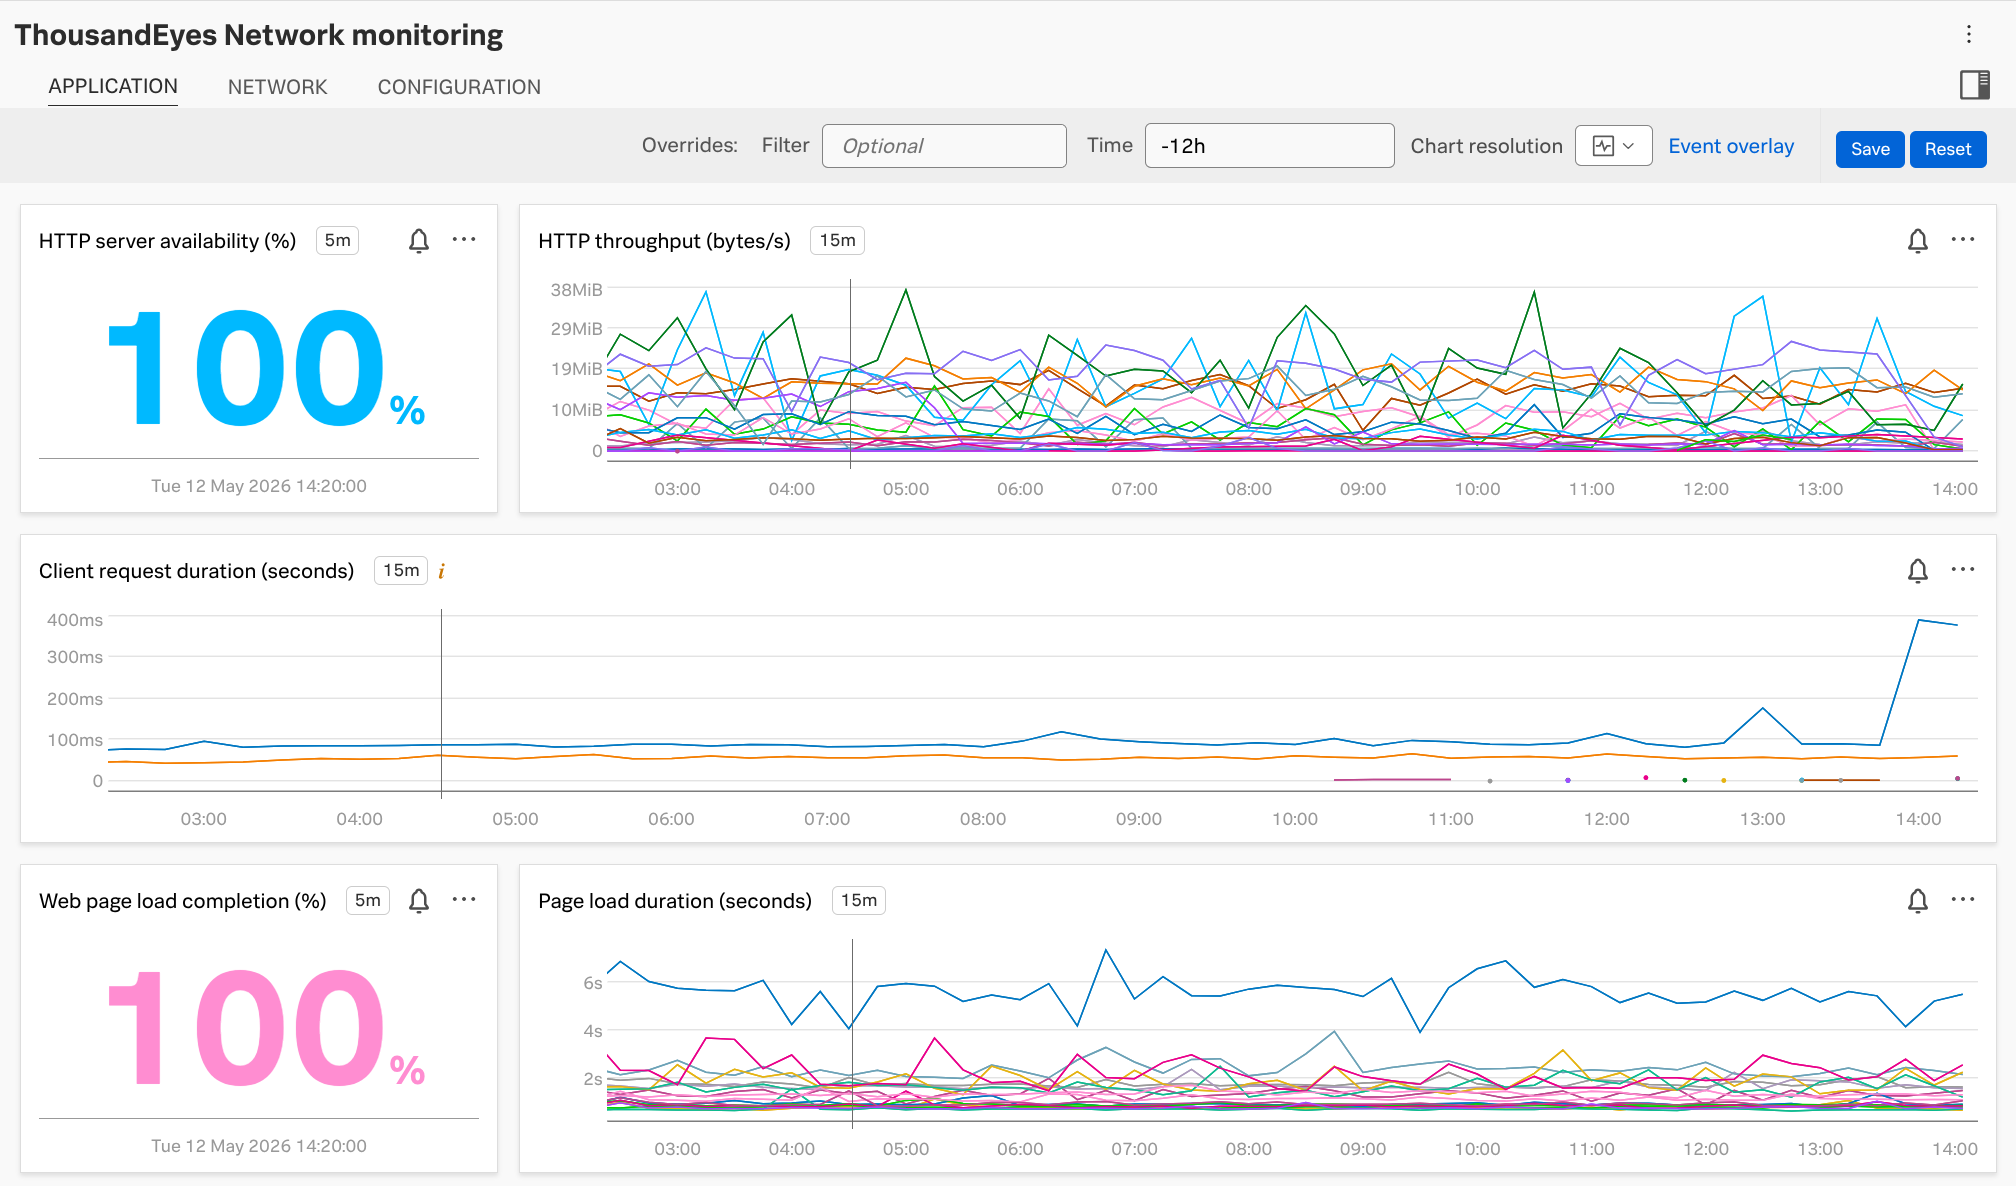
Once the integration is set up, you can view real-time monitoring data in the ThousandEyes Network Monitoring Dashboard within Splunk Observability Cloud. The dashboard includes:
- HTTP Server Availability (%): Displays the availability of monitored HTTP servers
- HTTP Throughput (bytes/s): Shows the data transfer rate over time
- Client Request Duration (seconds): Measures the latency of client requests
- Web Page Load Completion (%): Indicates the percentage of successful page loads
- Page Load Duration (seconds): Displays the time taken to load pages
Deploy the Dashboard Template
You can download the dashboard template from the following link: Download ThousandEyes Splunk Observability Cloud dashboard template . Then you can import it into Splunk Observability Cloud (this has already been done).
If you have any tests running you will see data already.