Distributed Tracing and Bi-Directional Drilldowns
Distributed Tracing and Bi-Directional Drilldowns
Configure instrumentation
Summary of the changes we need to make #
The ThousandEyes documentation , and specifically the page for Splunk Observability APM , shows what is needed for distributed tracing:
For Propagators:
baggageforb3allows extraction of ThousandEyes B3 headers.tracecontextpreservestraceparentandtracestate
In addition setting the sampler to parentbased_always_on ensures the trace continues once ThousandEyes starts the request.
Important Lesson
We will make the following changes:
- Step 1: Modify the OTel Collector
- Patch the instrumentation with the correct order for propagators (
baggage,b3,tracecontext)
- Patch the instrumentation with the correct order for propagators (
- Step 2: Patch the application
- Patch the services to inject java instrumentation
Step 1: Modify the OTel Collector #
Let’s check the configuration of the instrumentation:
kubectl describe instrumentation splunk-otel-collectorName: splunk-otel-collector
Namespace: default
Labels: app=splunk-otel-collector
...
Spec:
...
Propagators:
tracecontext
baggage
b3
...Under Propagators you can see that the ones we need are set, but we will still patch it so it’s in the correct order.
Step 2: Patch the instrumentation (to resolve the defaults) #
We’re going to patch this for now, but any future upgrades will lose this change. So the right way to do this would be to update a values.yaml file so that this is always applied.
kubectl patch instrumentation splunk-otel-collector \
  --type=merge \
  -p '{
    "spec": {
      "propagators": ["baggage", "b3", "tracecontext"],
      "sampler": {
        "type": "parentbased_always_on"
      }
    }
}'instrumentation.opentelemetry.io/splunk-otel-collector patchedYou can then verify the Propagators (in the right order) and added sampler are there:
kubectl describe instrumentation splunk-otel-collectorName: splunk-otel-collector
Namespace: default
Labels: app=splunk-otel-collector
...
Spec:
...
Propagators:
baggage
b3
tracecontext
...
Sampler:
Type: parentbased_always_on
...Step 3: Patch the application #
First, let’s check which container images are deployed:
kubectl describe pods api-gateway | grep Image: Image: quay.io/phagen/spring-petclinic-api-gateway:0.0.7We can see there is only one container for the api-gateway. Once we patch the application we will see multiple container images (one for the api-gateway, and the other for instrumentation).
Let’s inject the java instrumentation. (NOTE: There will be no change for the config-server, discovery-server and admin-server as these have already been patched.):
kubectl get deployments -l app.kubernetes.io/part-of=spring-petclinic -o name | xargs -I % kubectl patch % -p "{\"spec\": {\"template\":{\"metadata\":{\"annotations\":{\"instrumentation.opentelemetry.io/inject-java\":\"default/splunk-otel-collector\"}}}}}"deployment.apps/admin-server patched (no change)
deployment.apps/api-gateway patched
deployment.apps/config-server patched (no change)
deployment.apps/customers-service patched
deployment.apps/discovery-server patched (no change)
deployment.apps/vets-service patched
deployment.apps/visits-service patchedFor other runtimes
For other runtimes, use the annotation that matches the language; for example:
instrumentation.opentelemetry.io/inject-nodejsinstrumentation.opentelemetry.io/inject-pythoninstrumentation.opentelemetry.io/inject-dotnet
We can check that our instrumentation deployed with:
kubectl describe pods api-gateway | grep Image: Image: ghcr.io/signalfx/splunk-otel-java/splunk-otel-java:v2.27.0
Image: quay.io/phagen/spring-petclinic-api-gateway:0.0.7You can also see that this pod has the Java instrumentation enabled, and the propagators are including baggage, b3, and tracecontext in the right ordeer:
kubectl describe pods api-gateway | grep OTEL_PROPAGATORS OTEL_PROPAGATORS: baggage,b3,tracecontextRestart all the pods
Since some of the pods were already injected, it’s important we restart them all to get the correct instrumentation.
To do that:
kubectl rollout restart deployment -l app.kubernetes.io/part-of=spring-petclinicdeployment.apps/admin-server restarted
deployment.apps/api-gateway restarted
deployment.apps/config-server restarted
deployment.apps/customers-service restarted
deployment.apps/discovery-server restarted
deployment.apps/petclinic-db restarted
deployment.apps/petclinic-loadgen-deployment restarted
deployment.apps/splunk-otel-collector-k8s-cluster-receiver restarted
deployment.apps/splunk-otel-collector-operator restarted
deployment.apps/thousandeyes restarted
deployment.apps/vets-service restarted
deployment.apps/visits-service restartedNow we can validate the in-cluster API path from the namespace where the ThousandEyes Enterprise Agent runs.
Try running:
kubectl run te-petclinic-curl \
  --rm -it \
  --restart=Never \
  --image=curlimages/curl \
--command -- curl -sS http://api-gateway.default.svc.cluster.local:82/api/customer/owners[{"id":1,"firstName":"George","lastName":"Franklin","address":"110 W. Liberty St.","city":"Madison","telephone":"6085551023","pets":[{"id":1,"name":"Leo","birthDate":"2000-09-07","type":{"id":1,"name":"cat"}}]},{"id":2,"firstName":"Betty","lastName":"Davis","address":"638 Cardinal Ave.","city":"Sun Prairie","telephone":"6085551749","pets":[{"id":2,"name":"Basil","birthDate":"2002-08-06","type":{"id":6,"name":"hamster"}}]},{"id":3,"firstName":"Eduardo","lastName":"Rodriquez","address":"2693 Commerce St.","city":"McFarland","telephone":"6085558763","pets":[{"id":4,"name":"Jewel","birthDate":"2000-03-07","type":{"id":2,"name":"dog"}},{"id":3,"name":"Rosy","birthDate":"2001-04-17","type":{"id":2,"name":"dog"}}]},{"id":4,"firstName":"Harold","lastName":"Davis","address":"563 Friendly St.","city":"Windsor","telephone":"6085553198","pets":[{"id":5,"name":"Iggy","birthDate":"2000-11-30","type":{"id":3,"name":"lizard"}}]},{"id":5,"firstName":"Peter","lastName":"McTavish","address":"2387 S. Fair Way","city":"Madison","telephone":"6085552765","pets":[{"id":6,"name":"George","birthDate":"2000-01-20","type":{"id":4,"name":"snake"}}]},{"id":6,"firstName":"Jean","lastName":"Coleman","address":"105 N. Lake St.","city":"Monona","telephone":"6085552654","pets":[{"id":8,"name":"Max","birthDate":"1995-09-04","type":{"id":1,"name":"cat"}},{"id":7,"name":"Samantha","birthDate":"1995-09-04","type":{"id":1,"name":"cat"}}]},{"id":7,"firstName":"Jeff","lastName":"Black","address":"1450 Oak Blvd.","city":"Monona","telephone":"6085555387","pets":[{"id":9,"name":"Lucky","birthDate":"1999-08-06","type":{"id":5,"name":"bird"}}]},{"id":8,"firstName":"Maria","lastName":"Escobito","address":"345 Maple St.","city":"Madison","telephone":"6085557683","pets":[{"id":10,"name":"Mulligan","birthDate":"1997-02-24","type":{"id":2,"name":"dog"}}]},{"id":9,"firstName":"David","lastName":"Schroeder","address":"2749 Blackhawk Trail","city":"Madison","telephone":"6085559435","pets":[{"id":11,"name":"Freddy","birthDate":"2000-03-09","type":{"id":5,"name":"bird"}}]},{"id":10,"firstName":"Carlos","lastName":"Estaban","address":"2335 Independence La.","city":"Waunakee","telephone":"6085555487","pets":[{"id":12,"name":"Lucky","birthDate":"2000-06-24","type":{"id":2,"name":"dog"}},{"id":13,"name":"Sly","birthDate":"2002-06-08","type":{"id":1,"name":"cat"}}]}]pod "te-petclinic-curl" deleted from default namespaceBe patient
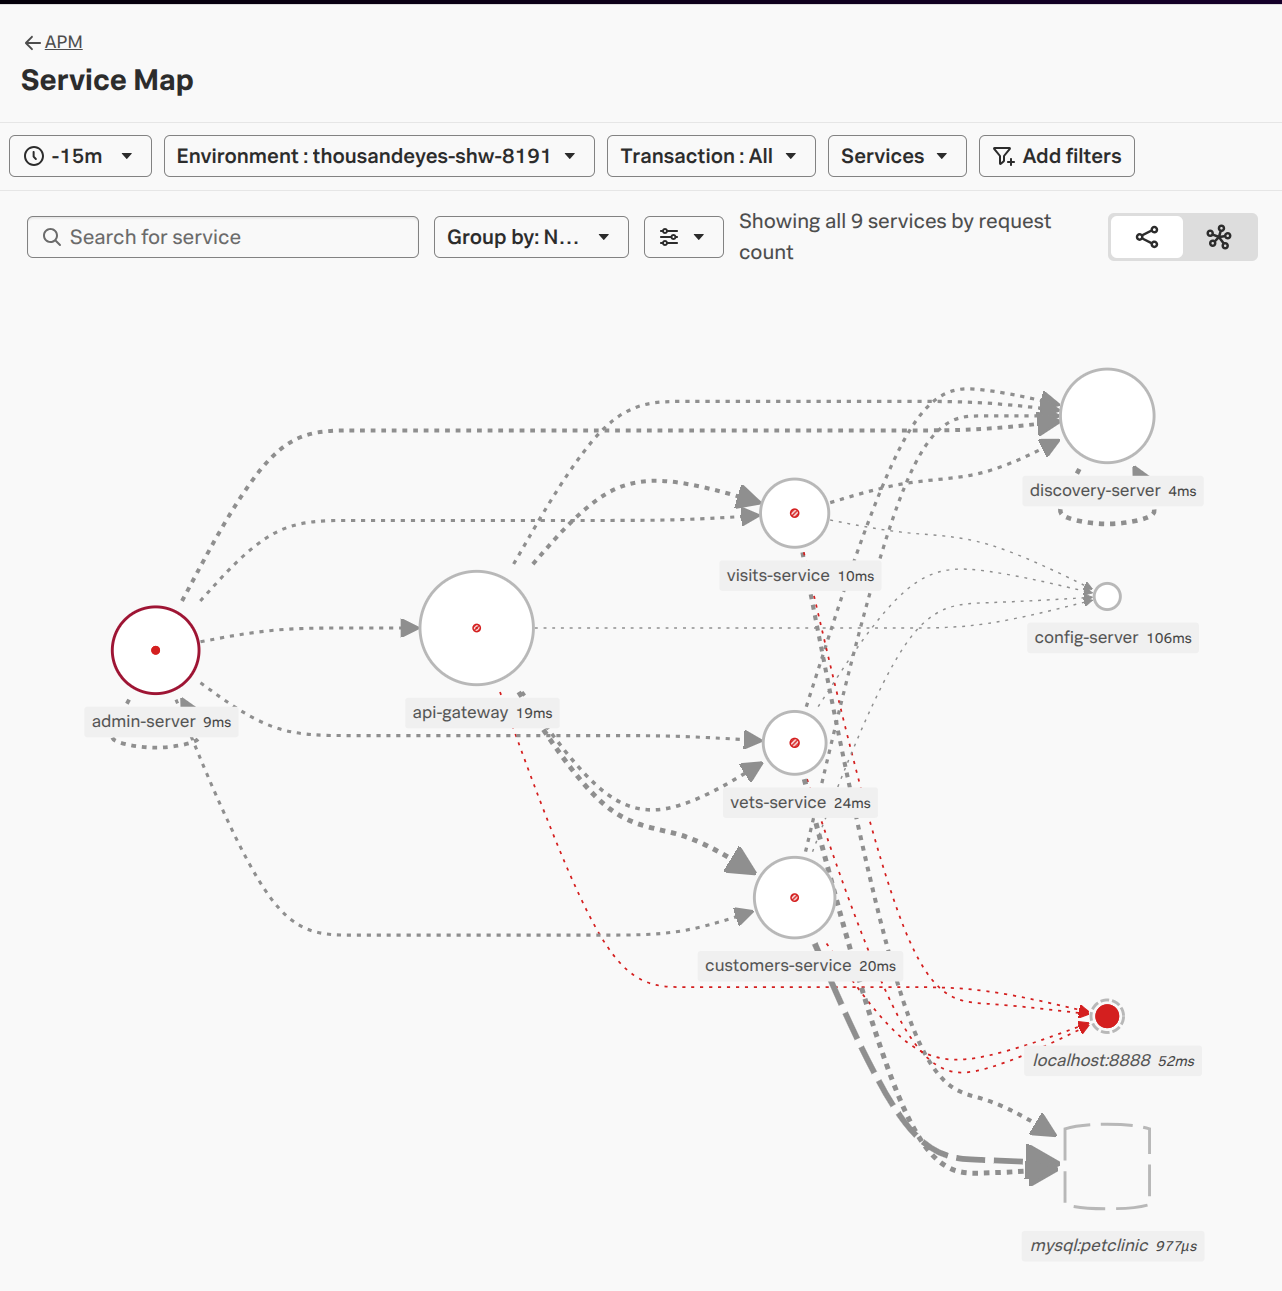
Your deployment environment is:
echo "thousandeyes-$INSTANCE"You should see the full environment showing in Splunk Observability Cloud (filter on your environment, thousandeyes-shw-xxxx)