Distributed Tracing and Bi-Directional Drilldowns
25 minutesThis section turns the ThousandEyes and Splunk integration into a true investigation workflow. In the previous section, ThousandEyes streamed synthetic metrics into Splunk Observability Cloud. In this section, you will enable the supported ThousandEyes <-> Splunk APM distributed tracing integration so network, platform, and application teams can pivot between both tools while looking at the same request.
Why This Matters
This is the piece that gives you bi-directional access between the two environments. ThousandEyes can open the related trace in Splunk APM, and Splunk APM can take you back to the originating ThousandEyes test.
What You Will Learn
By the end of this section, you will be able to:
- Instrument an internal service so it sends traces to Splunk APM
- Enable distributed tracing on a ThousandEyes HTTP Server or API test
- Configure the ThousandEyes Generic Connector for Splunk APM
- Open the ThousandEyes Service Map and jump directly into the corresponding Splunk trace
- Use the ThousandEyes metadata in Splunk APM to jump back to the original ThousandEyes test
Supported Workflow
This learning scenario follows the supported workflow documented by ThousandEyes and Splunk:
- ThousandEyes automatically injects
b3,traceparent, andtracestateheaders into HTTP Server and API tests when distributed tracing is enabled. - The monitored endpoint must accept headers, be instrumented with OpenTelemetry, propagate trace context, and send traces to your observability backend.
- For Splunk APM, ThousandEyes uses a Generic Connector that points at
https://api.<REALM>.signalfx.comand authenticates with an API-scope Splunk token. - Splunk APM enriches matching traces with ThousandEyes attributes such as
thousandeyes.test.idandthousandeyes.permalink, which enables the reverse jump back to ThousandEyes.
What Those Headers Actually Mean
This part is easy to gloss over and it should not be. The trace correlation only works if the service understands the headers ThousandEyes injects and continues the trace correctly.
traceparentandtracestateare the W3C Trace Context headers.b3is the Zipkin B3 single-header format.- ThousandEyes injects both because real environments often contain a mix of proxies, meshes, gateways, and app runtimes that do not all prefer the same propagation format.
In OpenTelemetry terms, the important setting is the propagator list:
That does two things:
- It allows the service to extract either B3 or W3C context from the inbound ThousandEyes request.
- It preserves the W3C
tracestateby keepingtracecontextenabled.
Important Detail
You do not add tracestate as a separate OpenTelemetry propagator. The tracecontext propagator handles both traceparent and tracestate.
What “Properly Done” Looks Like
The collector is only one part of this setup. A correct ThousandEyes tracing deployment in Kubernetes has three layers:
- Deployment annotation so the OpenTelemetry Operator injects the runtime-specific instrumentation.
- Instrumentation resource so the injected SDK knows where to send traces and which propagators to use.
- Collector trace pipeline so OTLP traces are actually received and exported to Splunk APM.
The most common mistake is to focus only on the collector. The collector never sees raw b3, traceparent, or tracestate request headers directly. Your application or auto-instrumentation library must extract those headers first, continue the span context, and then emit spans over OTLP to the collector.
Real-World Configuration From The Current Cluster
The examples below are trimmed from the live cluster currently running this workshop. They show the pattern that is actually working in Kubernetes today.
1. Deployment Annotation
In the live cluster, the teastore applications point at the teastore/default Instrumentation resource:
This is the first place to verify when ThousandEyes requests are not turning into traces.
2. Instrumentation Resource
This is the live Instrumentation object from teastore, trimmed to the fields that matter for ThousandEyes:
This is the critical part for the ThousandEyes scenario:
endpointsends spans to the cluster-local OTel agent service.b3allows extraction of ThousandEyes B3 headers.tracecontextpreservestraceparentandtracestate.parentbased_always_onensures the trace continues once ThousandEyes starts the request.
3. What The Injected Pod Actually Gets
On the running teastore-webui-v1 pod, the operator injected the following environment variables:
This is a useful validation checkpoint because it proves the propagators are being applied to the workload, not just declared in an abstract config object.
4. Agent Collector Trace Pipeline
The live agent collector in otel-splunk is receiving OTLP, Jaeger, and Zipkin traffic and forwarding traces upstream. This is a trimmed excerpt from the running ConfigMap:
For ThousandEyes, the important part is not a special B3 option in the collector. The important part is simply that the collector exposes OTLP on 4317 and 4318, and that your services are exporting their spans there.
5. Gateway Collector Export To Splunk APM
The live gateway collector then forwards traces to Splunk Observability Cloud. This is the relevant part of the running gateway ConfigMap:
This is the part that gets the spans to Splunk APM. If this pipeline is broken, ThousandEyes can still inject headers into the request, but no correlated trace will ever appear in Splunk.
Current Cluster Takeaway
In the live cluster, the teastore/default Instrumentation resource is the pattern to follow for ThousandEyes because it explicitly includes b3 together with tracecontext. That is the configuration you want to replicate for this scenario.
Important
Do not use a browser page URL for this section. ThousandEyes documents that browsers do not accept the custom trace headers required for this workflow. Use an instrumented backend endpoint behind an HTTP Server or API test instead.
Step 1: Make Sure the Workload Emits Traces to Splunk APM
If your application is already instrumented and traces are visible in Splunk APM, you can skip to Step 2. Otherwise, the fastest learning path in Kubernetes is to use the Splunk OpenTelemetry Collector with the Operator enabled for zero-code instrumentation.
Install the Splunk OpenTelemetry Collector with the Operator
Annotate the Deployment for Auto-Instrumentation
For Java workloads, a generic example looks like this:
For other runtimes, use the annotation that matches the language:
instrumentation.opentelemetry.io/inject-nodejsinstrumentation.opentelemetry.io/inject-pythoninstrumentation.opentelemetry.io/inject-dotnet
If the collector is installed in the same namespace as the application, the official Splunk documentation also supports using "true" as the annotation value.
If you want to follow the live cluster pattern from this workshop environment, the annotation value is namespace-qualified and points at the teastore/default Instrumentation object:
Validate That Traces Exist
Wait for the deployment rollout to finish:
Generate a few requests against a backend endpoint that crosses more than one service, for example:
In the current workshop cluster, a service such as
http://teastore-webui.teastore.svc.cluster.local:8080/is the right kind of target because it fronts several downstream application services and produces a more useful end-to-end trace than a simple health check.Confirm that traces are arriving in Splunk APM before you continue.
Learning Tip
Use a business transaction, not a pure /health endpoint, for the tracing exercise. A multi-service request gives you a far better Service Map in ThousandEyes and a more useful trace in Splunk APM.
Step 2: Enable Distributed Tracing on the ThousandEyes Test
Create or edit an HTTP Server or API test that targets the instrumented backend endpoint from Step 1.
- In ThousandEyes, create an HTTP Server or API test.
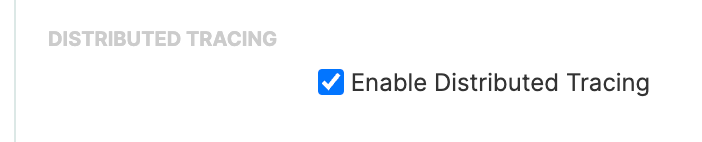
- Open Advanced Settings.
- Enable Distributed Tracing.
- Save the test and run it against the same endpoint that is already sending traces to Splunk APM.
After the test runs, ThousandEyes injects the trace headers and captures the trace context for that request.
Step 3: Create the Splunk APM Connector in ThousandEyes
The metric streaming integration from the previous section uses an Ingest token. This step is different: ThousandEyes needs to query Splunk APM and build trace links, so it uses a Splunk API token instead.
- In Splunk Observability Cloud, create an access token with the API scope.
- In ThousandEyes, go to Manage > Integrations > Integrations 2.0.
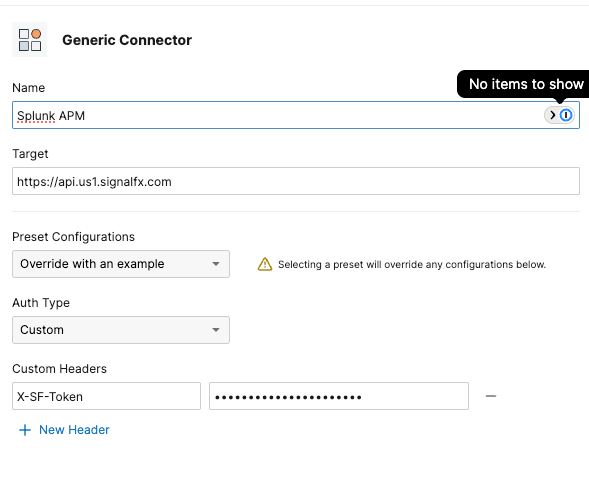
- Create a Generic Connector with:
- Target URL:
https://api.<REALM>.signalfx.com - Header:
X-SF-Token: <your-api-scope-token>
- Target URL:
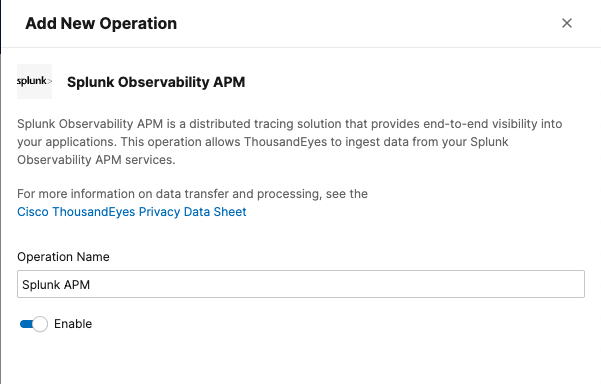
- Create a new Operation and select Splunk Observability APM.
- Enable the operation and save the integration.
Step 4: Validate the Bi-Directional Investigation Loop
Once the test is running and the connector is enabled, validate the workflow in both directions.
Start in ThousandEyes
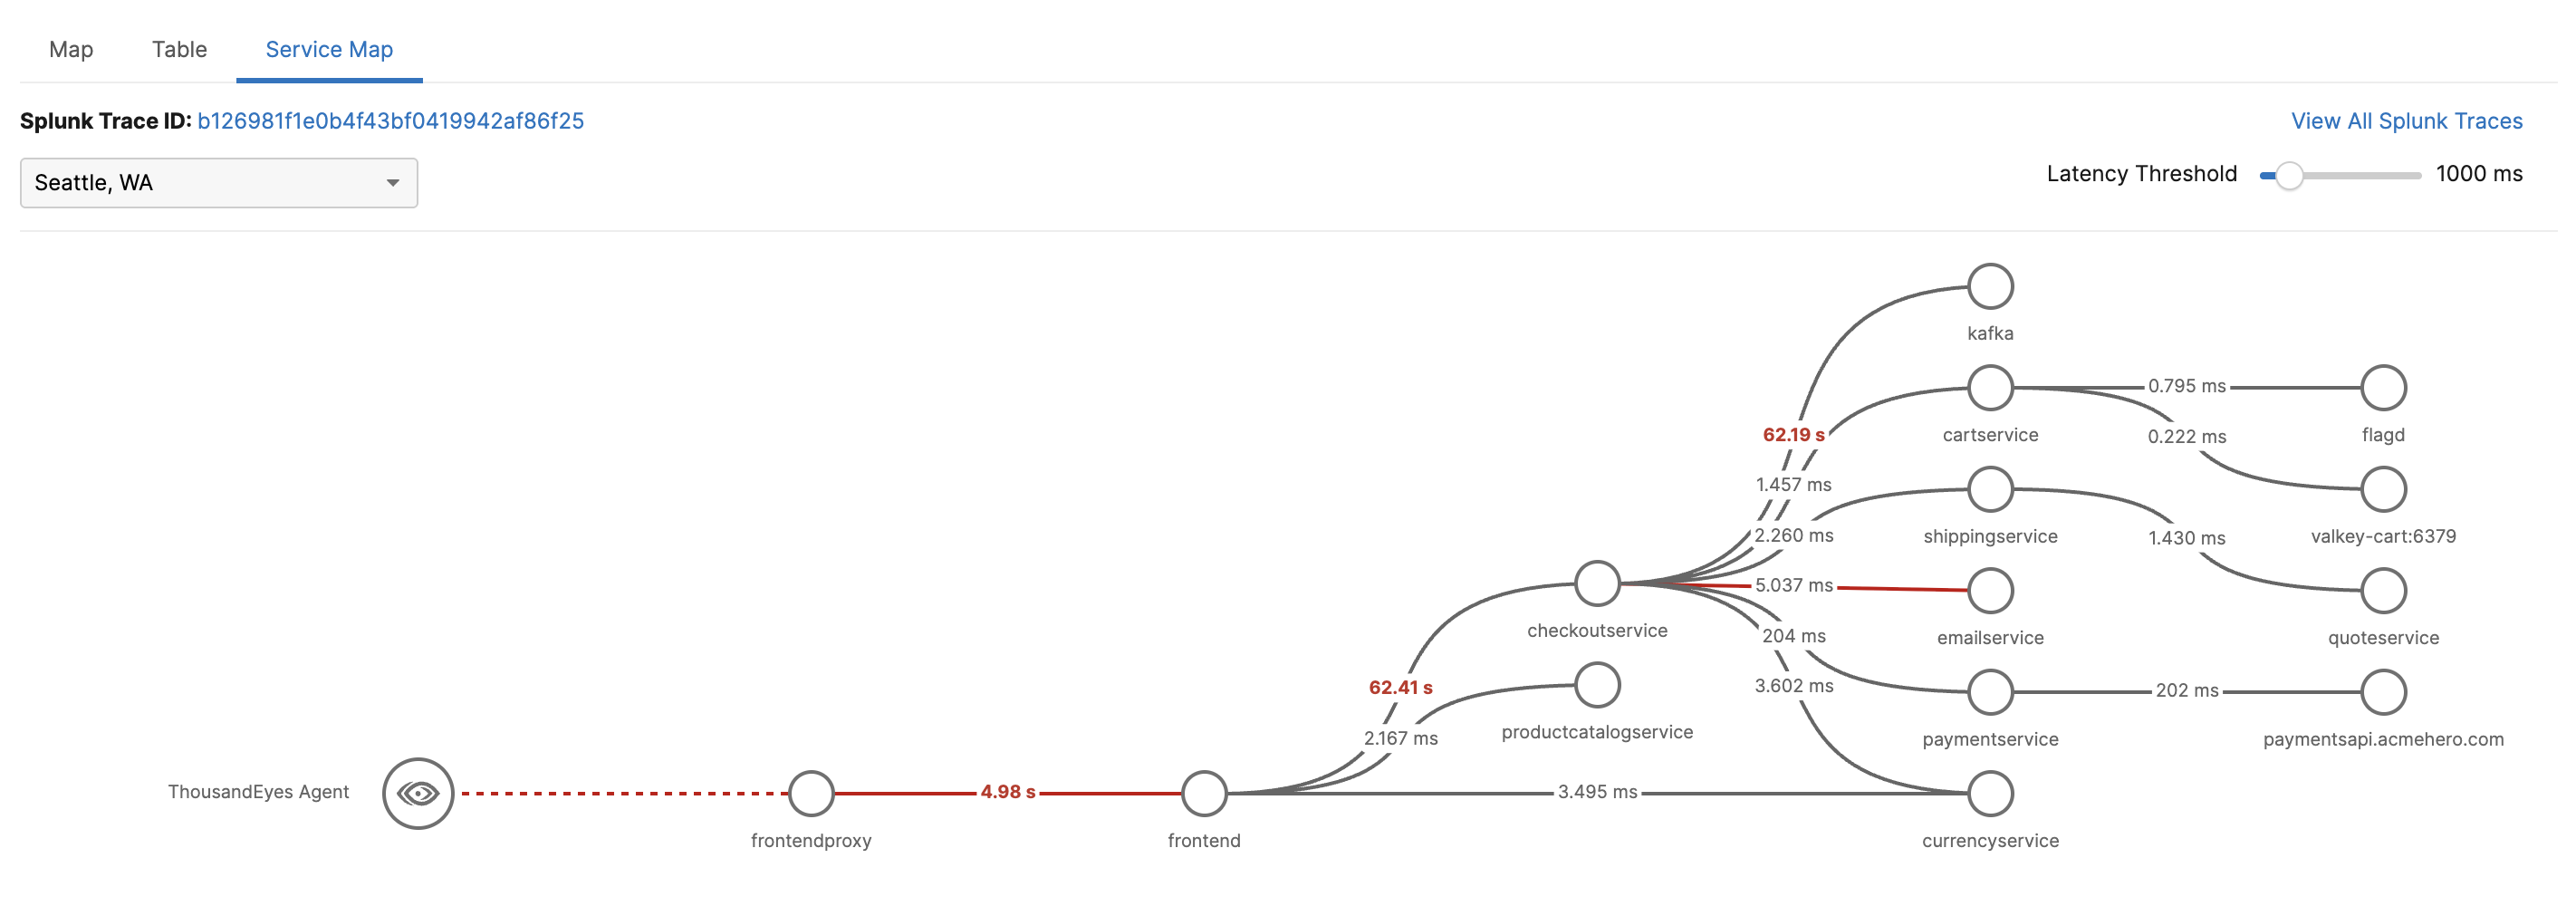
- Open the test in ThousandEyes.
- Navigate to the Service Map tab.
- Confirm that you can see the trace path, service latency, and any downstream errors.
- Use the ThousandEyes link into Splunk APM to inspect the full trace.
Continue in Splunk APM
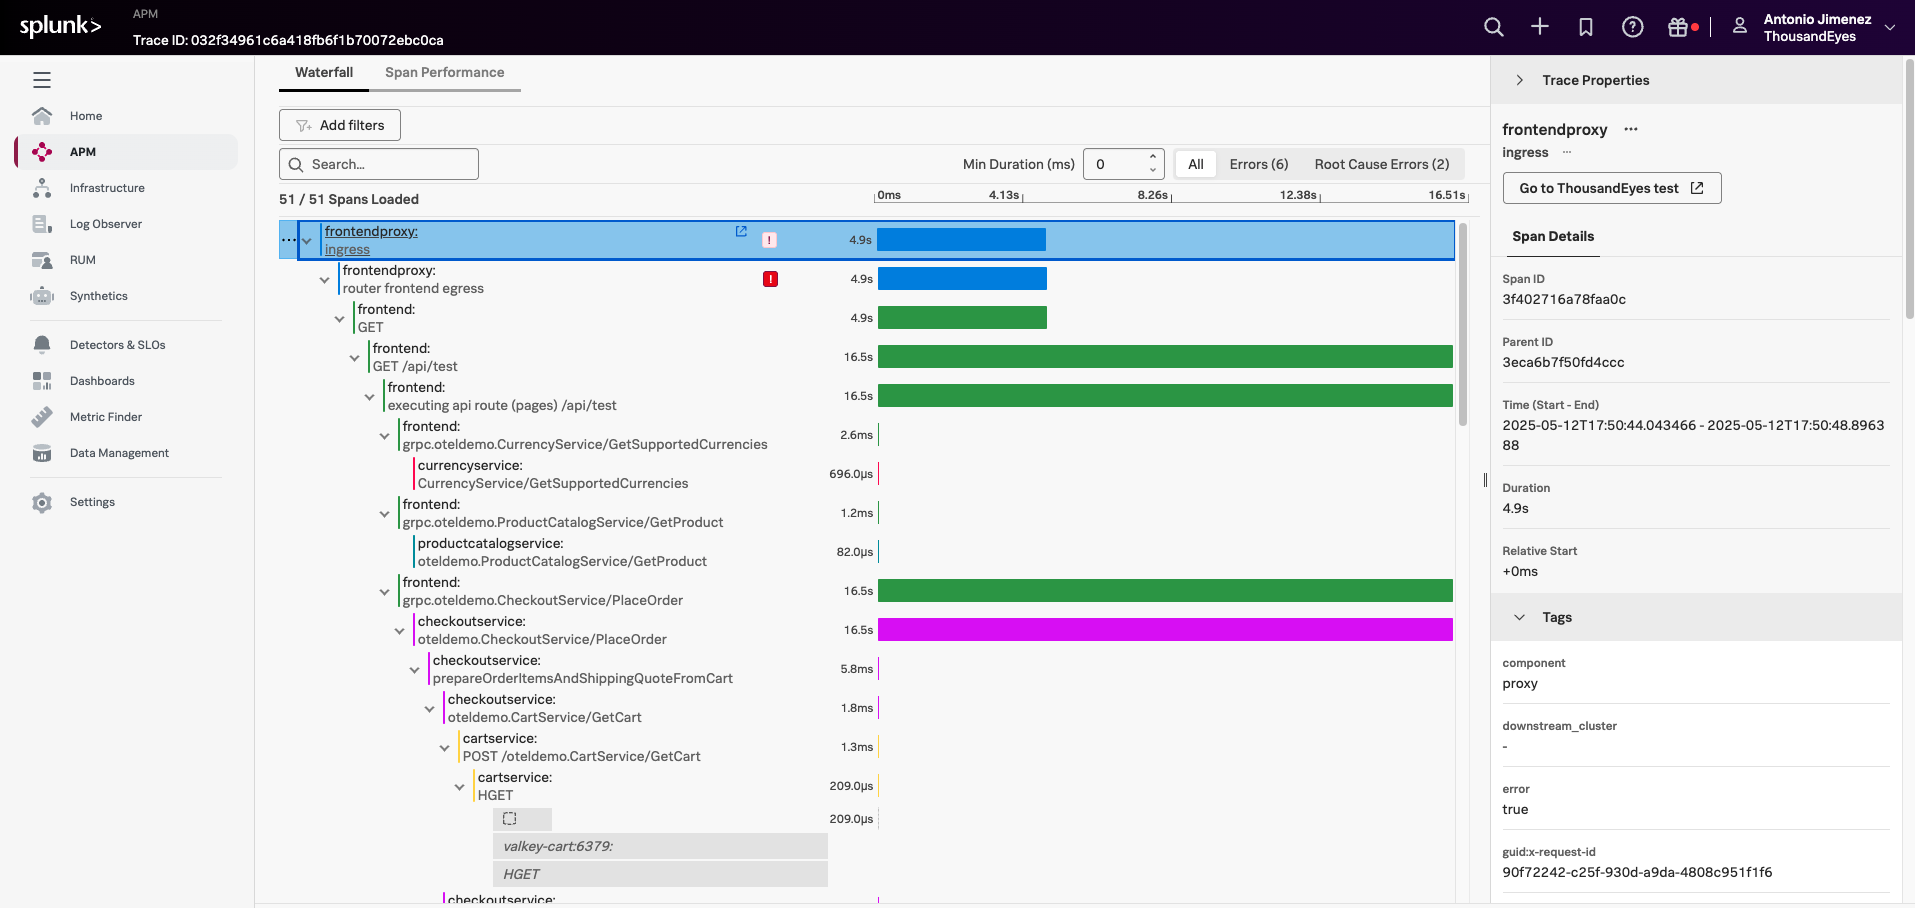
Inside Splunk APM, verify that the trace contains ThousandEyes metadata such as:
thousandeyes.account.idthousandeyes.test.idthousandeyes.permalinkthousandeyes.source.agent.id
Use either the thousandeyes.permalink field or the Go to ThousandEyes test button in the trace waterfall view to navigate back to the originating ThousandEyes test.
Suggested Learning Scenario
Use the following flow during a workshop:
- Create a ThousandEyes test against an internal API route that calls multiple services.
- Let ThousandEyes surface the issue first, so the class starts from the network and synthetic-monitoring perspective.
- Open the Service Map in ThousandEyes and identify where latency or errors begin.
- Jump into Splunk APM for span-level analysis.
- Jump back to ThousandEyes to inspect the test, agent, and network path again.
This is a strong teaching loop because it mirrors how different teams actually work:
- Network and edge teams often start in ThousandEyes.
- SRE and platform teams often start in Splunk dashboards or alerts.
- Application teams usually want the trace in Splunk APM.
With this integration in place, everyone can pivot without losing context.
Common Pitfalls
- A test might be visible in Splunk dashboards but still have no trace correlation. That usually means only the metrics stream is configured, not the Splunk APM Generic Connector.
- A trace might exist in Splunk APM but not show up in ThousandEyes if the monitored endpoint does not propagate the trace headers downstream.
- A shallow endpoint such as
/healthoften produces limited trace value even when the configuration is correct.