Splunk APM
5. APM Trace Analyzer
As Splunk APM provides a NoSample end-to-end visibility of every service Splunk APM captures every trace. For this workshop, the wire transfer orderId is available as a tag. This means that we can use this to search for the exact trace of the poor user experience encountered by users.
Trace Analyzer
Exercise
- With the outer box of the wire-transfer-service selected, in the right-hand pane, click on Traces.
- Set Time Range to Last 15 minutes.
- Ensure the Sample Ratio is set to
1:1and not1:10.
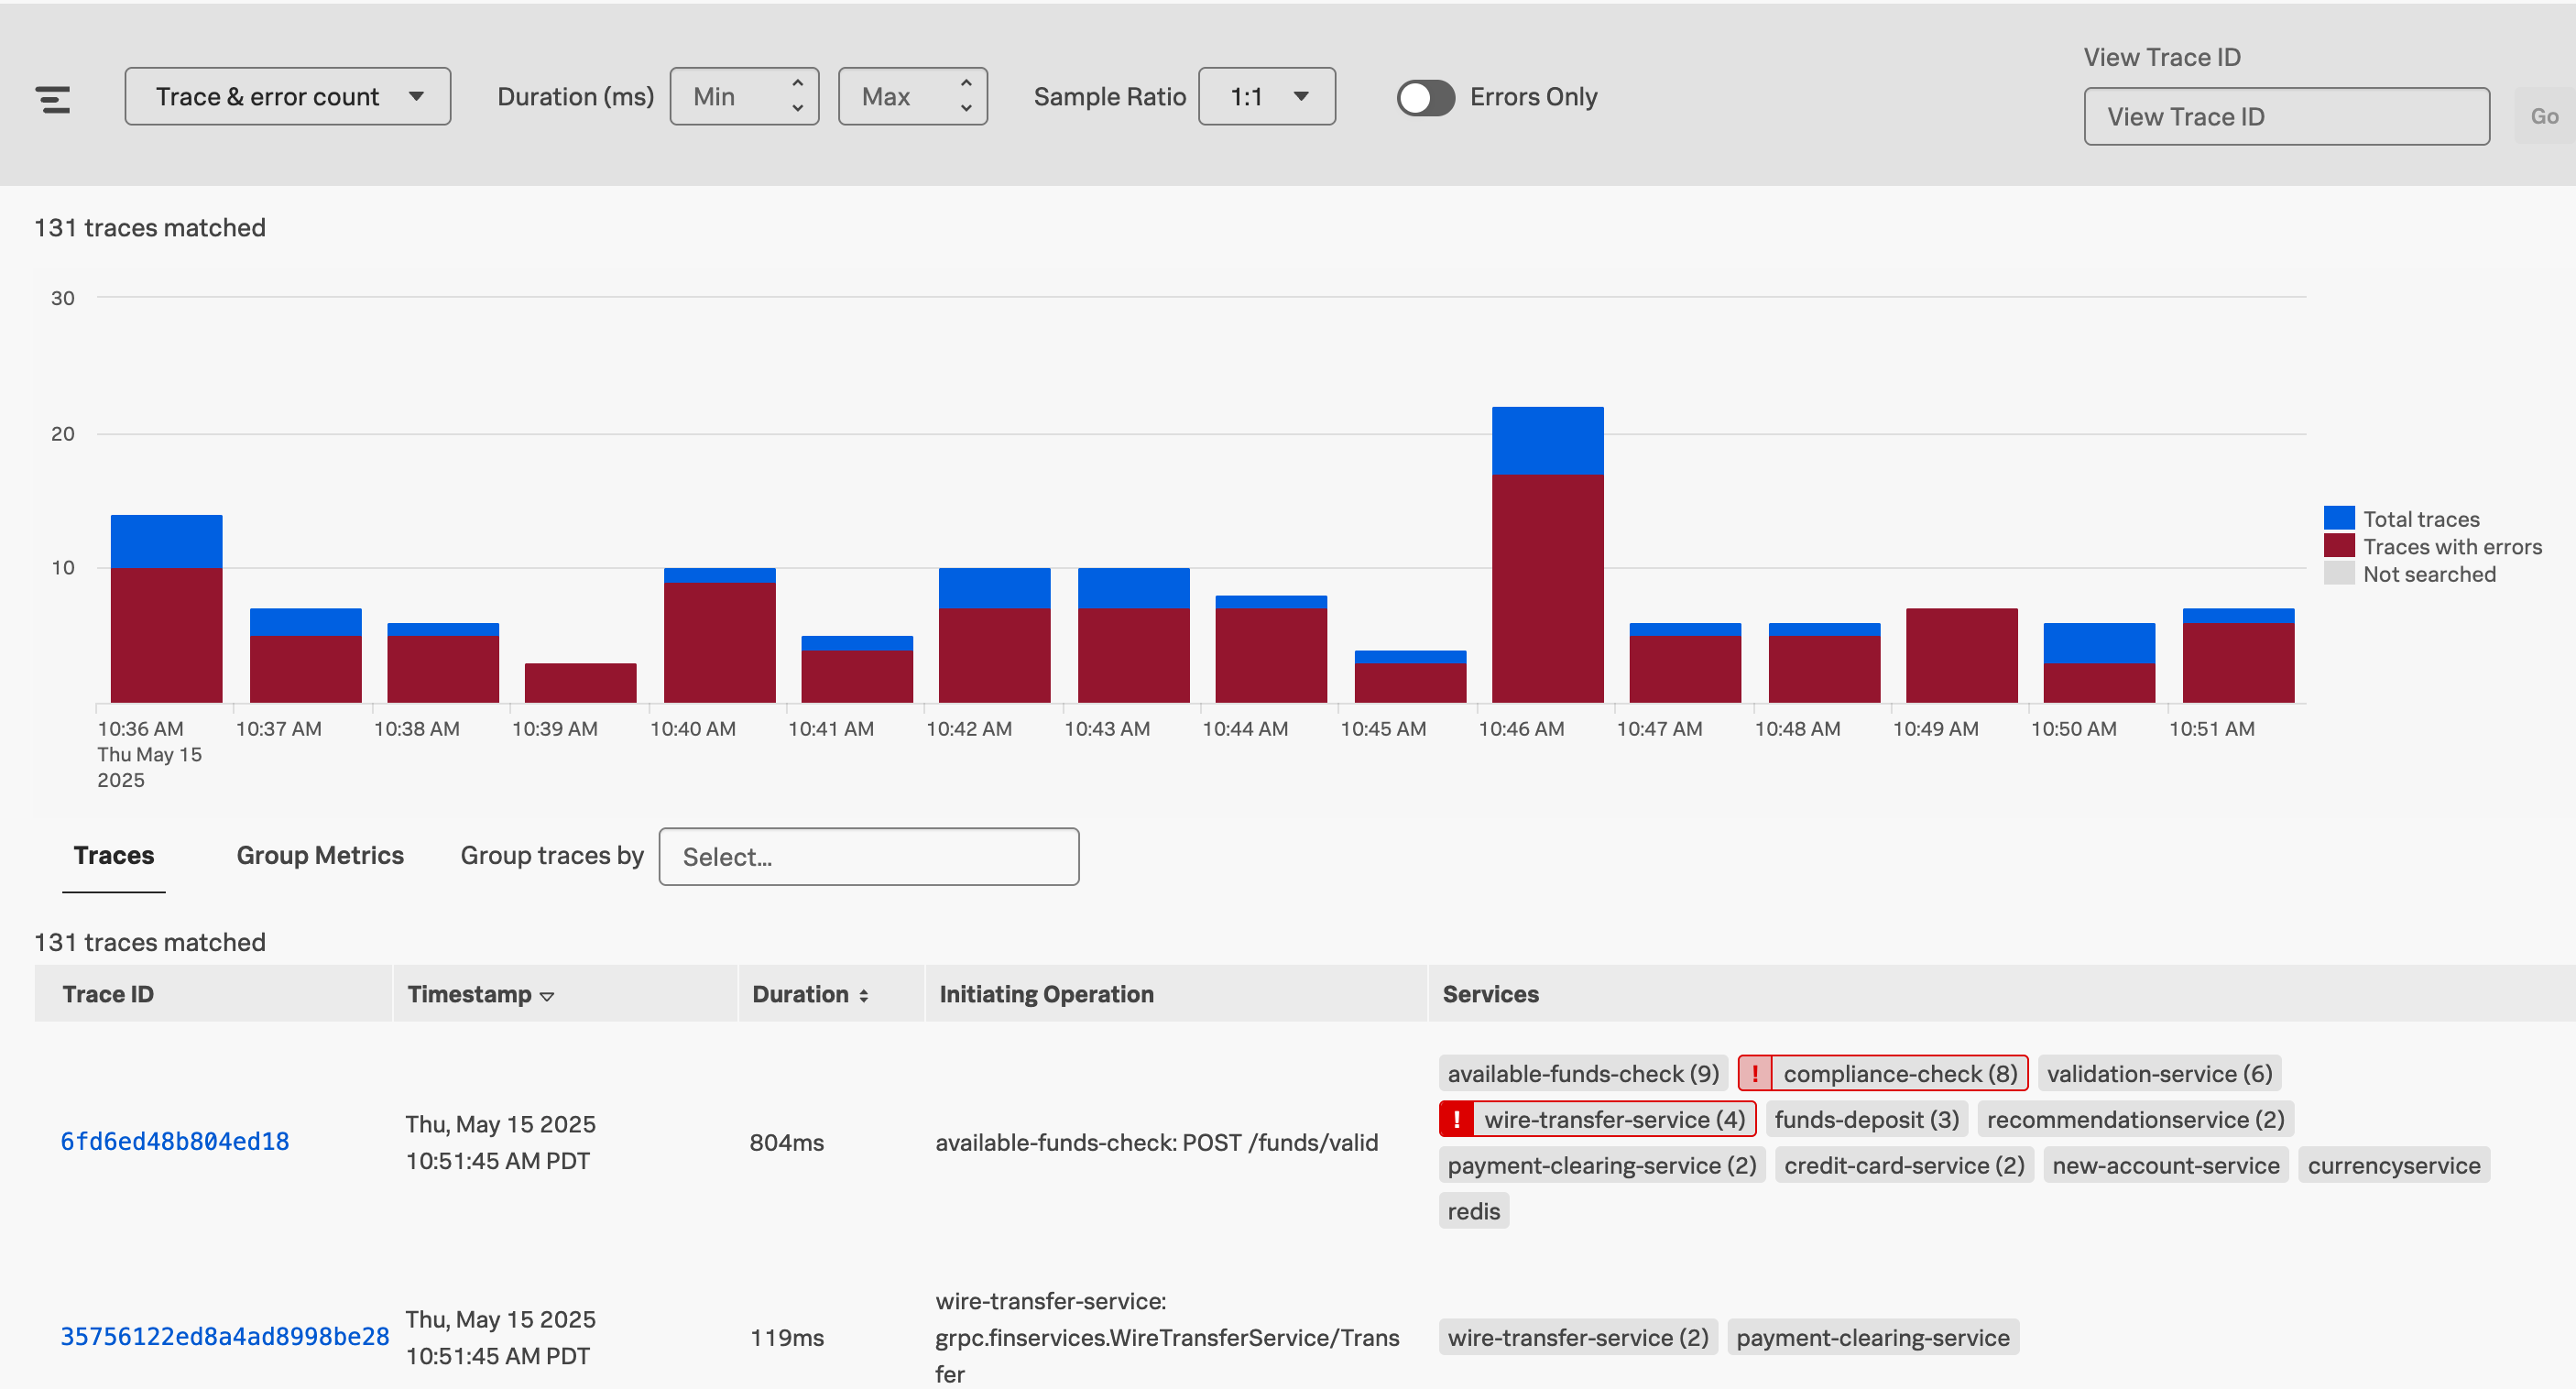
The Trace & error count view shows the total traces and traces with errors in a stacked bar chart. You can use your mouse to select a specific period within the available time frame.
Exercise
- Click on the dropdown menu that says Trace & error count, and change it to Trace duration
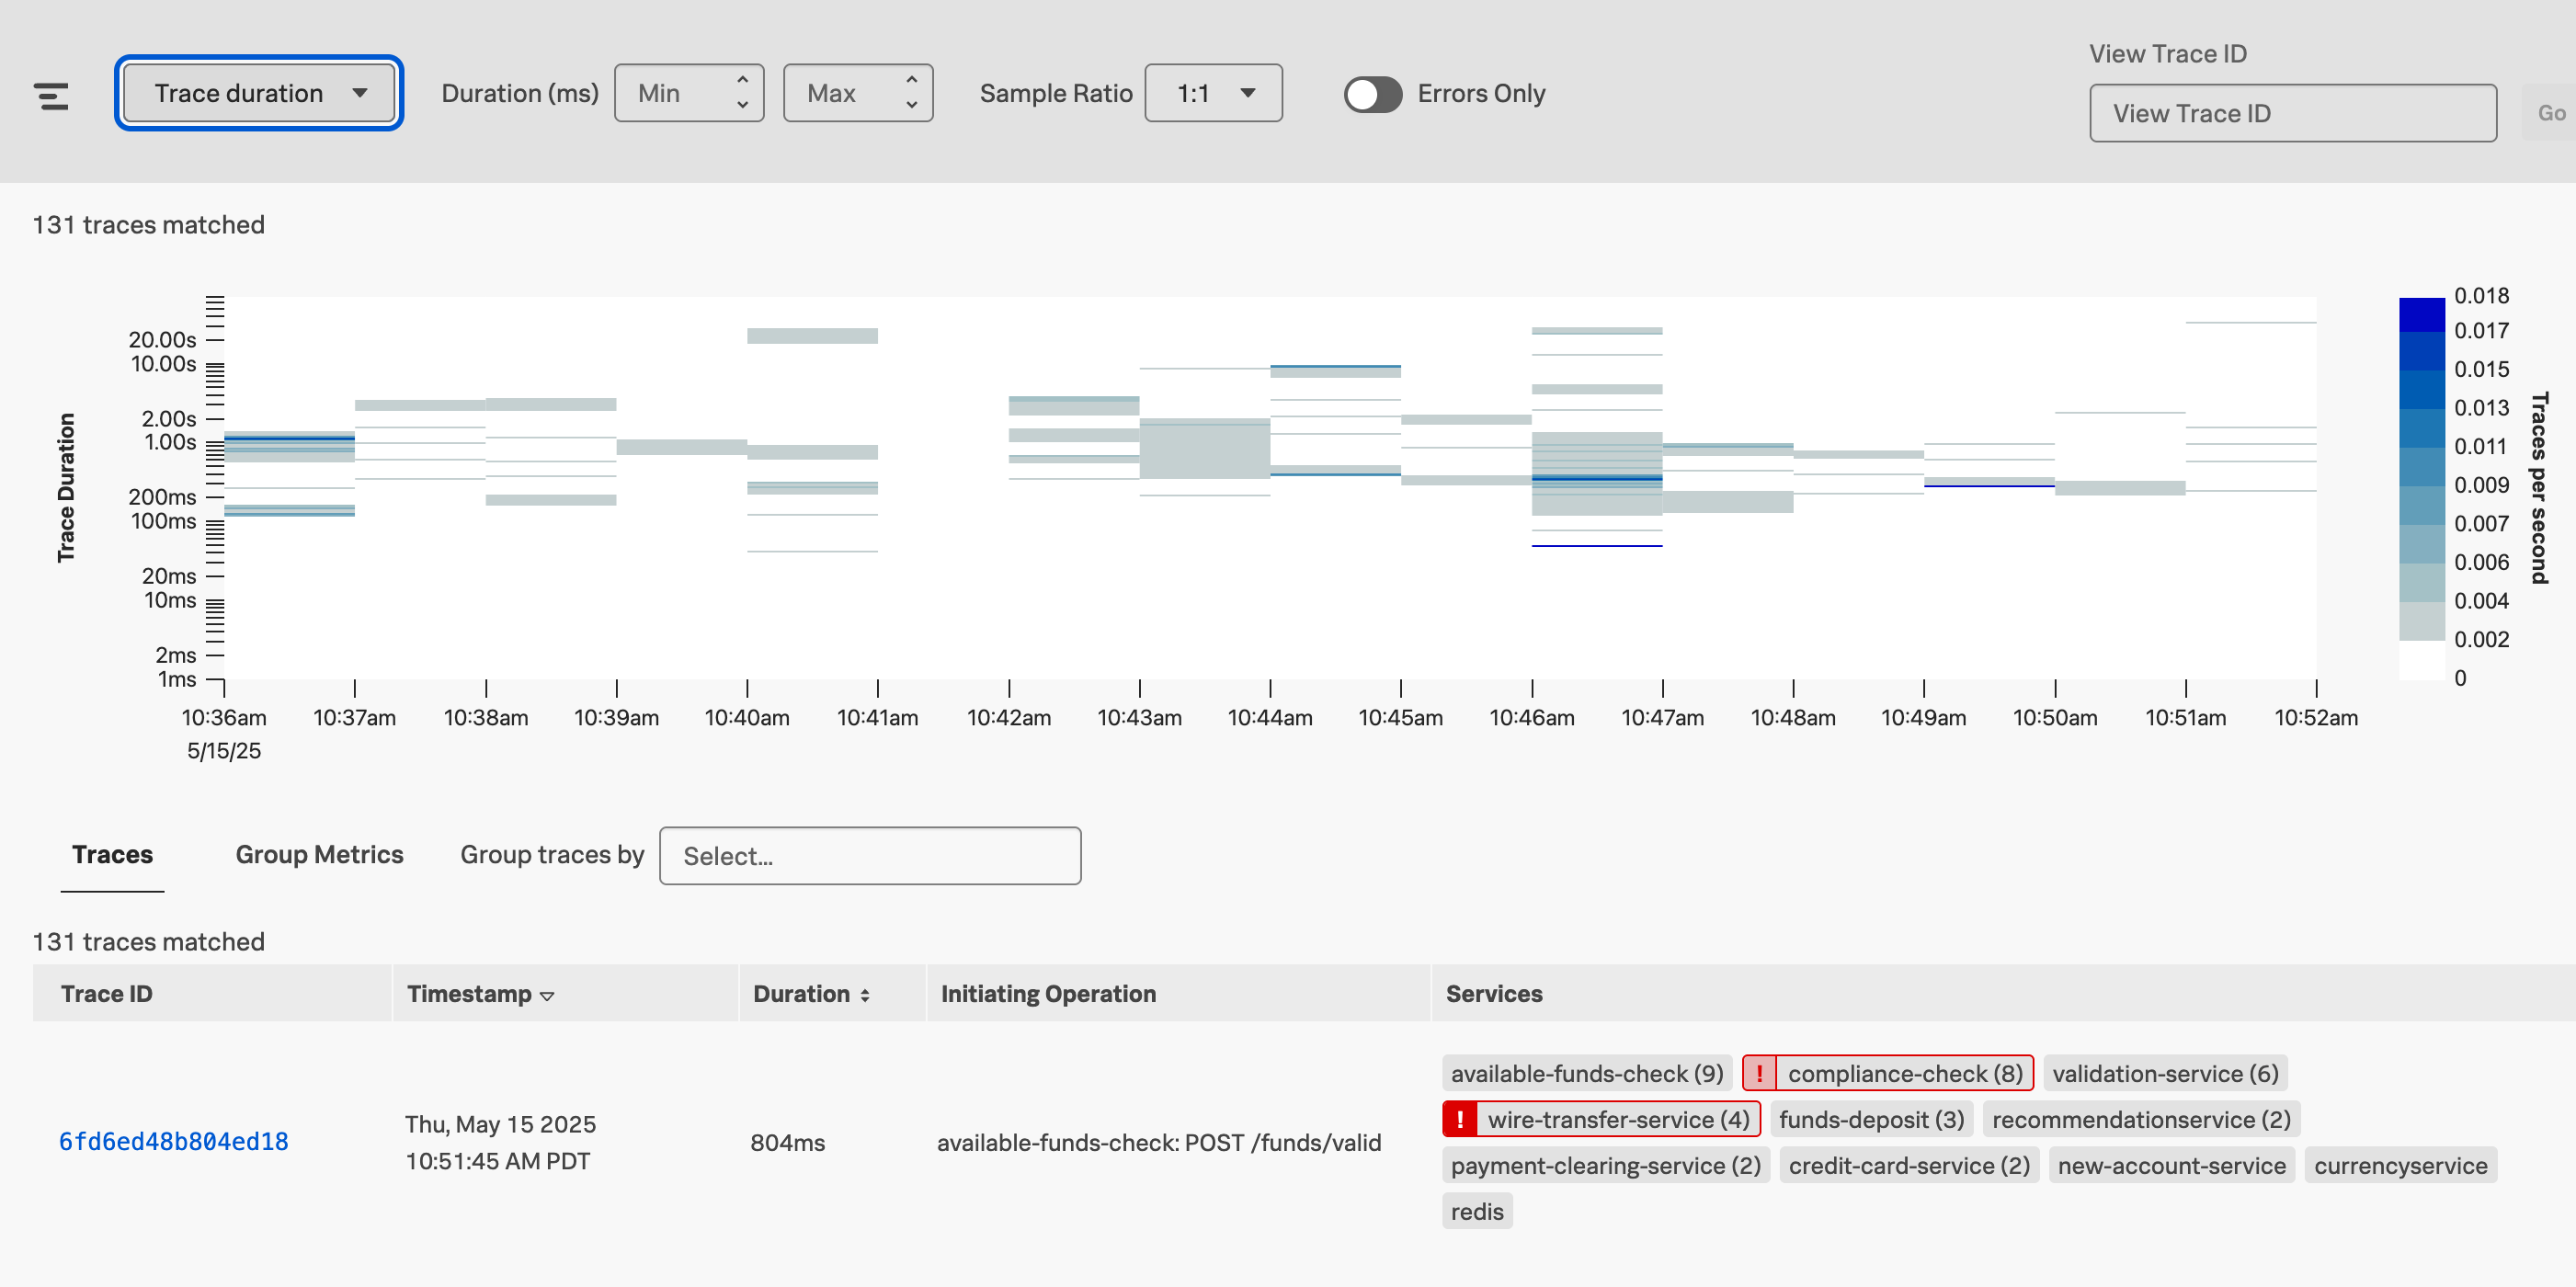
The Trace Duration view shows a heatmap of traces by duration. The heatmap represents 3 dimensions of data:
- Time on the x-axis
- Trace duration on the y-axis
- The traces (or requests) per second are represented by the heatmap shades
You can use your mouse to select an area on the heatmap, to focus on a specific time period and trace duration range.
Exercise
- Switch from Trace duration back to Trace & Error count.
- In the time picker select Last 1 hour.
- Note, that most of our traces have errors (red) and there are only a limited amount of traces that are error-free (blue).
- Make sure the Sample Ratio is set to
1:1and not1:10. - Click on Add filters, type in
orderIdand select orderId from the list. - Find and select the orderId provided by your workshop leader and hit enter.
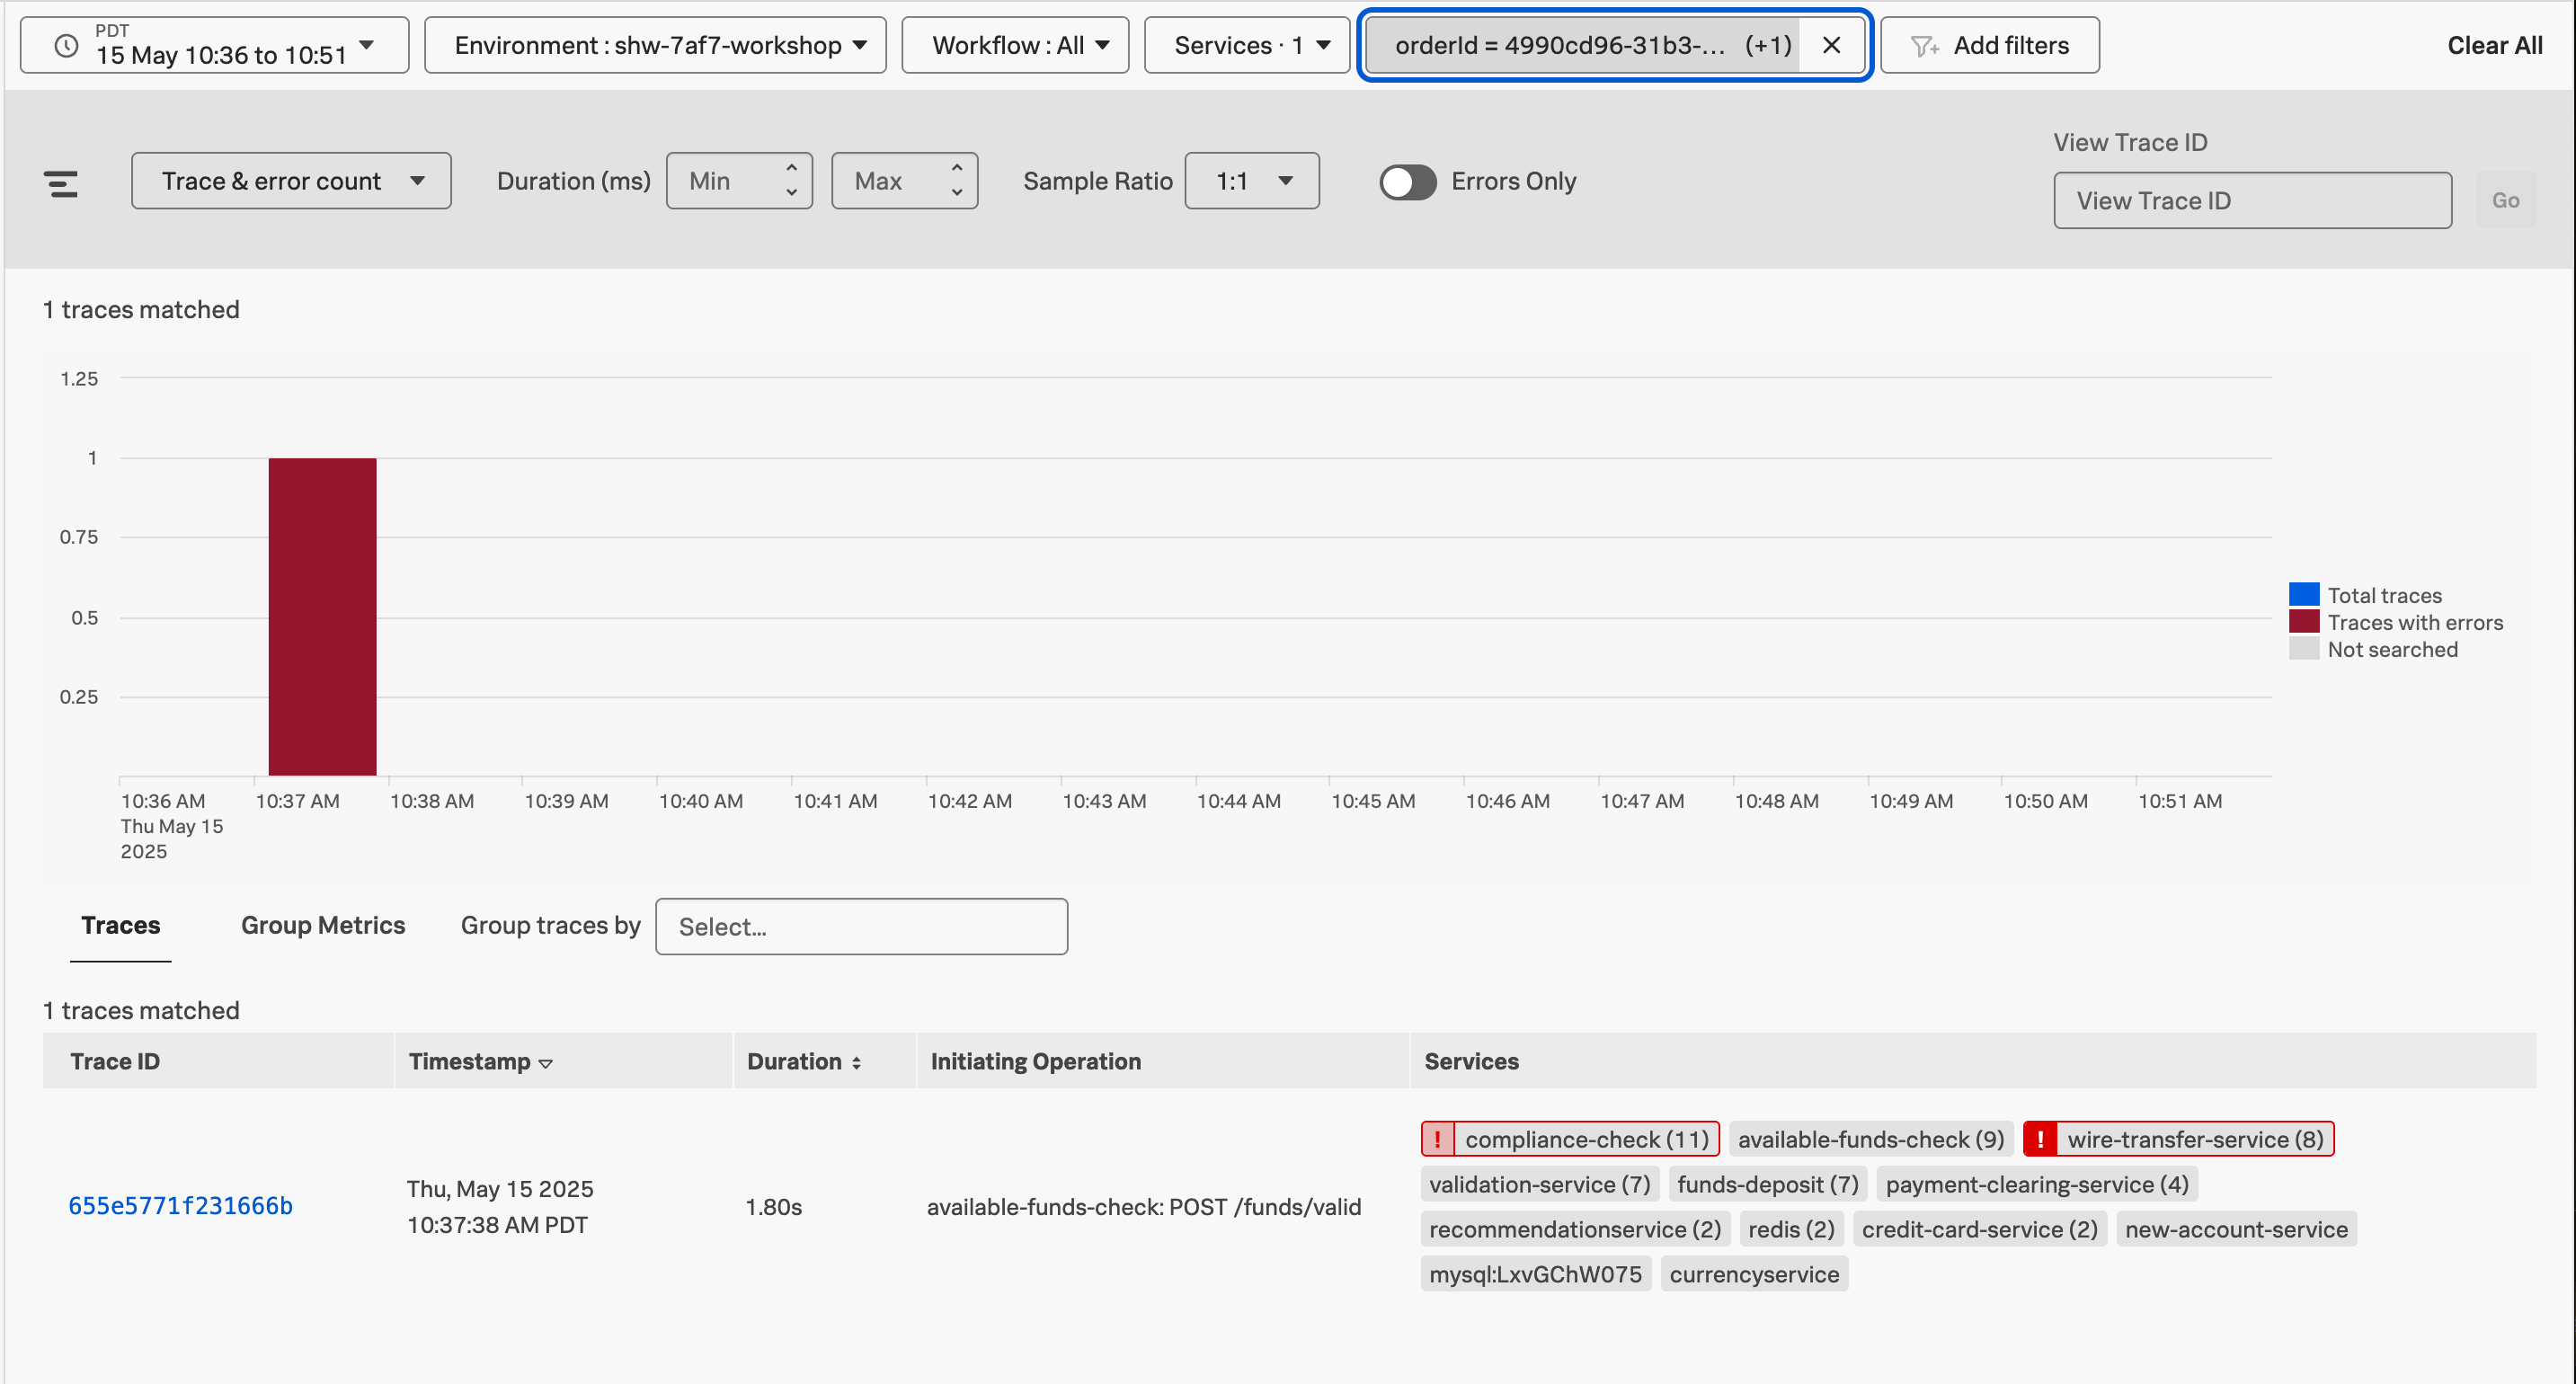
We have now filtered down to the exact trace where users reported a poor experience with a very long processing wait.
A secondary benefit to viewing this trace is that the trace will be accessible for up to 13 months. This will allow developers to come back to this issue at a later stage and still view this trace for example.
Exercise
- Click on the trace in the list.
Next, we will walk through the trace waterfall.