Digital Experience (RUM)
RUM Overview
In this exercise, you’ll open the RUM Overview dashboard. The data you’ll see here was generated and also includes data from all the attendee’s including yourself — it captures the browsing and shopping everyone did in the Astronomy Shop earlier, now surfaced as real user metrics like page views, errors, and load performance. This is your chance to see your own session through the lens of Real User Monitoring.
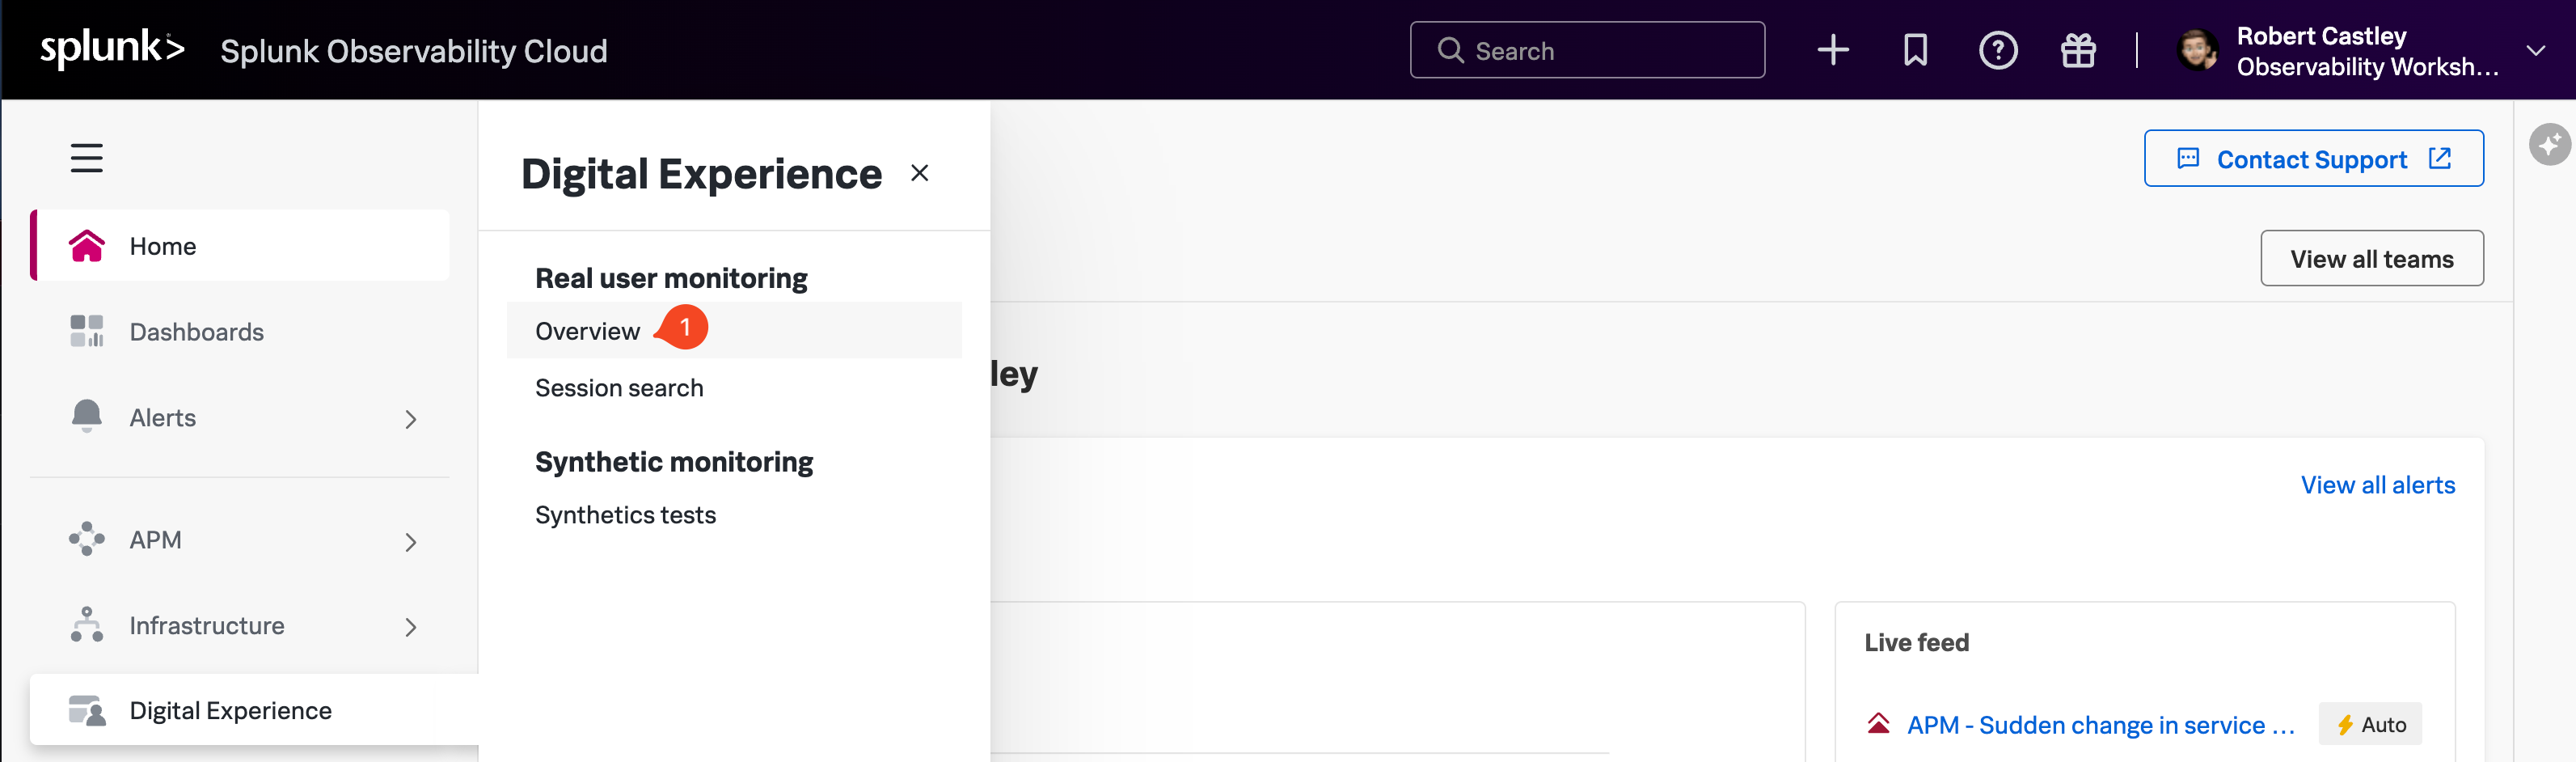
- In Splunk Observability Cloud, from the main menu, hover over Digital Experience, then click on Overview (1) from the Real User Monitoring section as shown below.
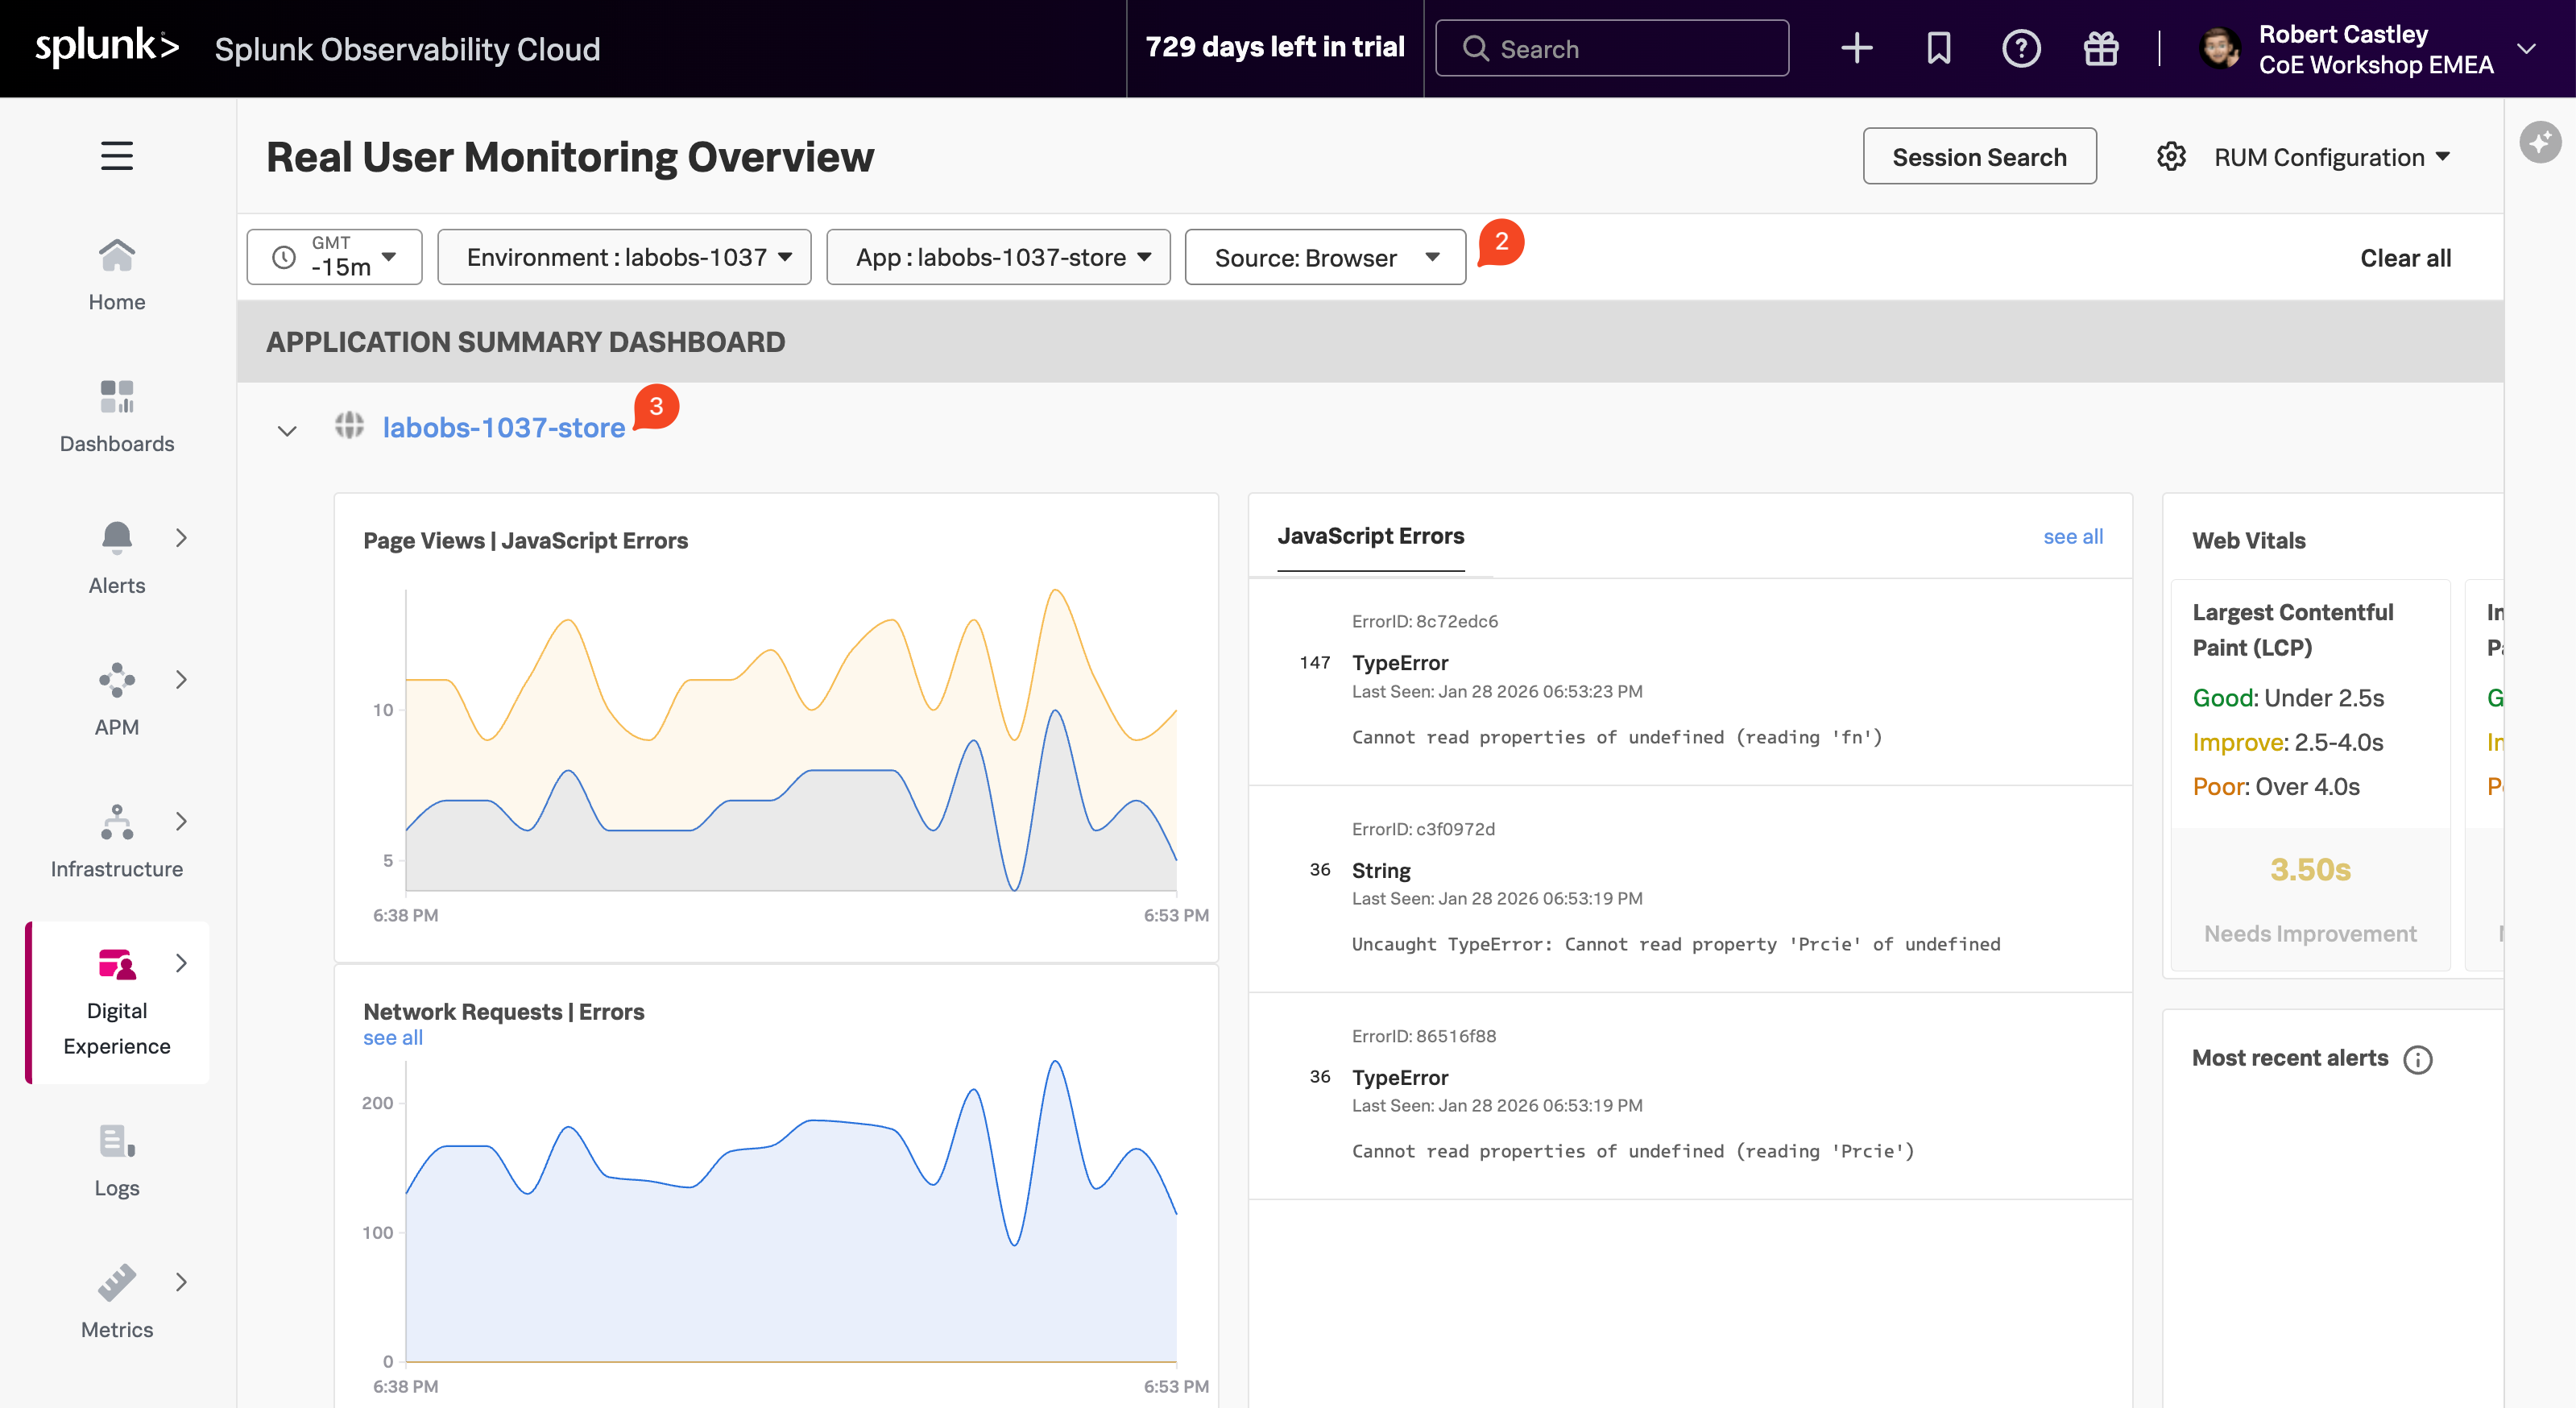
This opens the Application Summary Dashboard, which provides a quick overview of all monitored applications.
The Real User Monitoring (RUM) Overview dashboard in Splunk Observability Cloud shows how real users experience your web applications. It captures browser-side performance metrics, JavaScript errors, and failed network requests from actual user sessions. The dashboard also displays Core Web Vitals—LCP, INP, and CLS—along with error trends and recent alerts. These insights help frontend teams identify and resolve issues affecting the end-user experience.
Tip
To ensure that you are viewing the correct data, filter the dashboard to show only your workshop environment. The remainder of this module will focus on your own store.
Please set the filter to the following: (2):
- The Time frame is set to -15m.
- The Environment selected is [NAME OF WORKSHOP]-workshop.
- The App selected is [NAME OF WORKSHOP]-store.
- The Source is set to Browser.
Next, click on the [NAME OF WORKSHOP]-store (3) above the Page Views / JavaScript Errors chart.