

Application Security
Investigating Attacks
Why Runtime Attacks Change the Conversation #
Periodic scanning only tells you what could be wrong at a given point in time.
Splunk’s Runtime attack detection tells you what is happening in real-time - exploit attempts against known weaknesses, with forensic context. This allows for immediate investigation and mitigation with the correlates attack telemetry to vulnerabilities already cataloged, Keeping SOC-style investigations inside Observability Cloud.
Accessing Attack Data #
“Shift from periodic scanning to runtime-aware threat detection.”
Exercise
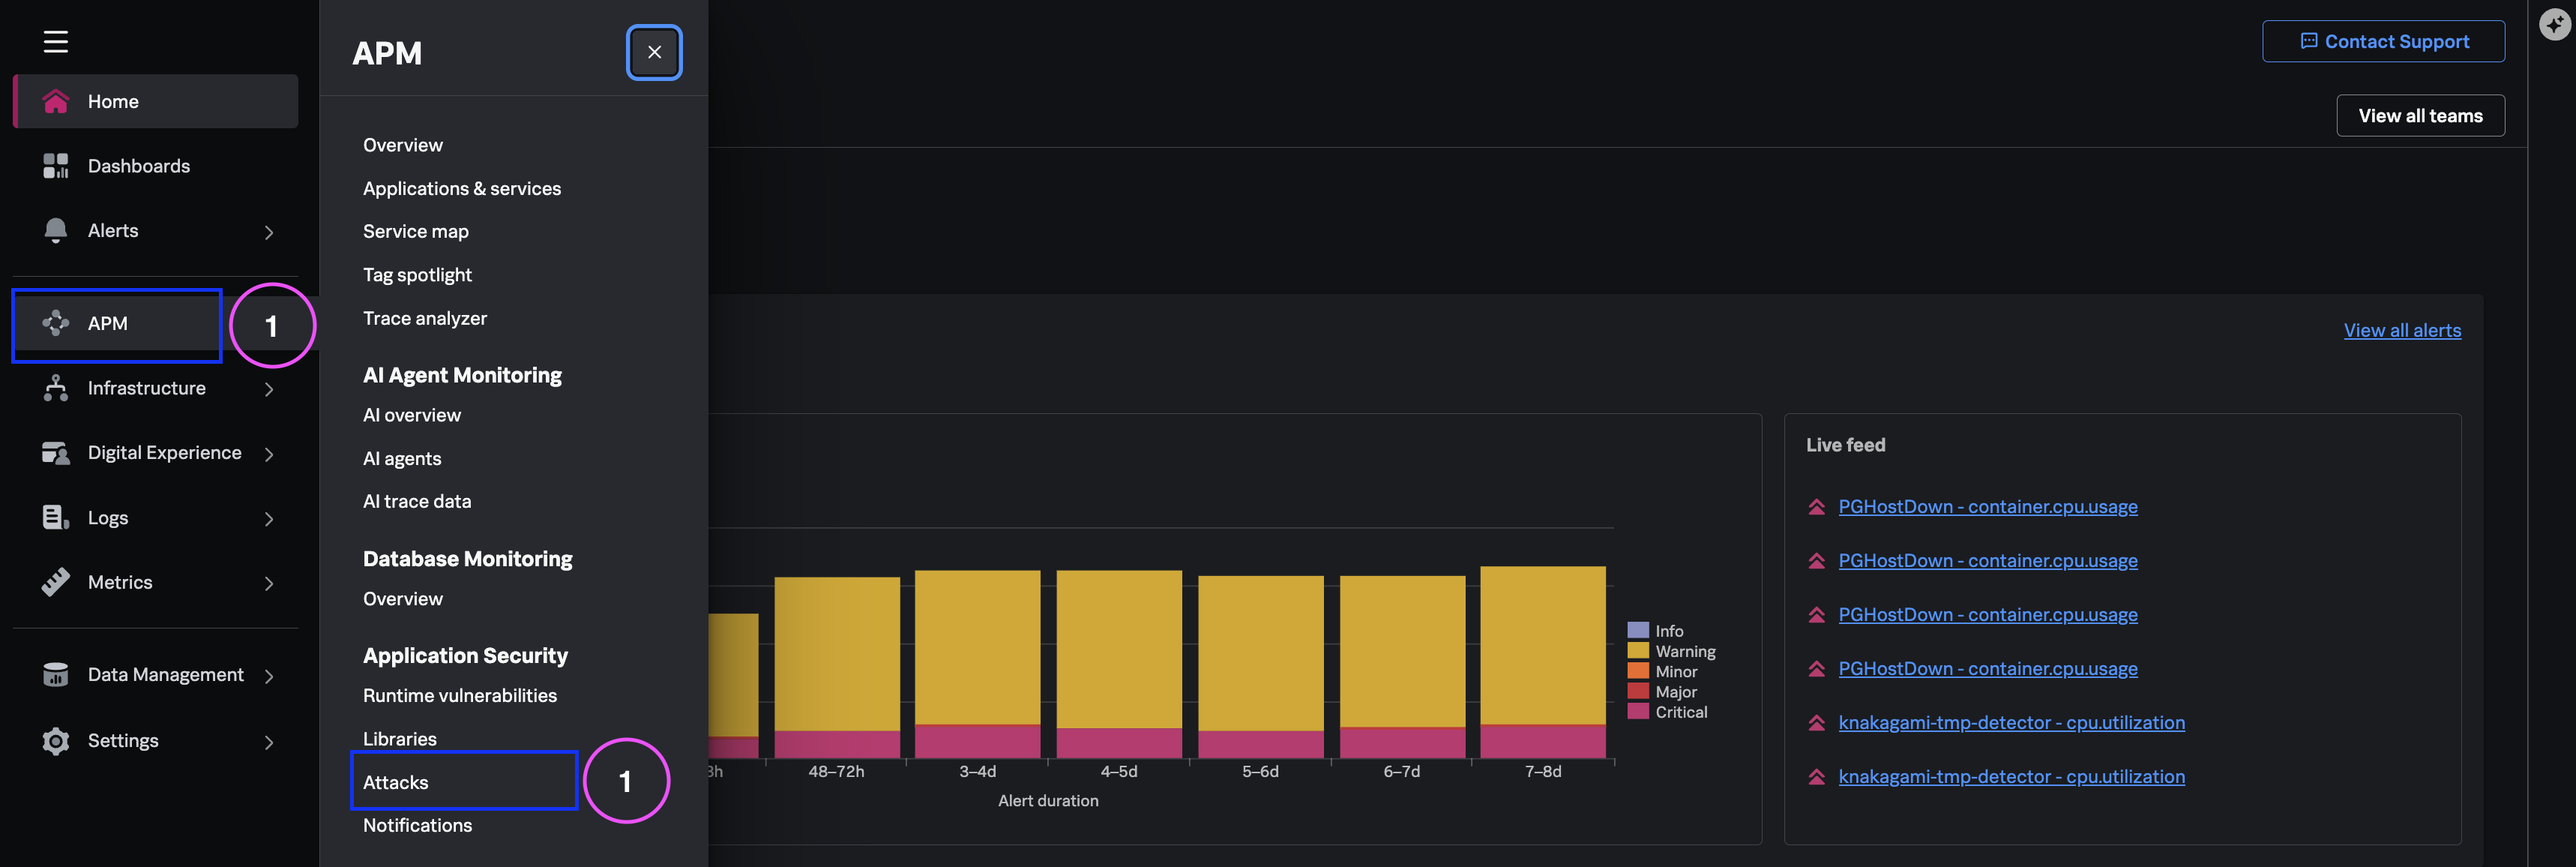
From APM → Application Security, select the Attacks tab.
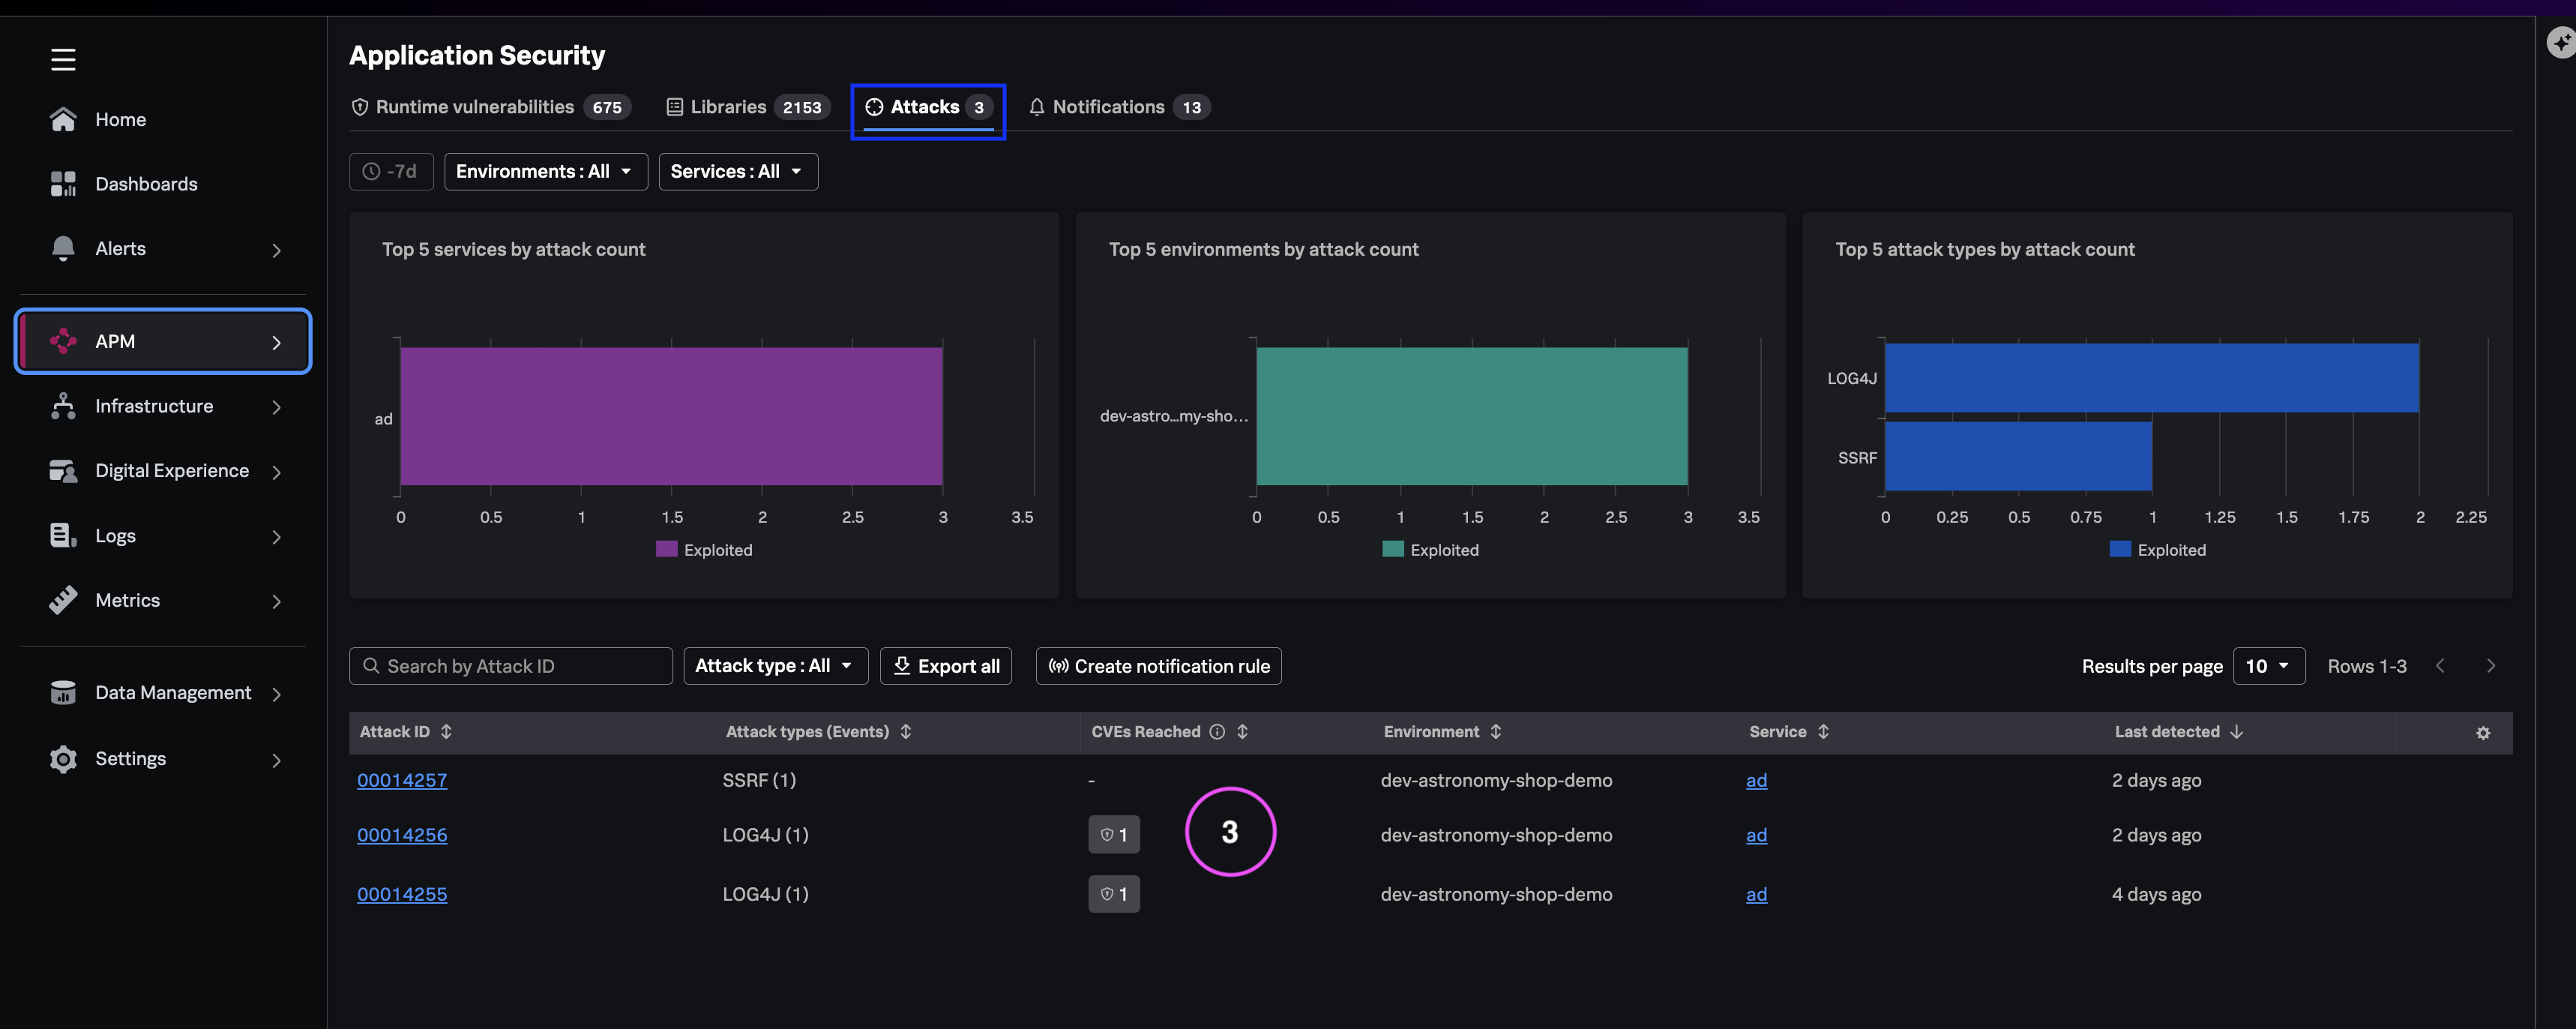
Review the attacks list. For each row, note:
- Attack type - Classification of the exploit attempt
- CVE Reached - How many CVEs weaknesses are implicated
- Environment & Service - Which entities in your stack are impacted
Investigate Attack Detail #
Having full context of the attack helps in actioning mitigation and remediation for it. It is important to know what kind of attack is active, where it is happening, what actions the bad-actor has executed and what the vulnerable entry points are.
Exercise
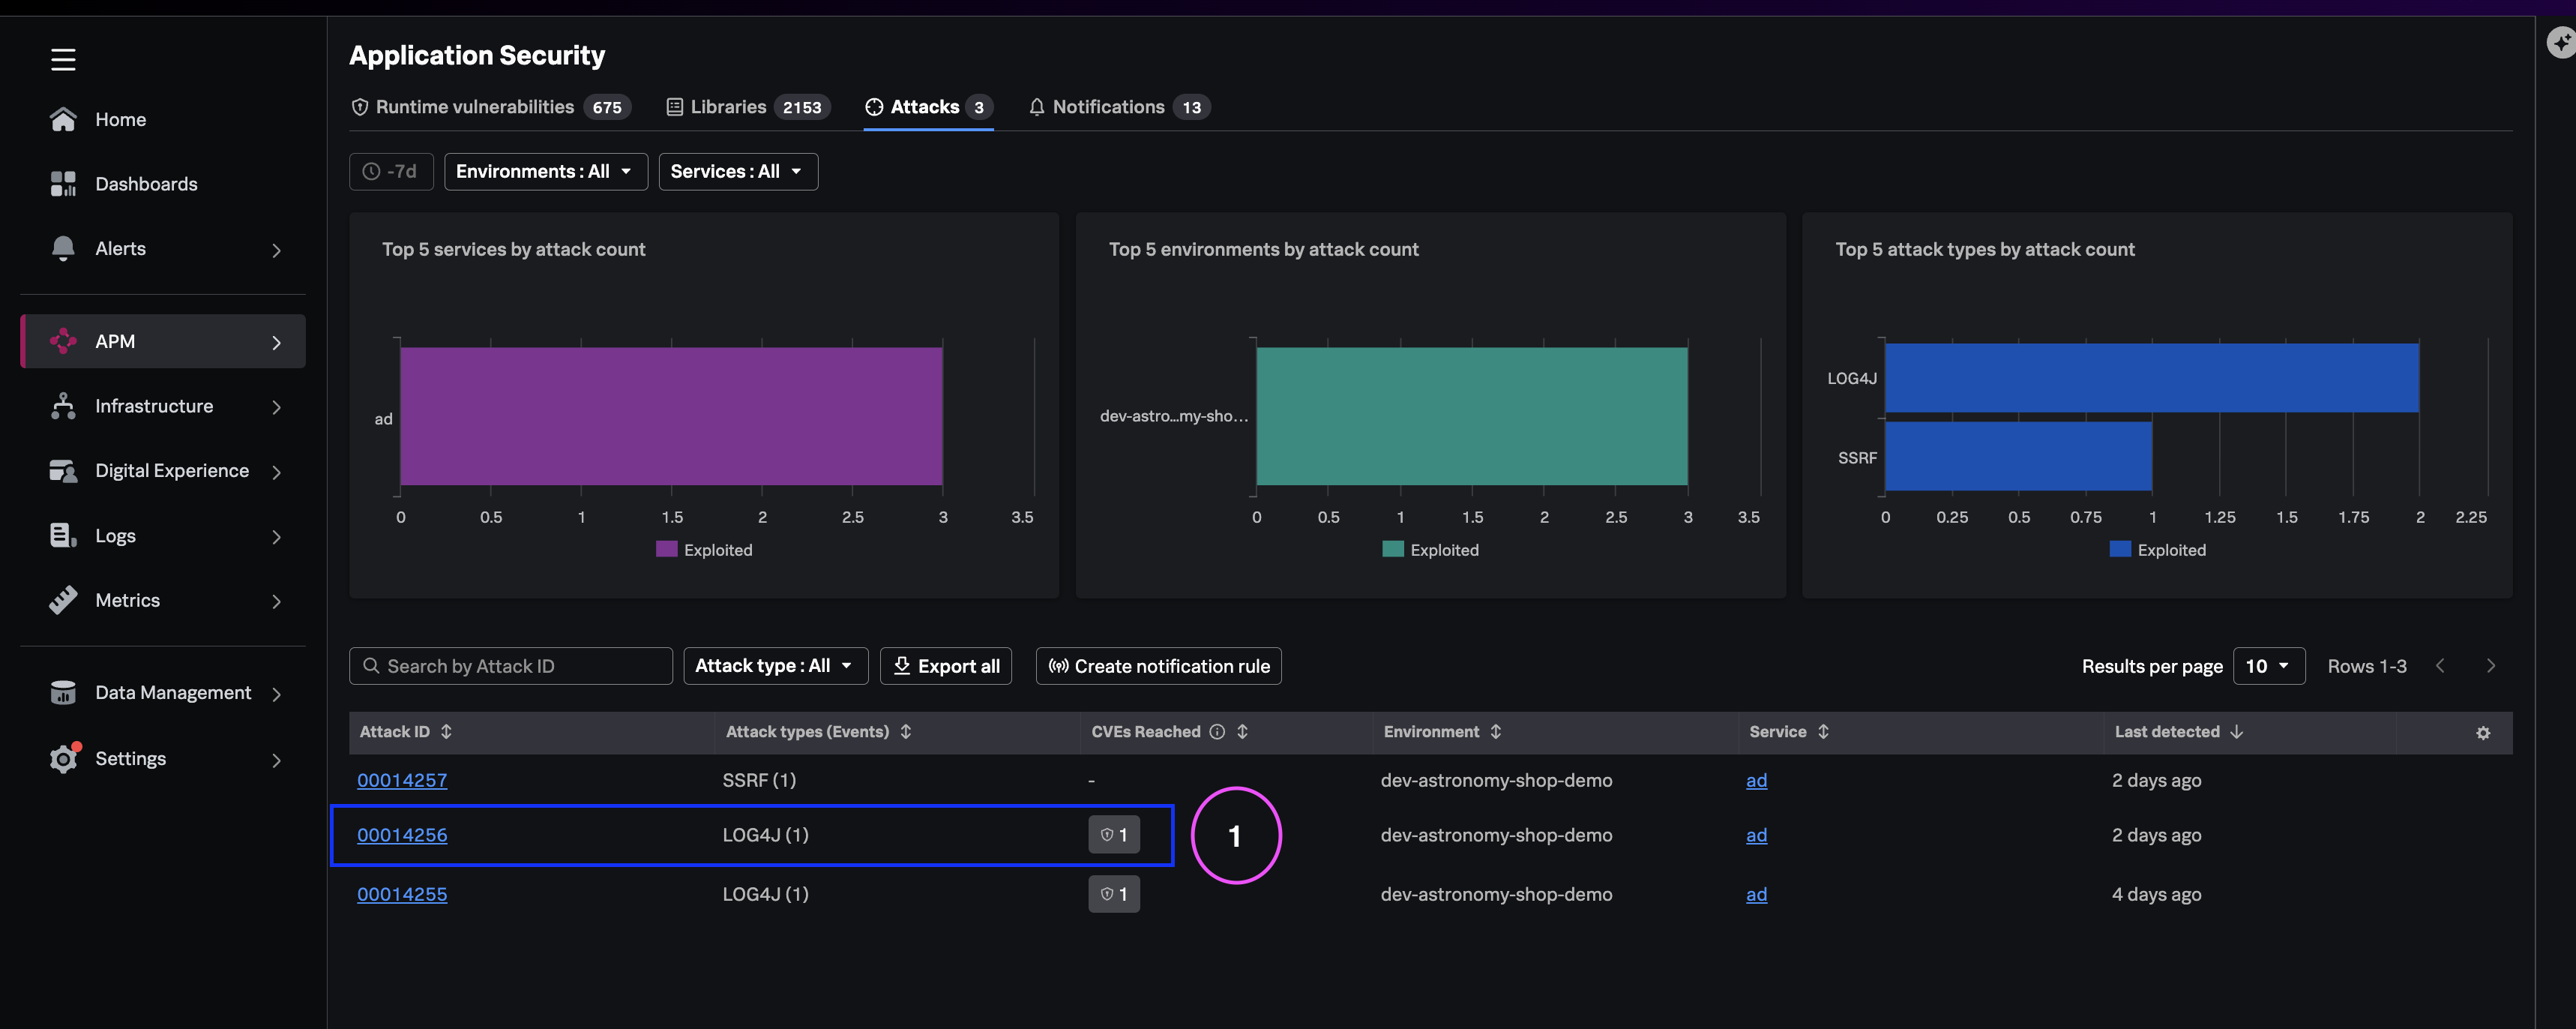
Select one attack activity to open the detailed view.
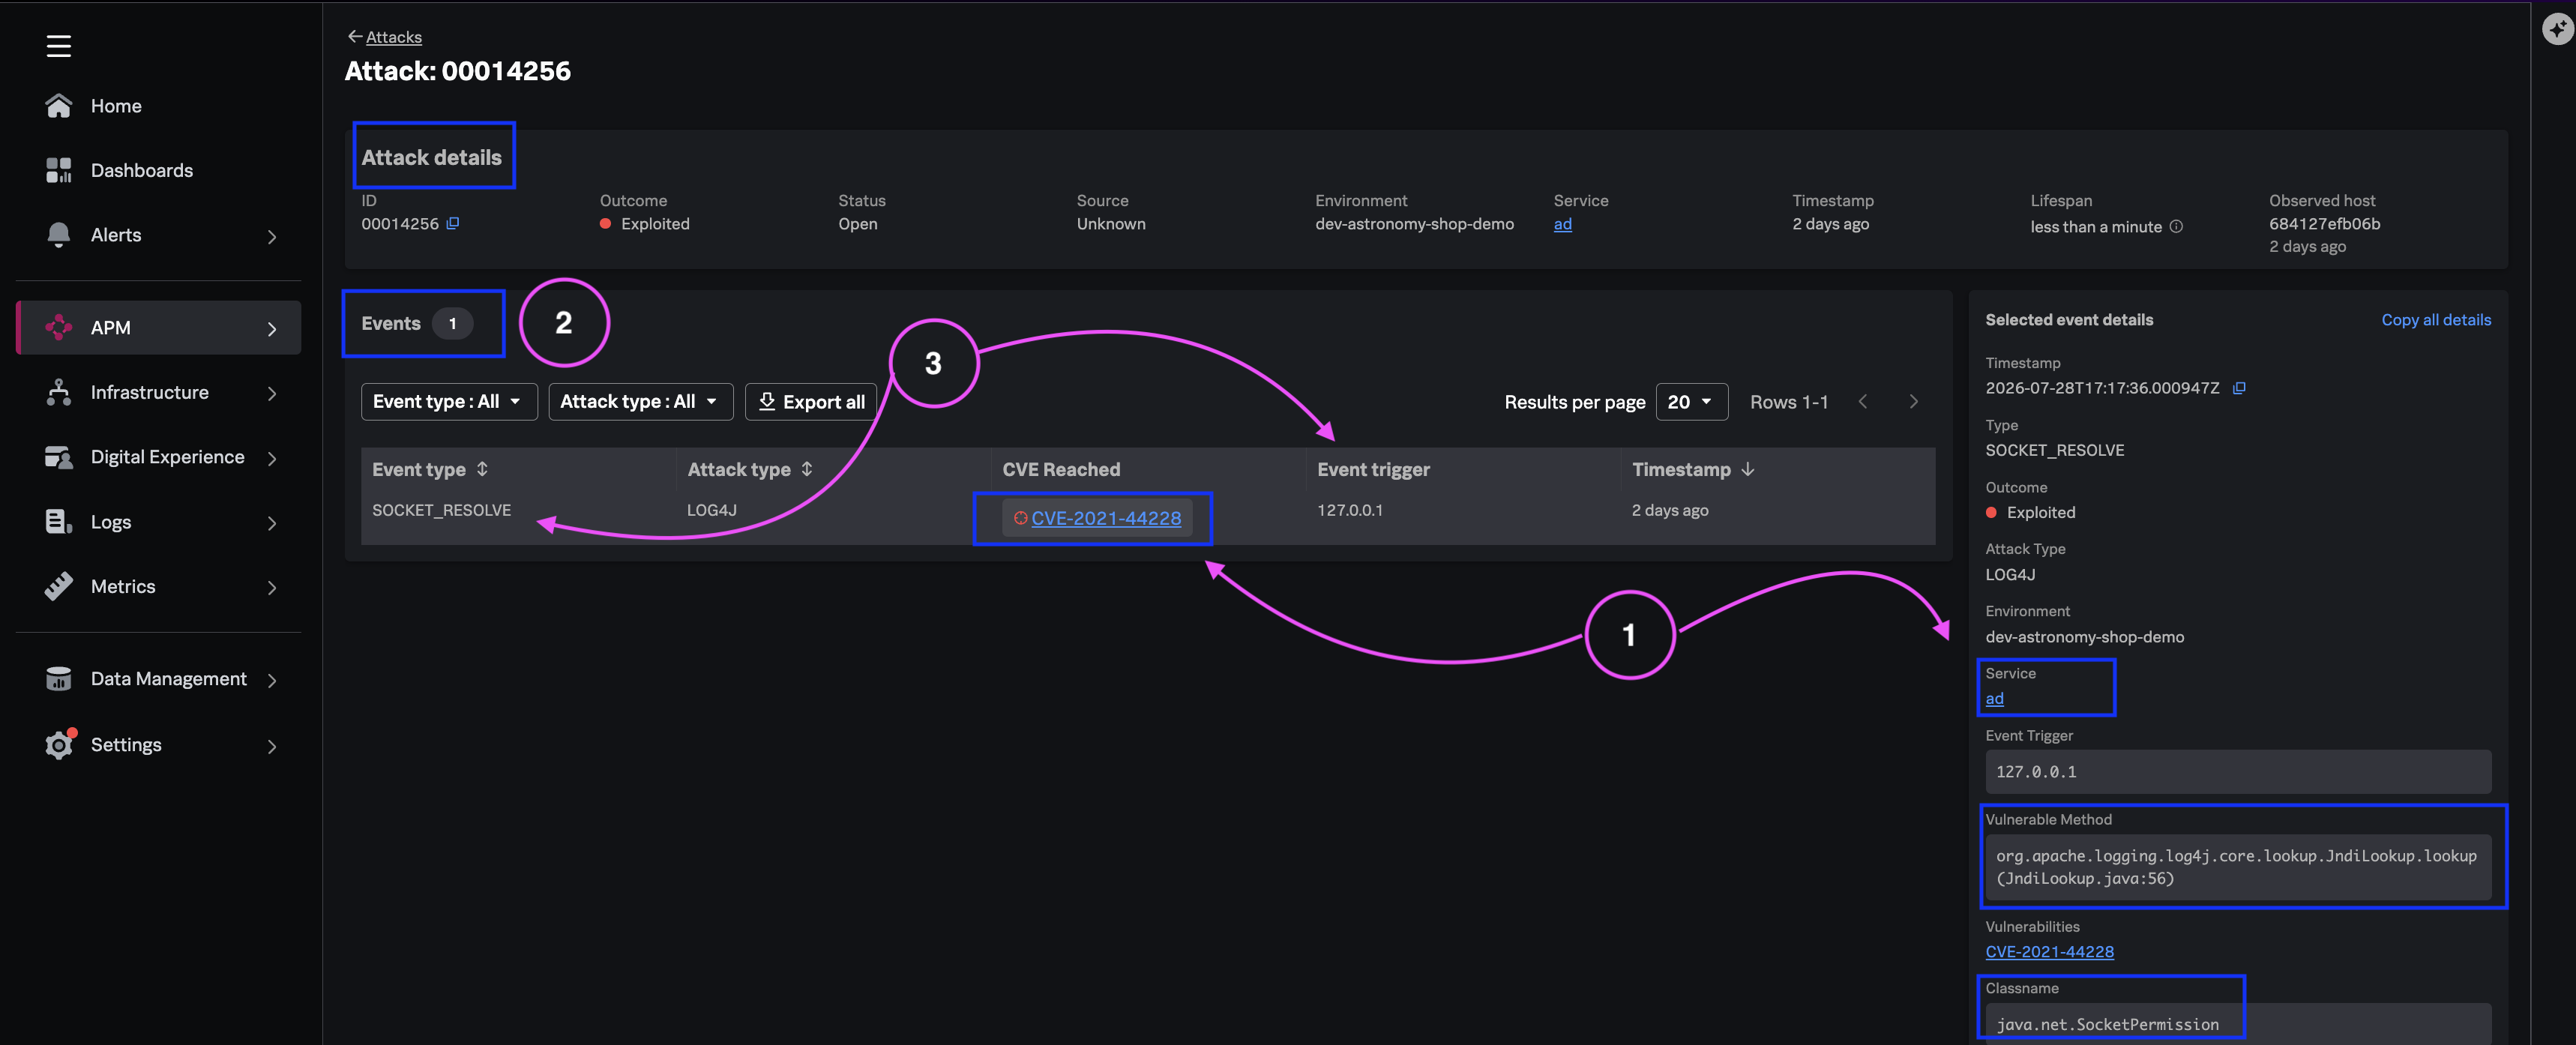
Review forensic fields:
- Attacked service, environment, and CVE
- Sequence of events and actions performed
- Specific event and trigger
- Vulnerable Method where in the code this vulnerability risk exists
Note
- This is just a subset of available context to review. Take a some time to review all the details showsn in this detailed view.
- Click through other Attack Types to review the context available for each - Some of the details may differ depending on the type of attack.
Code-Level Forensics #
“Identifying exactly which line of code was accessed during this exploit shorterns the loop from alert to remediation.”
Exercise
- Scroll to the Stack Trace attribute at the bottom of the attack detail.
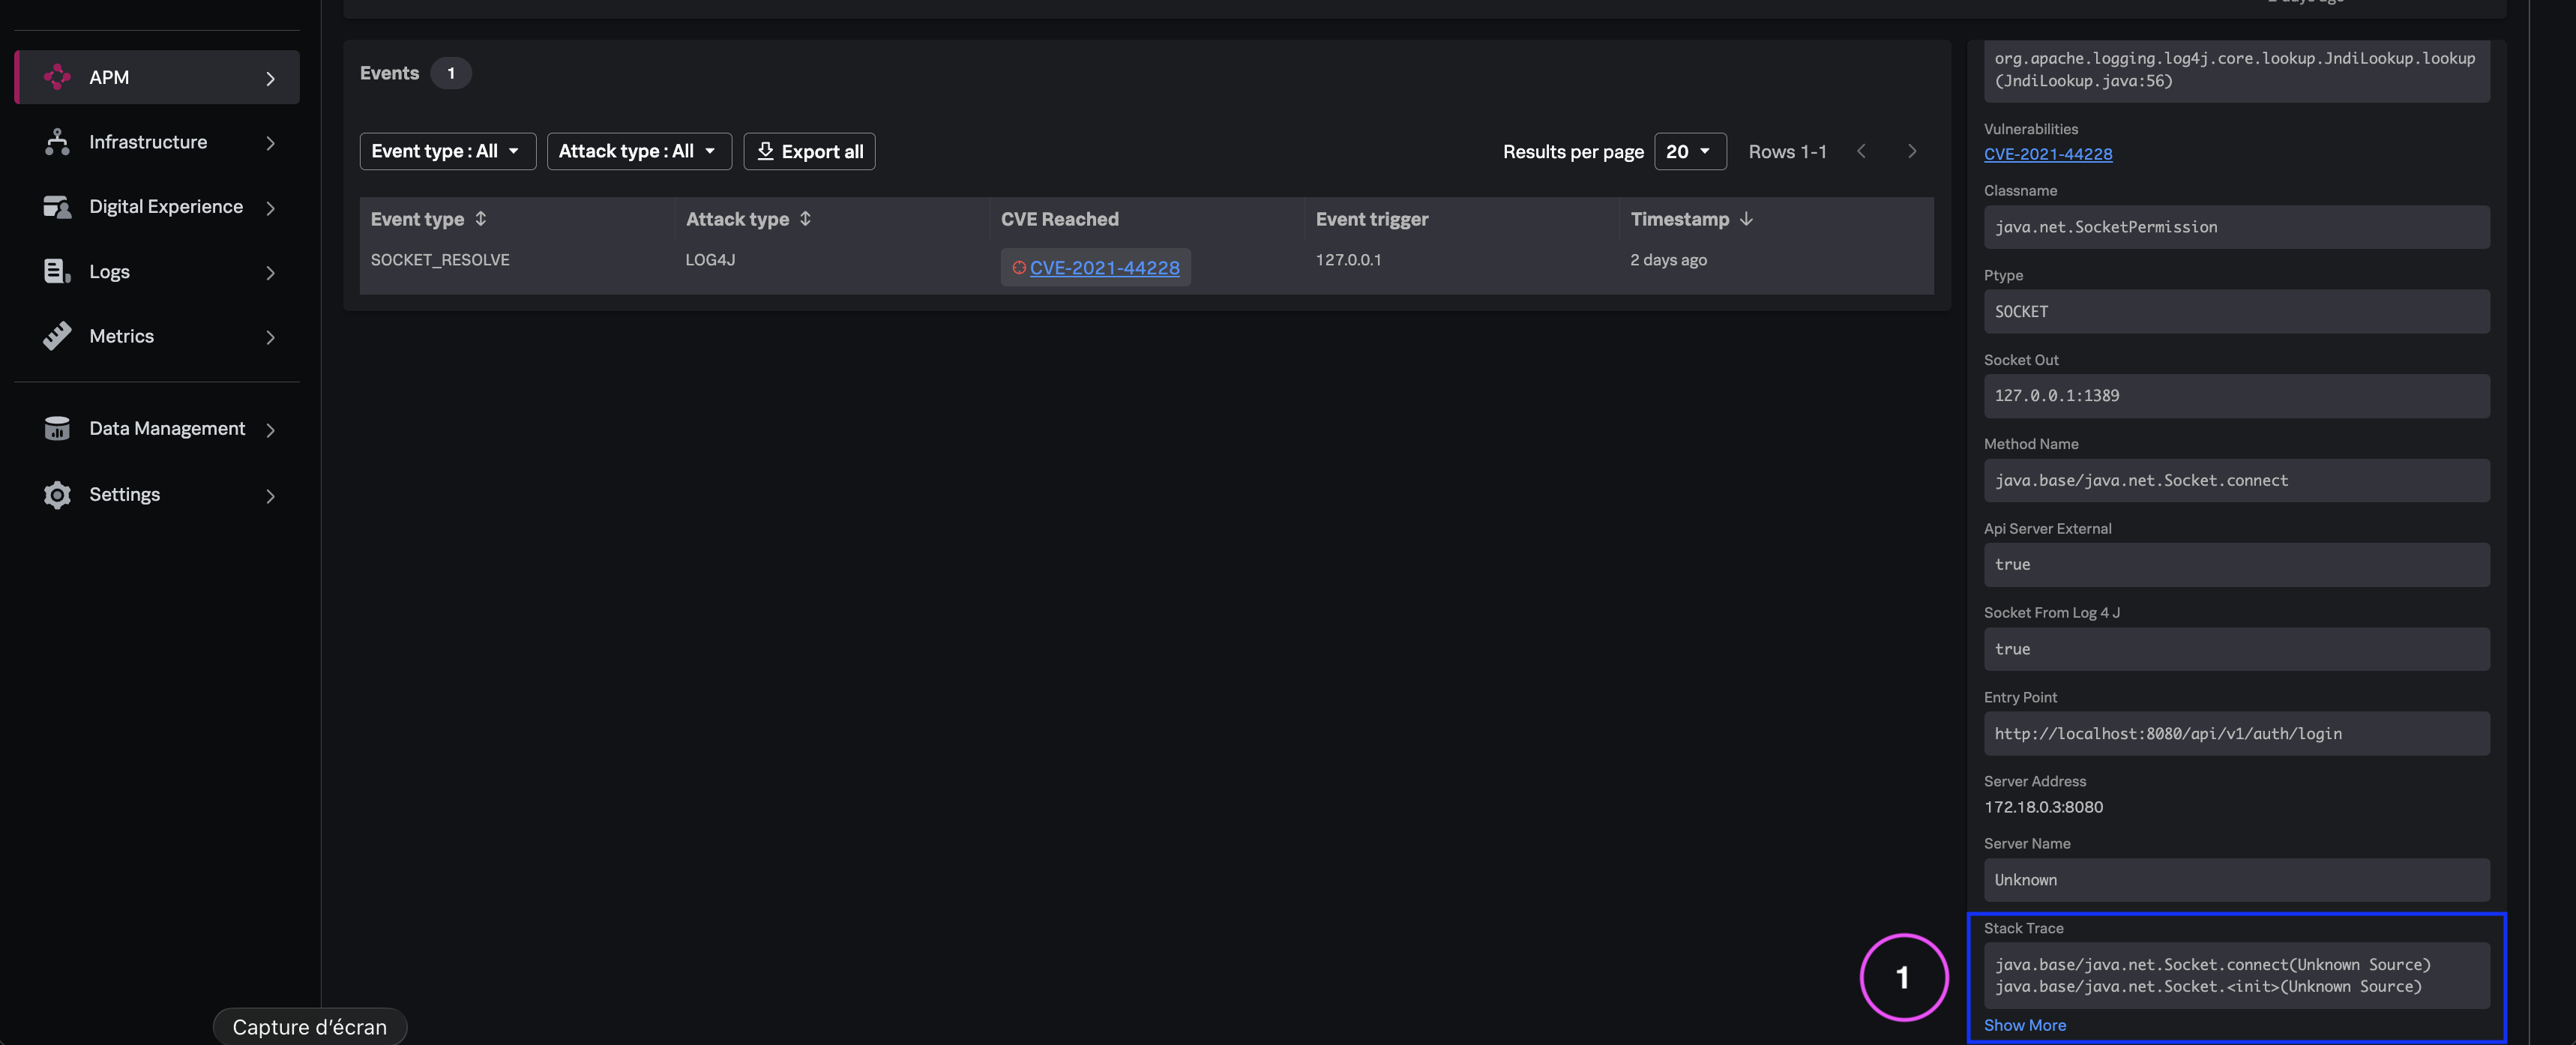
- Expand the stack trace.
- Identify the frame and line reference for code accessed during the exploit.

What you learned #
- How the Attacks tab surfaces exploit activity correlated to cataloged CVEs.
- How attack detail provides SOC-ready forensic context inside Observability.
- How stack traces bridge security alerts to developer-ready remediation.