1. RUM Overview
Exercise
- In Splunk Observability Cloud, from the main menu, hover over Digital Experience, then click on Overview (1) from the Real User Monitoring section as shown below.
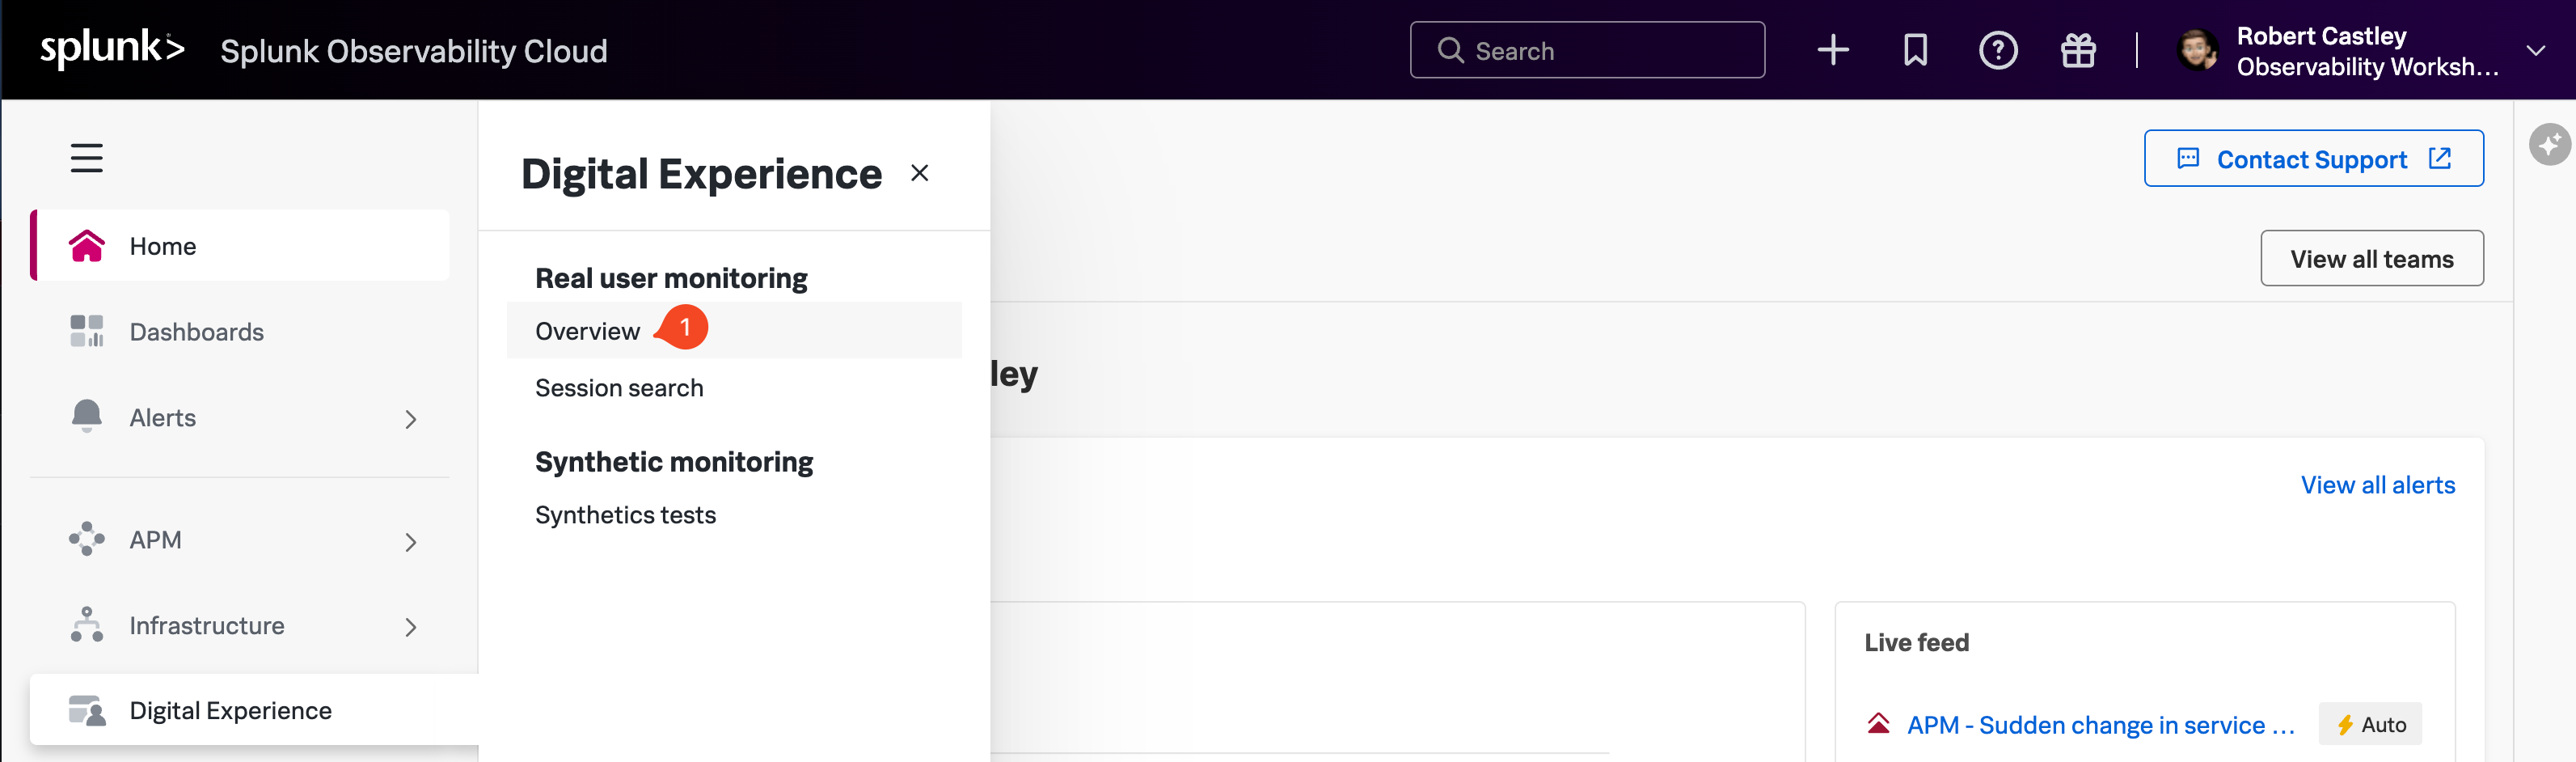
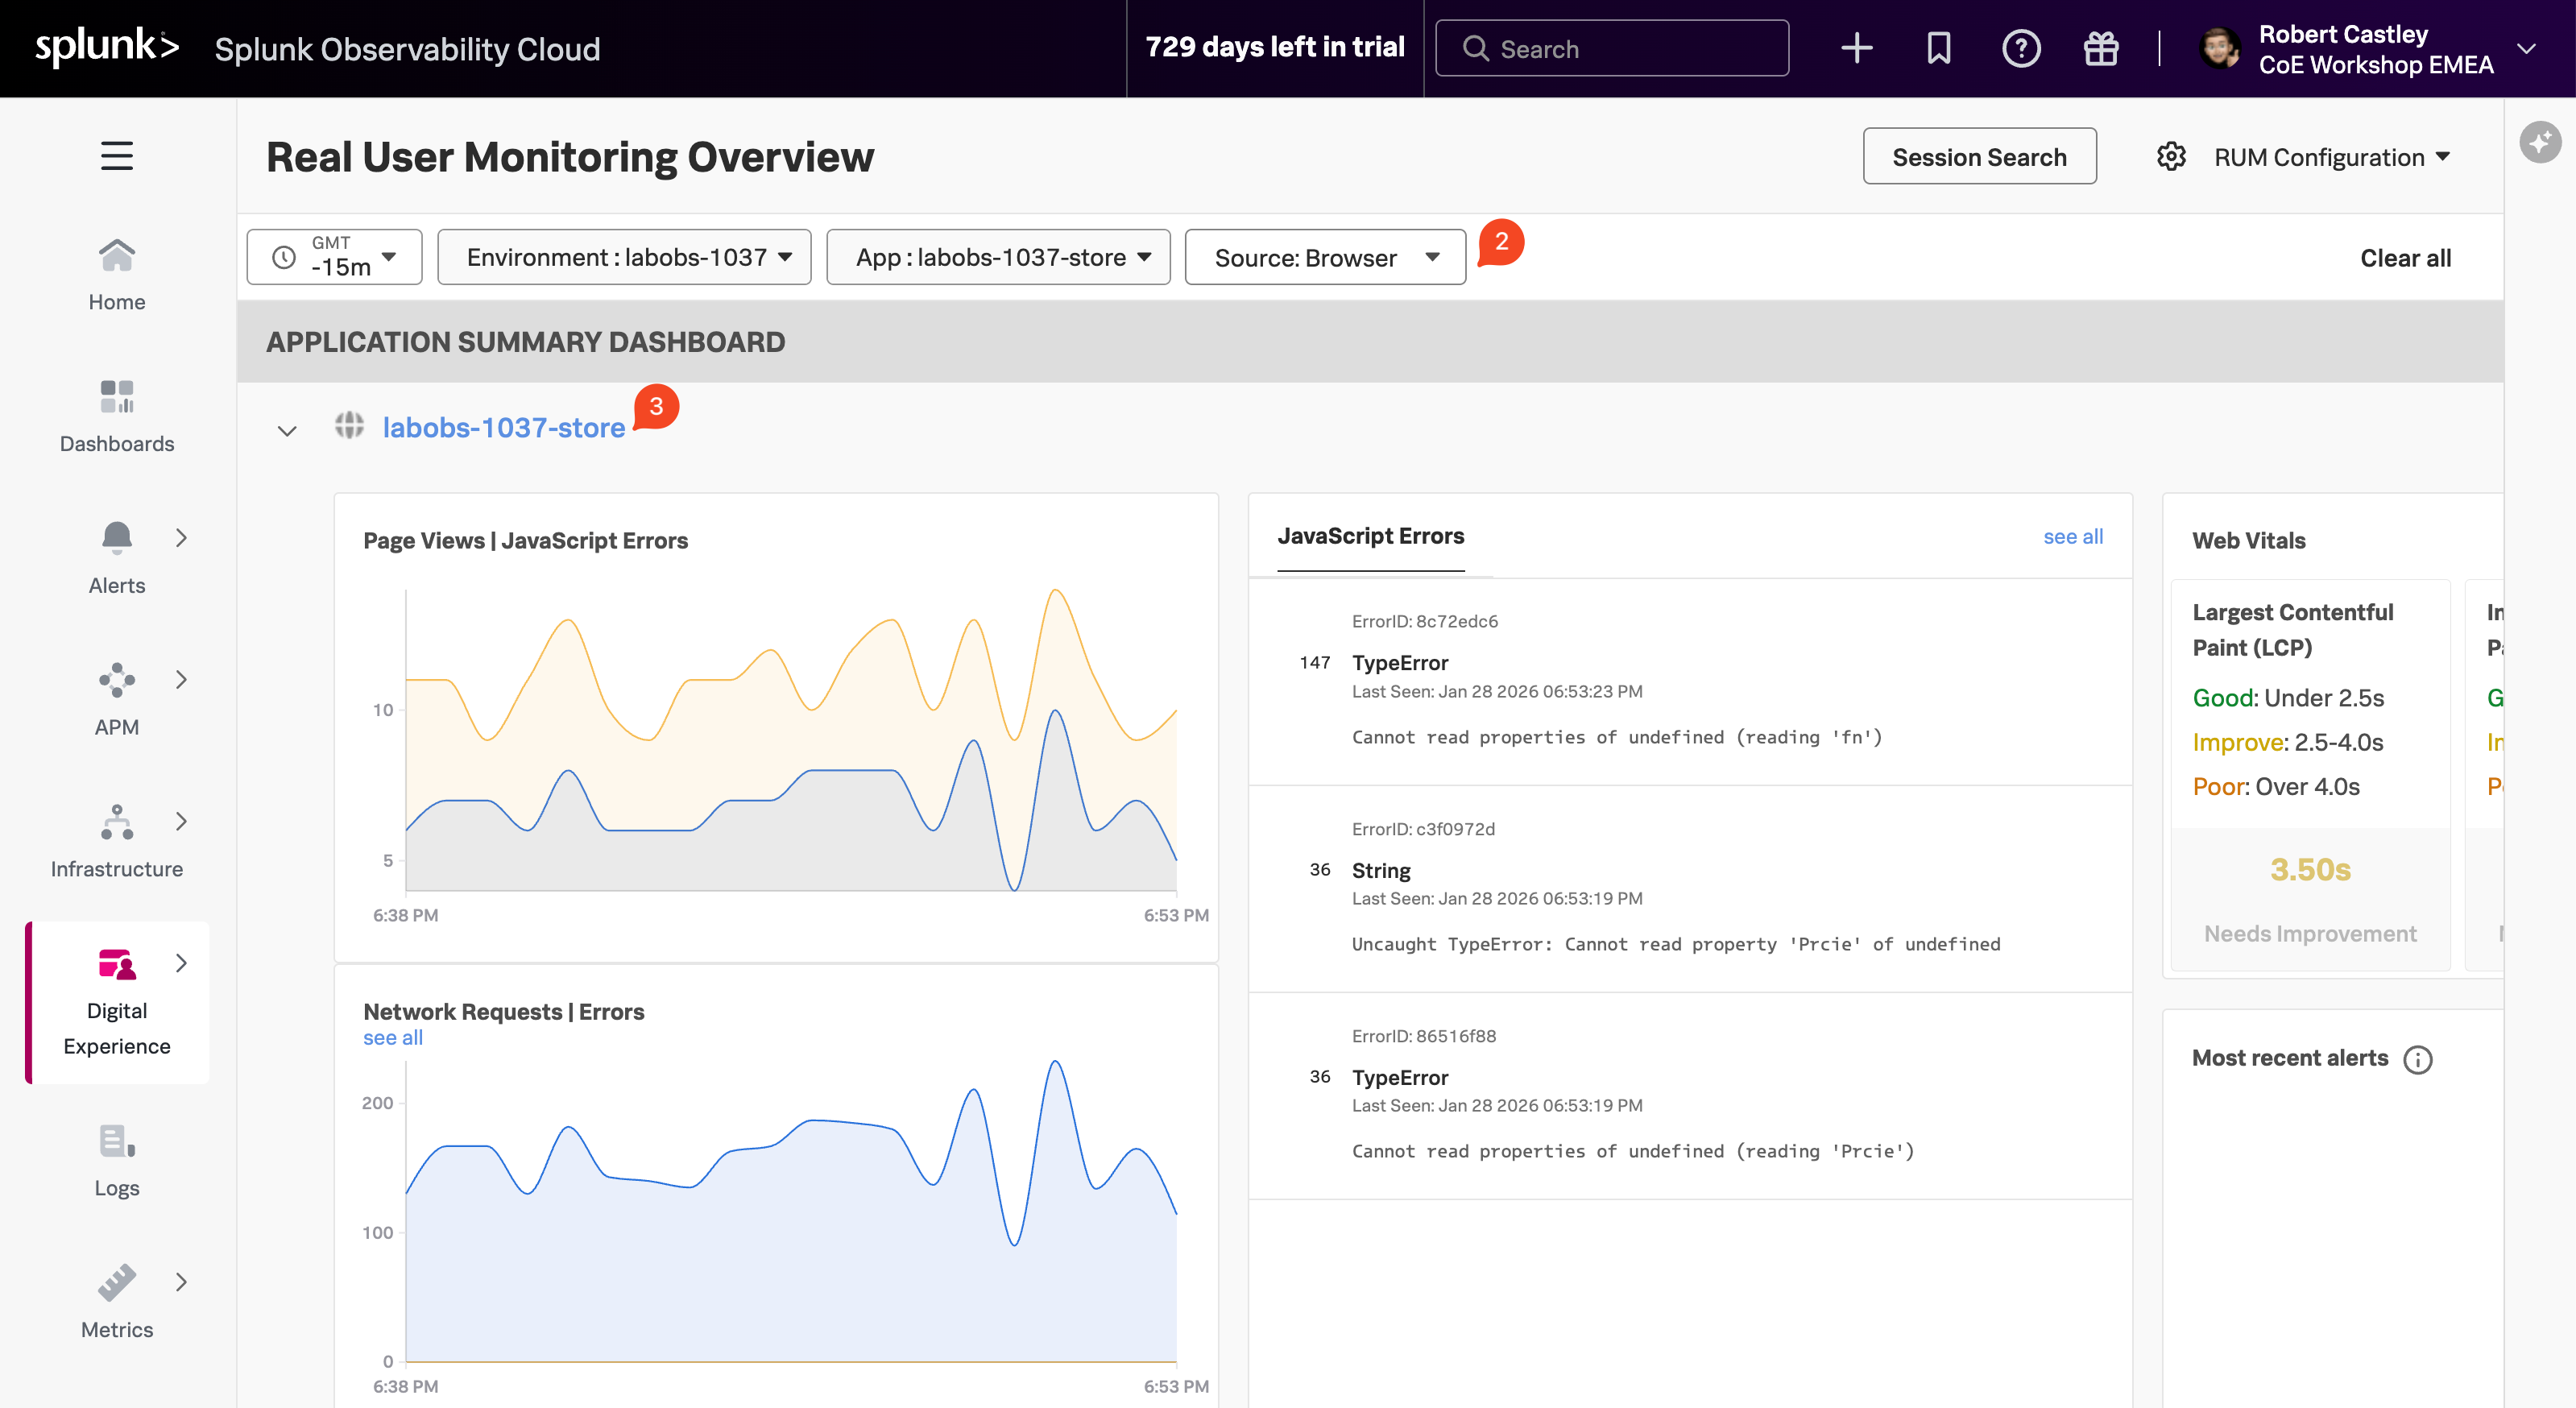
This will open up the Application Summary Dashboard. This section shows a quick overview of all the applications being monitored.
The Real User Monitoring (RUM) Overview dashboard in Splunk Observability Cloud provides visibility into how real users experience your web applications. It captures browser-side performance metrics, JavaScript errors, and network request failures as they occur in actual user sessions. The dashboard surfaces Core Web Vitals (LCP, INP, CLS) to measure page load performance, displays error trends over time, and shows recent alerts, giving frontend teams the insights needed to identify and resolve issues affecting end-user experience.
To ensure we are looking at the right data, please check the following settings (2):
- The Time frame is set to -15m.
- The Environment selected is [NAME OF WORKSHOP]-workshop.
- The App selected is [NAME OF WORKSHOP]-store.
- The Source is set to Browser.
Next, click on the [NAME OF WORKSHOP]-store (3) above the Page Views / JavaScript Errors chart.