2. APM Service View
Service View
As a service owner you can use the service view in Splunk APM to get a complete view of your service health in a single pane of glass. The service view includes a service-level indicator (SLI) for availability, dependencies, request, error, and duration (RED) metrics, runtime metrics, infrastructure metrics, Tag Spotlight, endpoints, and logs for a selected service. You can also quickly navigate to code profiling and memory profiling for your service from the service view.
Exercise
- Check the Time box, you can see that the dashboards only show data relevant to the time it took for the APM trace we previously selected to complete (note that the charts are static).
- In the Time box change the timeframe to -1h (1).
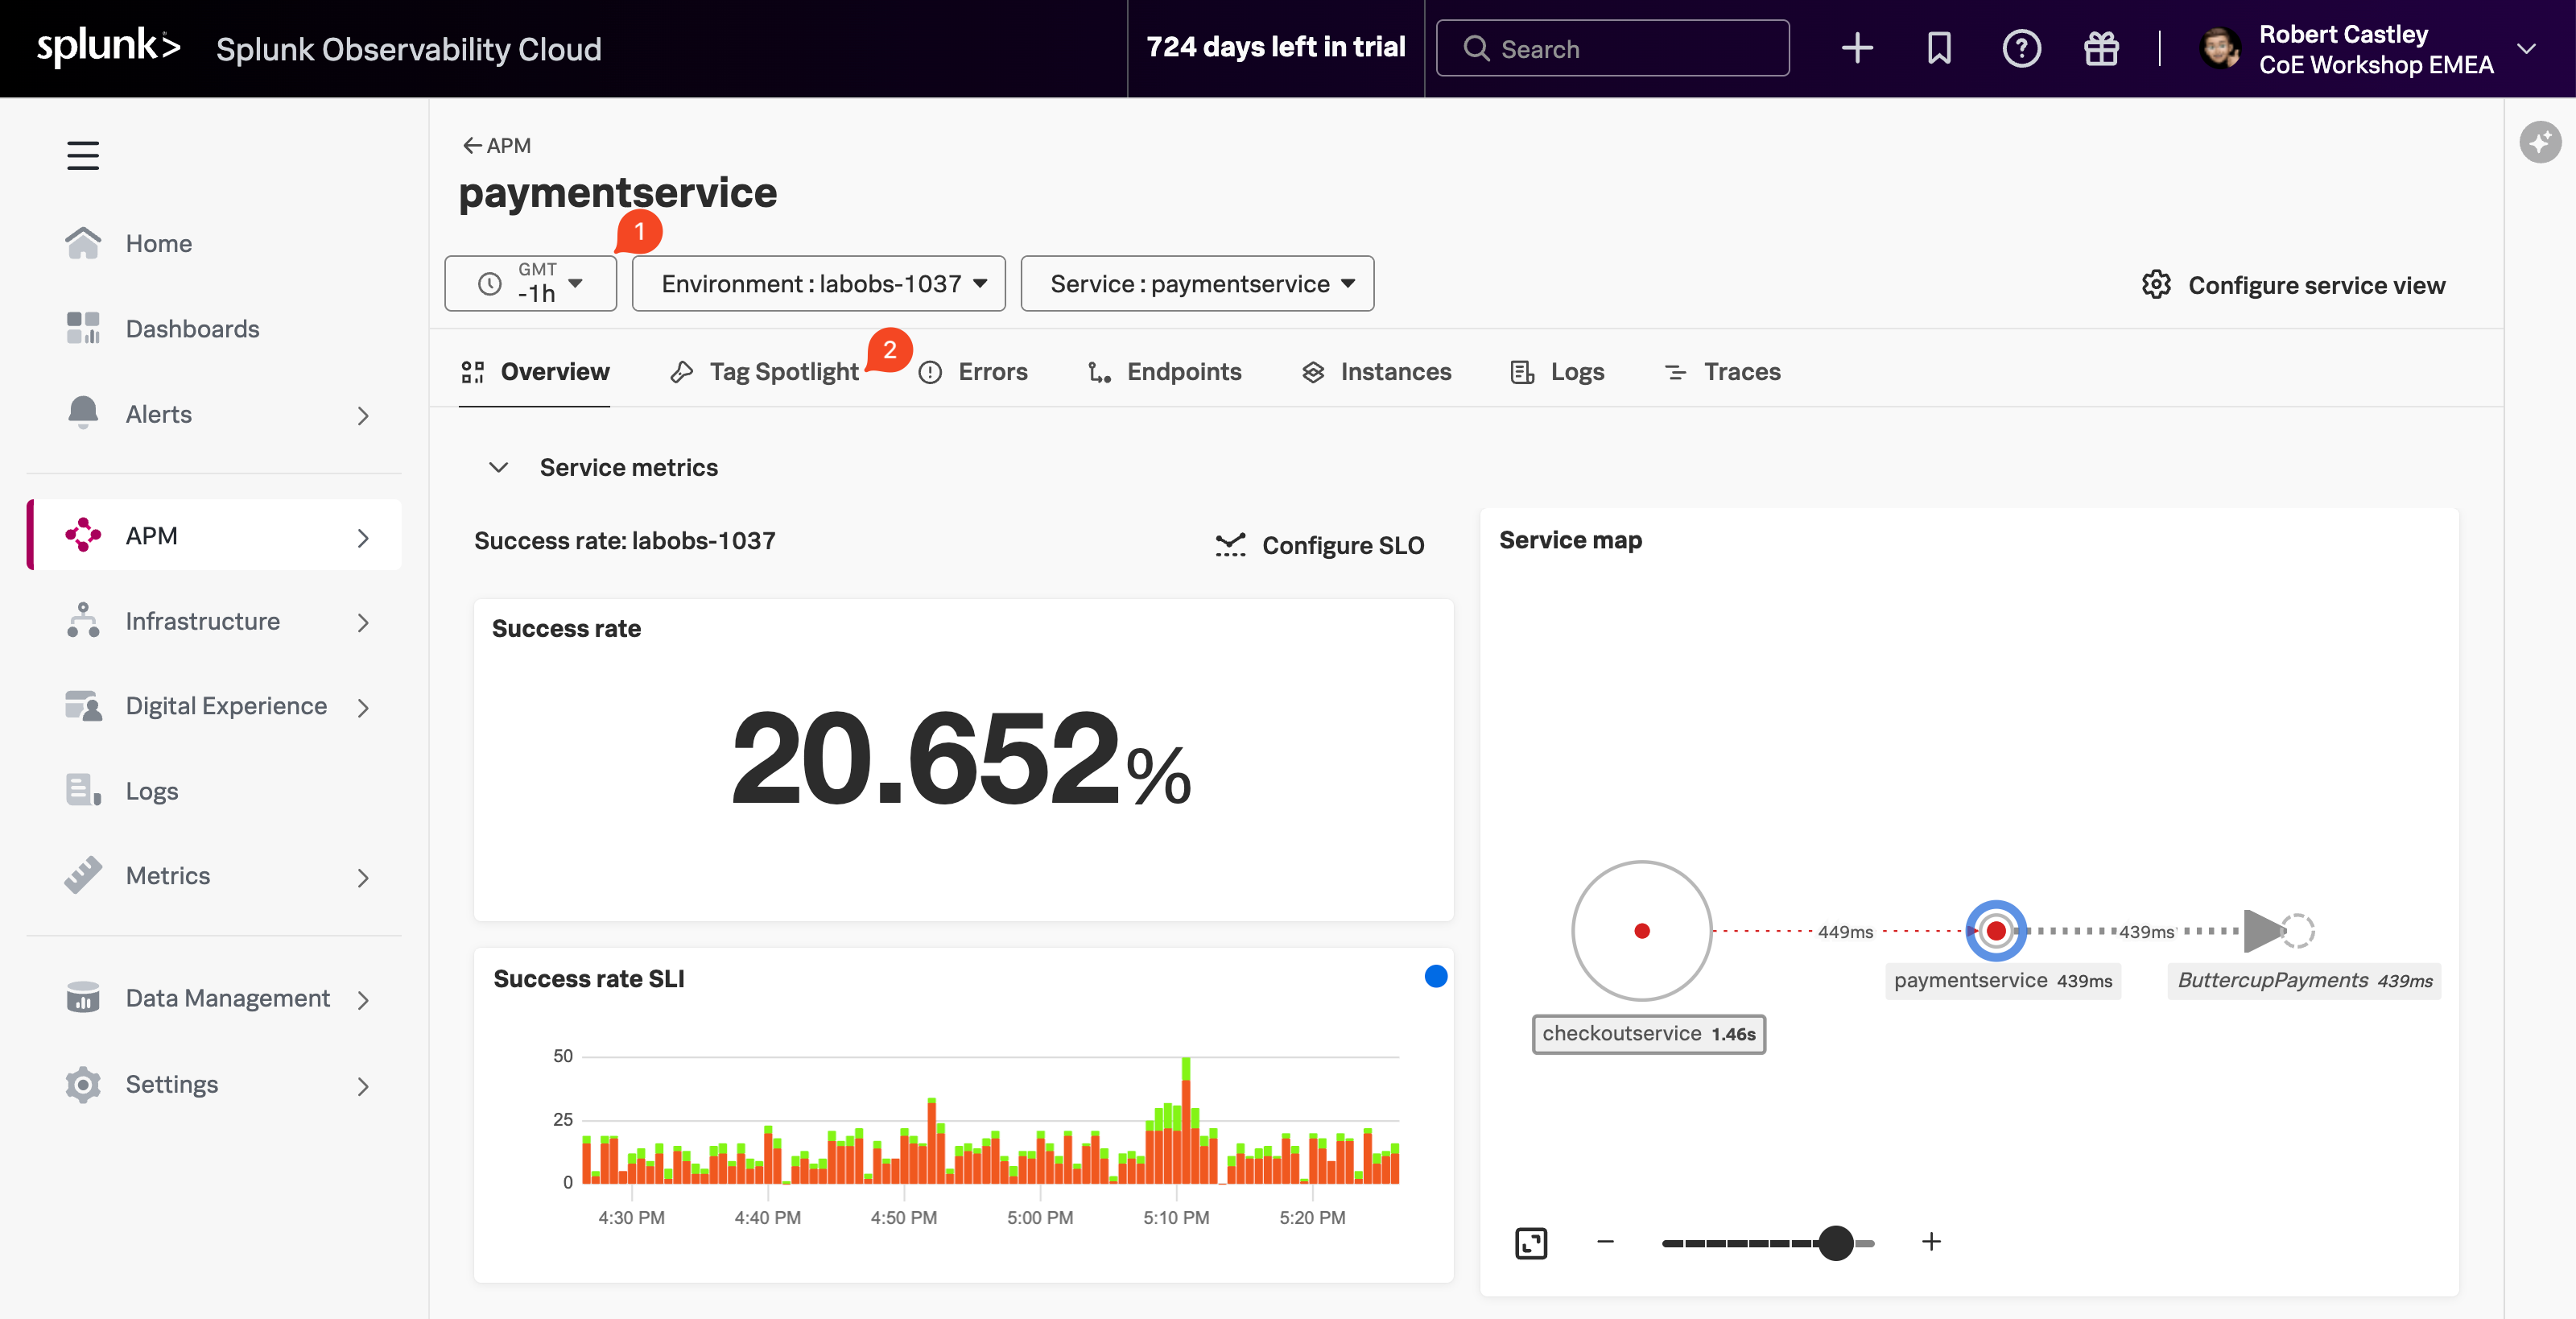
- You can clearly see the Success rate is not 100%, this is because we have errors in our service.
- We need to understand if there is a pattern to this error rate. We have a handy tool for that, click on the Tag Spotlight tab (2).