5. APM Trace Analyzer
We have arrived at the Trace Analyzer.
Trace Analyzer is a powerful tool in Splunk APM designed for exploring and analyzing distributed traces at scale. Because Splunk APM captures every trace with full-fidelity (NoSample), you have complete visibility into all transactions flowing through your services.
Trace Analyzer enables you to:
- Search with high-cardinality tags: Filter traces using any indexed span tag, such as customer IDs, order IDs, or custom business attributes.
- Visualize trace patterns: View trace and error counts over time to identify trends and anomalies.
- Analyze latency distribution: Use the heatmap view to understand trace duration patterns and spot outliers.
- Drill down to specific traces: Quickly find the exact trace you need, whether investigating a customer complaint or debugging a specific transaction.
This makes Trace Analyzer ideal for investigating unknown issues, researching specific transactions, and performing root cause analysis when you need to find a needle in a haystack.
Exercise
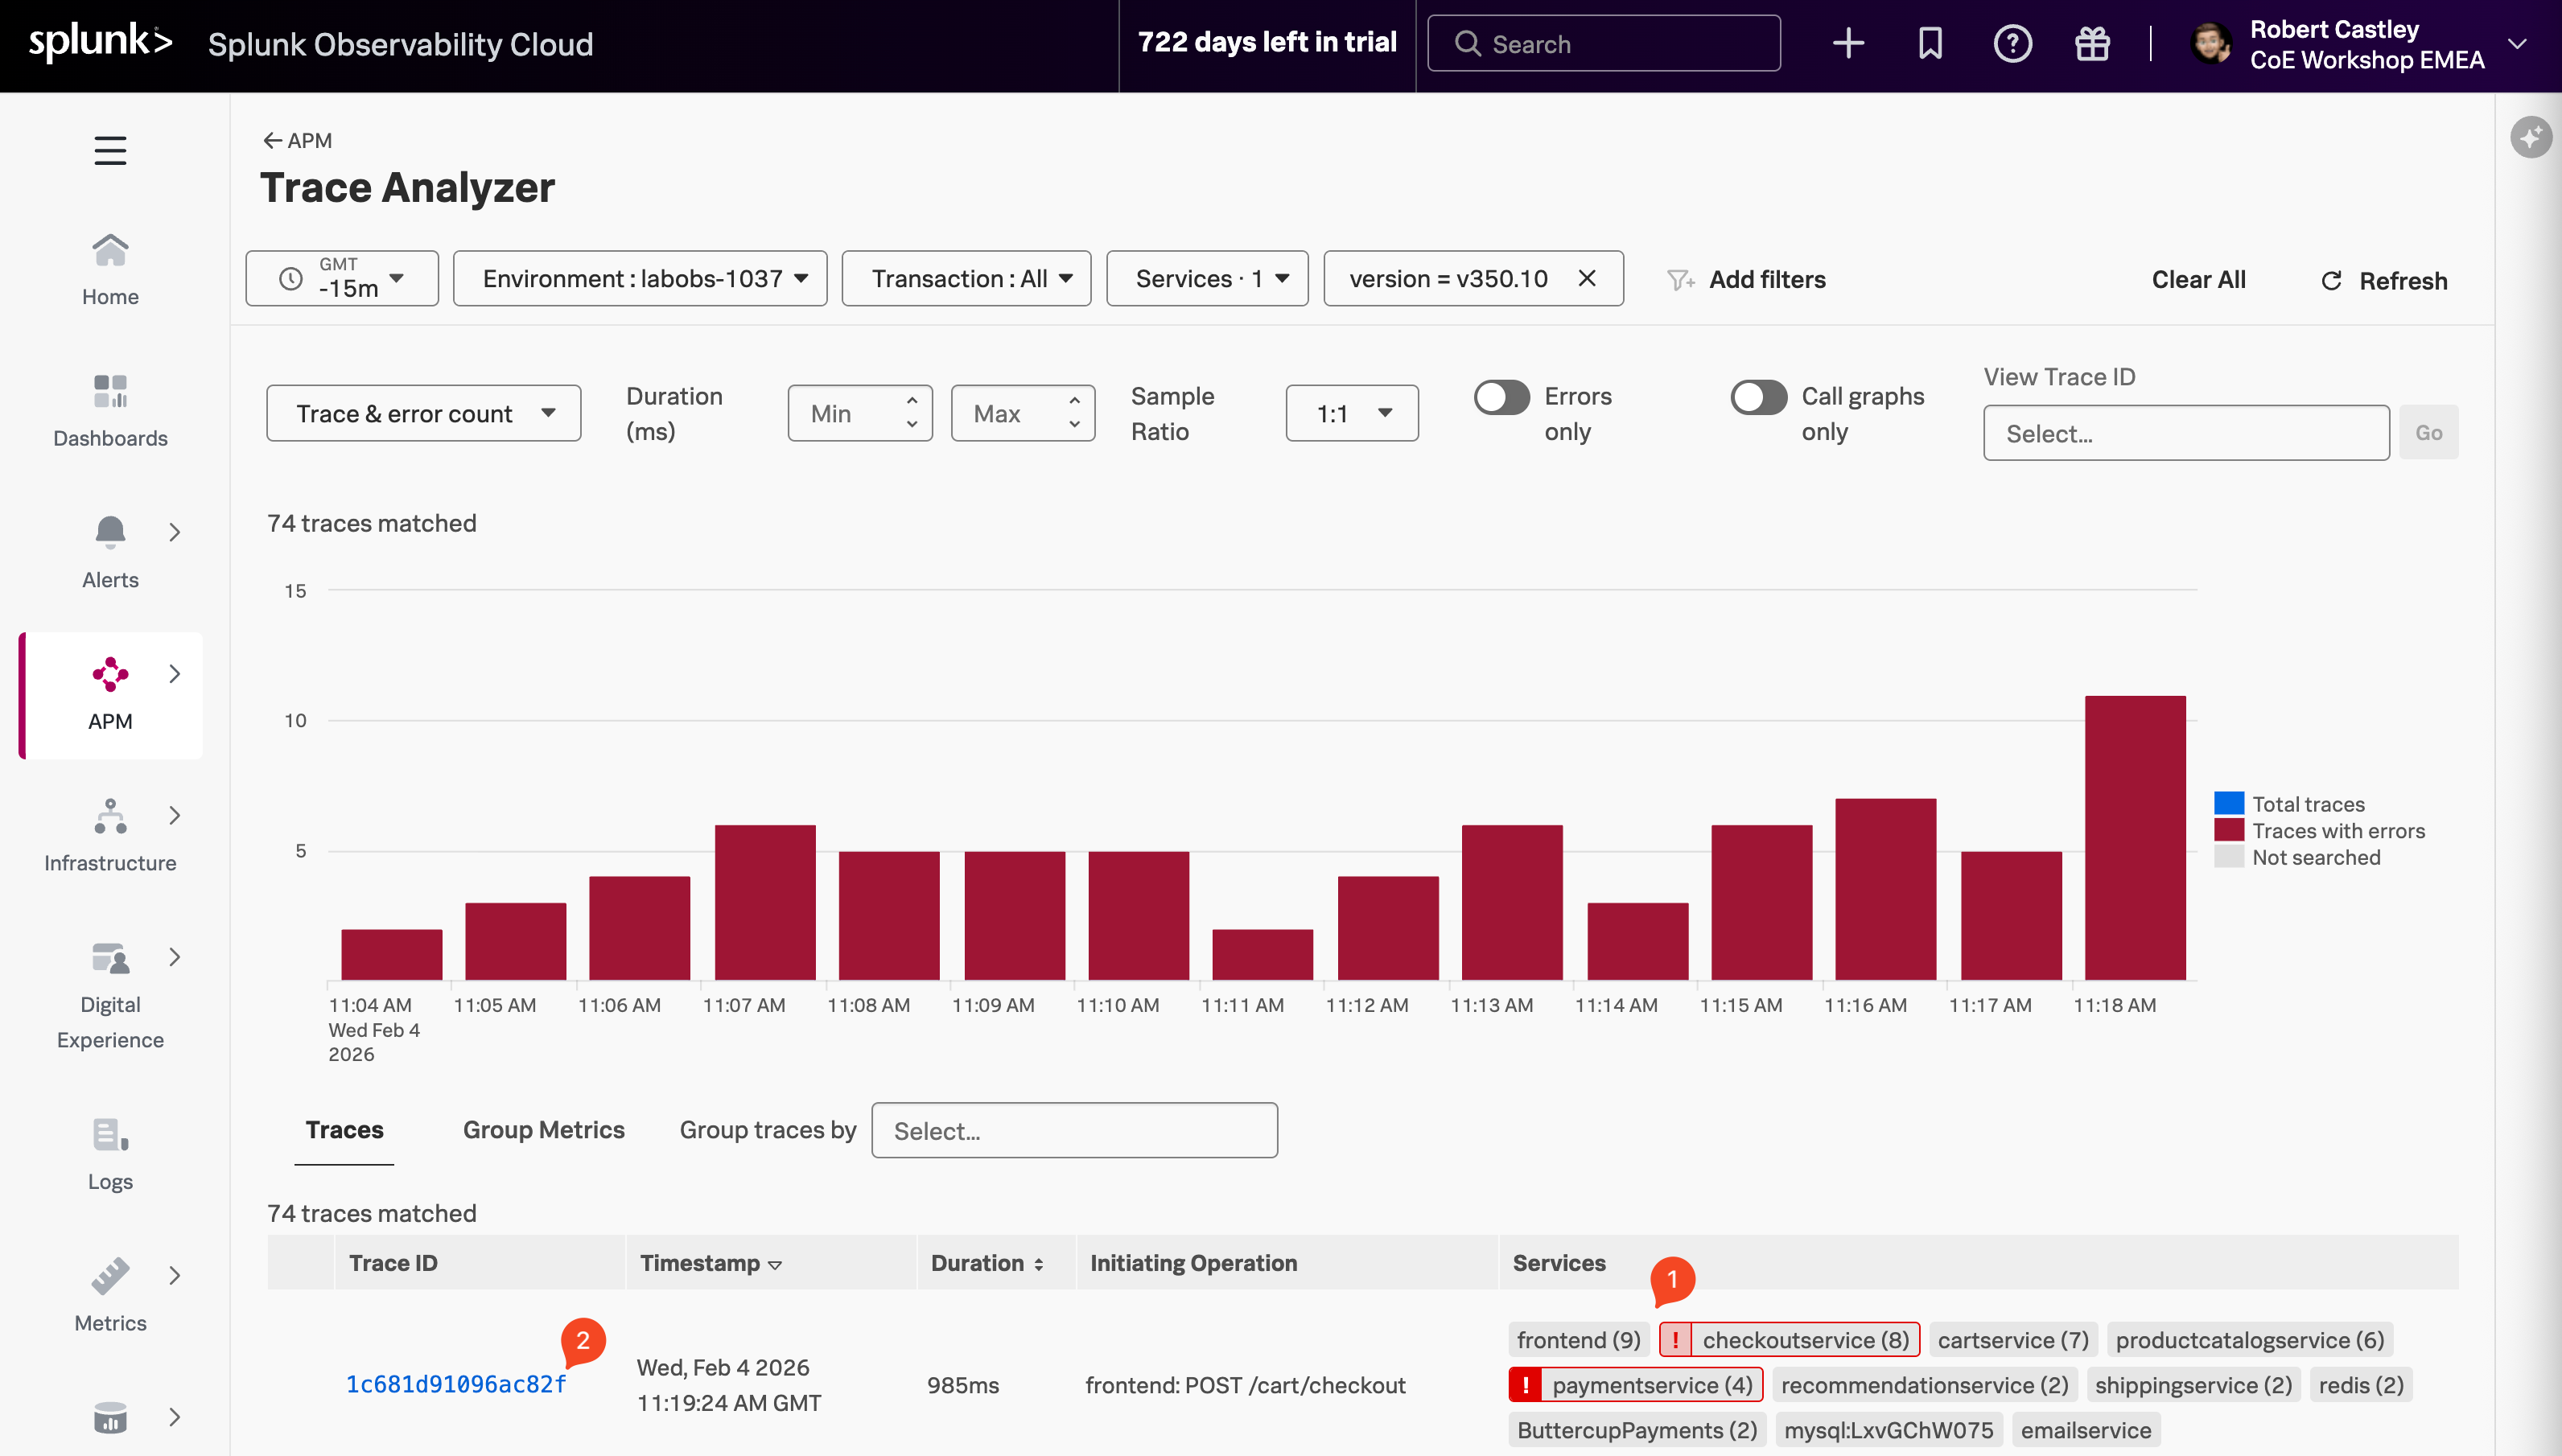
- Find a trace with:
- an error in the checkoutservice and the paymentservice (1)
- and an Initiating Operation of
frontend: POST /cart/checkout - then select the blue Trace ID (2) to continue
- This will open the Trace Waterfall for that specific trace.