

Logs
1. Introduction to Logs
You’ve now navigated directly from an APM trace into Logs using the Related Content link. Logs is Splunk Observability Cloud’s no-code interface for exploring and analyzing log data.
The key advantage, just as with the RUM and APM integration, is that you’re viewing your logs in the context of your previous actions. In this case, that context includes the matching time range (1) from the trace and a filter (2) automatically applied to the trace_id.
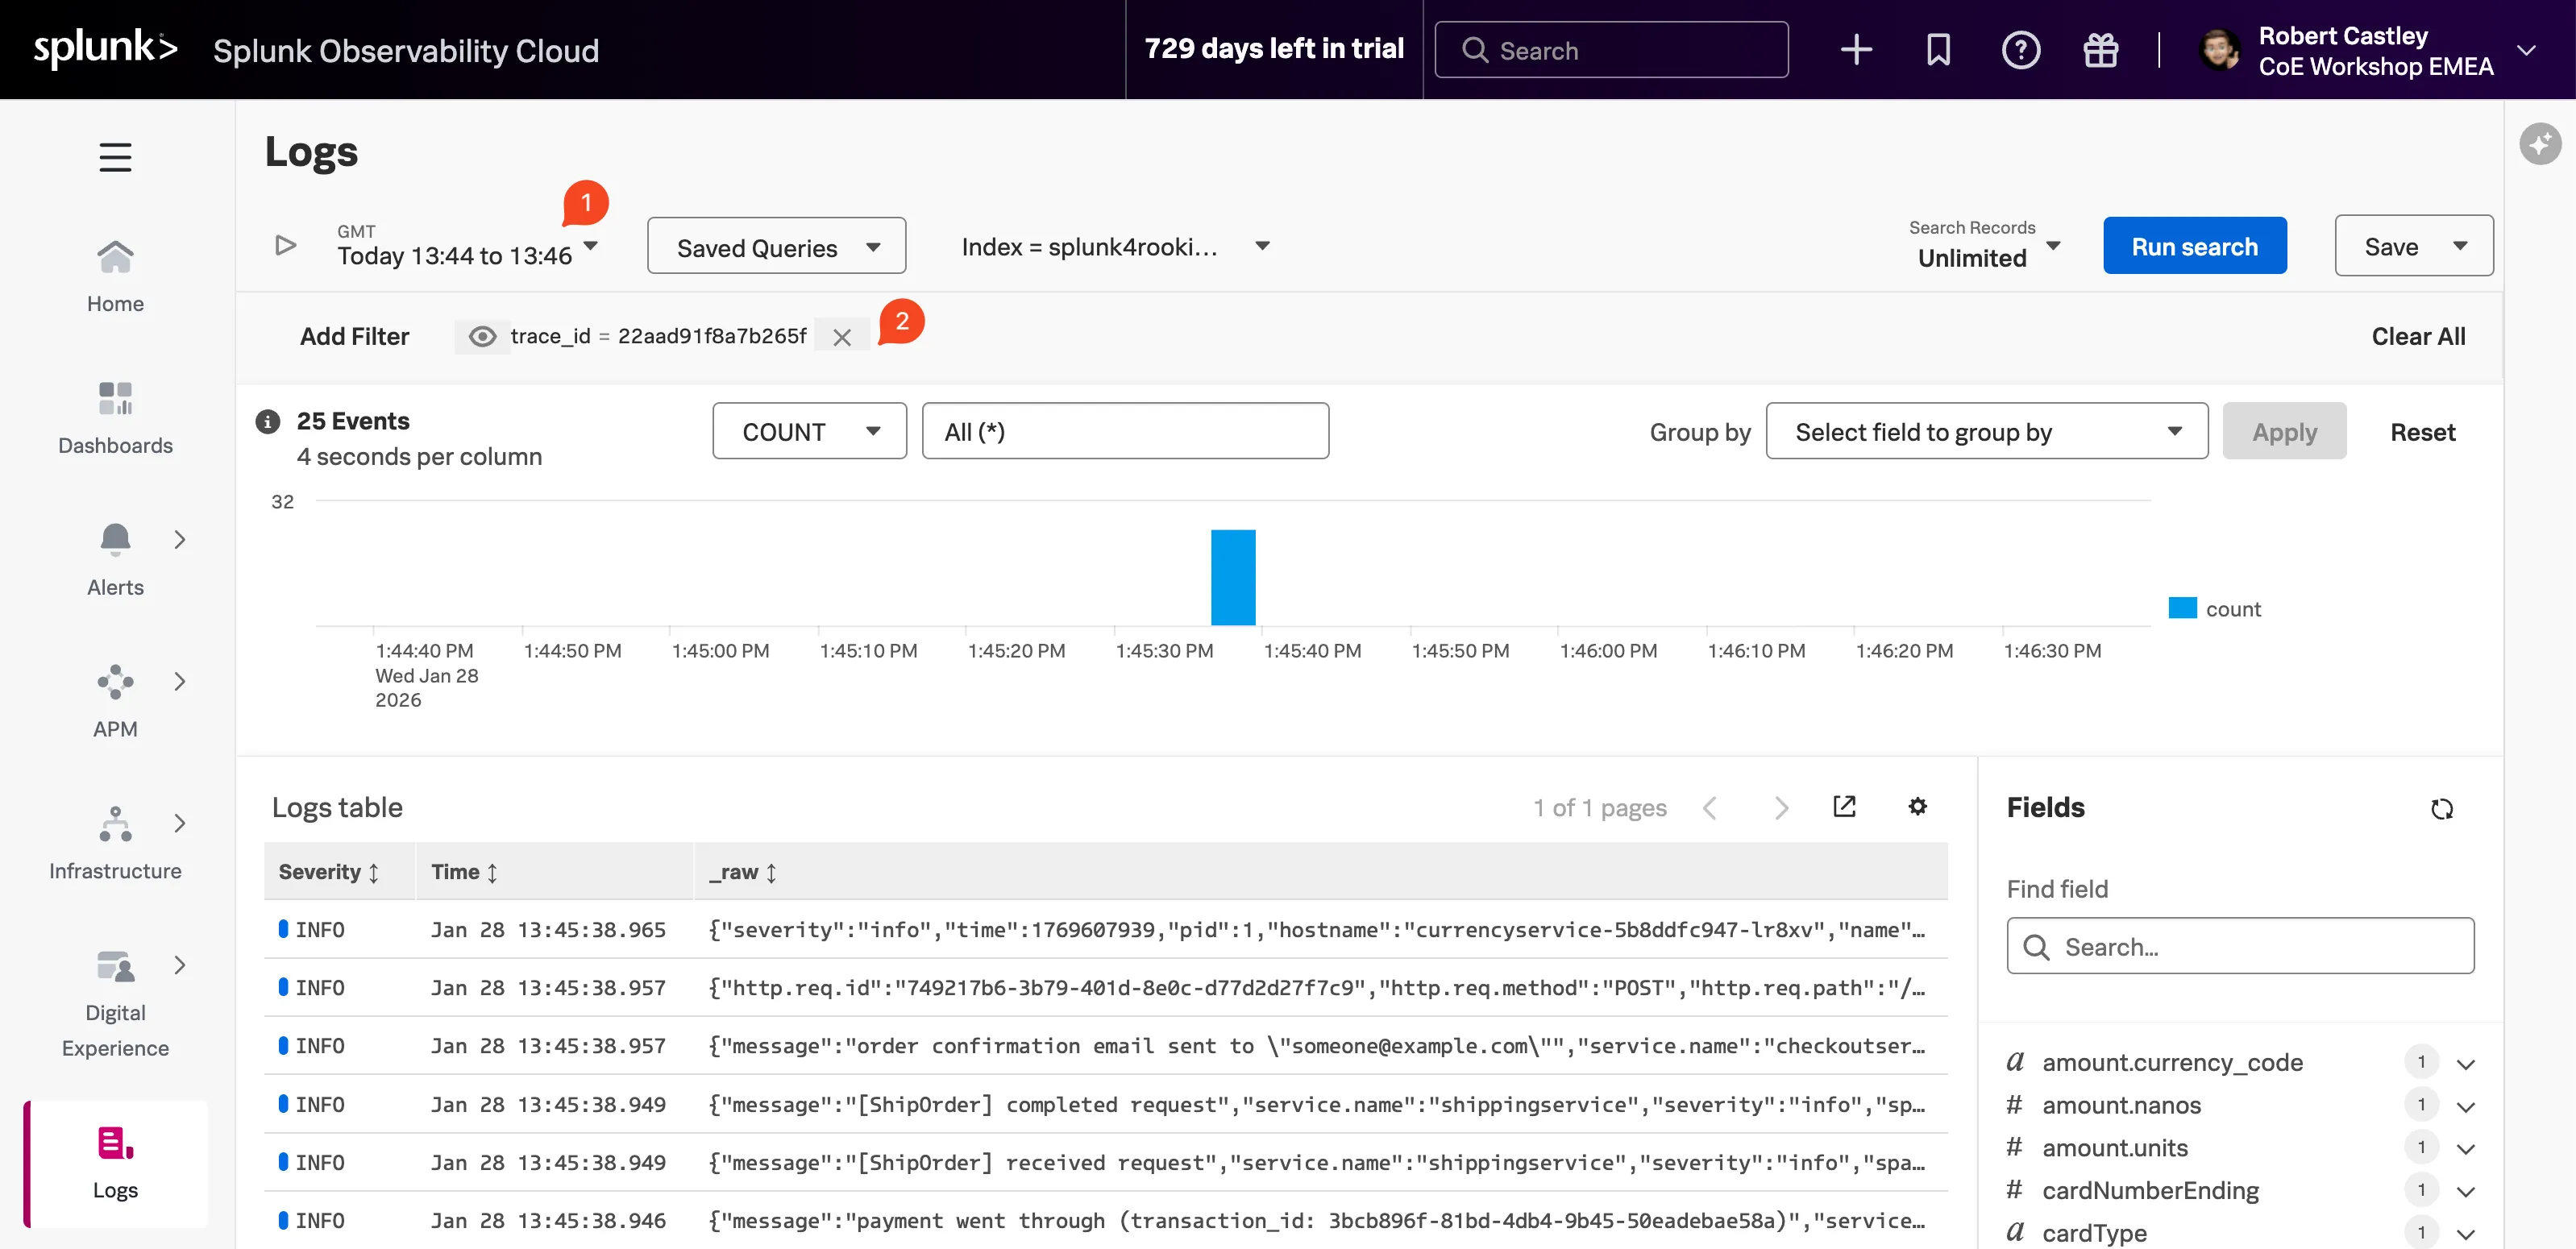
This view will include all the log lines from all services that participated in the back-end transaction started by the end-user interaction with the Online Boutique.
Even in a small application such as our Online Boutique, the sheer amount of logs found can make it hard to see the specific log lines that matter to the actual incident we are investigating.
Before we go any further, let’s quickly recap what we have done so far and why we are here based on the 3 pillars of Observability:
| Metrics | Traces | Logs |
|---|---|---|
| Do I have a problem? | Where is the problem? | What is the problem? |
- Using RUM metrics we identified we have a problem with our application. This was obvious from the duration metrics for the user sessions.
- Using traces and span tags we found where the problem is. The paymentservice comprises two versions,
v350.9andv350.10, and the error rate was 100% forv350.10. - We did see that this error from the paymentservice
v350.10caused multiple retries and a long delay in the response back from the Online Boutique checkout. - From the trace, using the power of Related Content, we arrived at the log entries for the failing paymentservice version. Now, we can determine what the problem is.