Observability Cloud (Shortened 1h)

60 minutes   Authors Robert Castley & Pieter Hagen

Introduction

Gain hands-on experience troubleshooting issues using Splunk Observability Cloud. You’ll work with a fully instrumented microservices application on Kubernetes that sends metrics, traces, and logs for real-time analysis.

Workshop Overview

In this 1-hour hands-on session, you’ll cover:

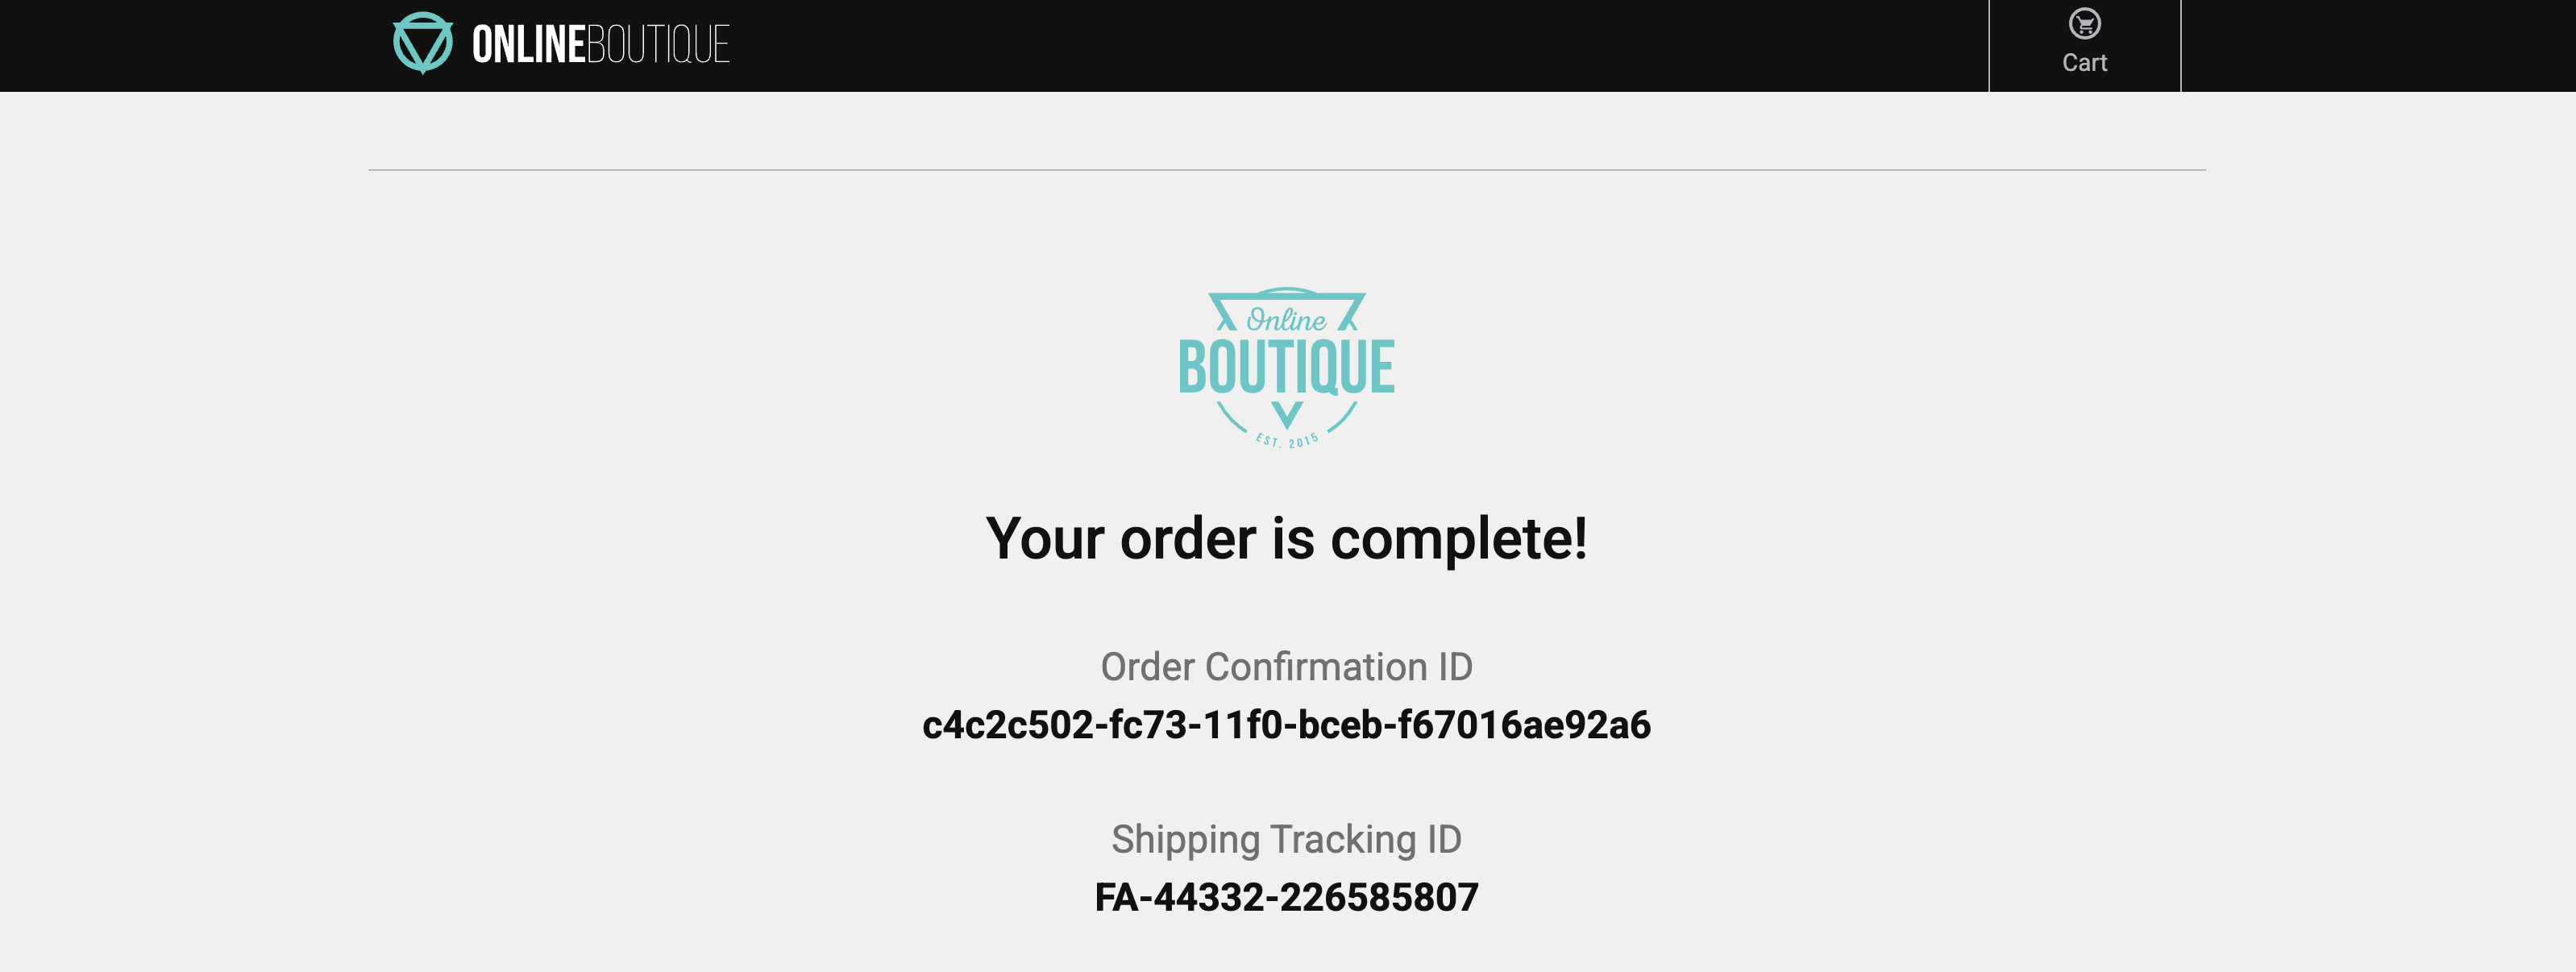
  • Generate Real User Data - Browse the Online Boutique website to generate metrics, traces, and logs
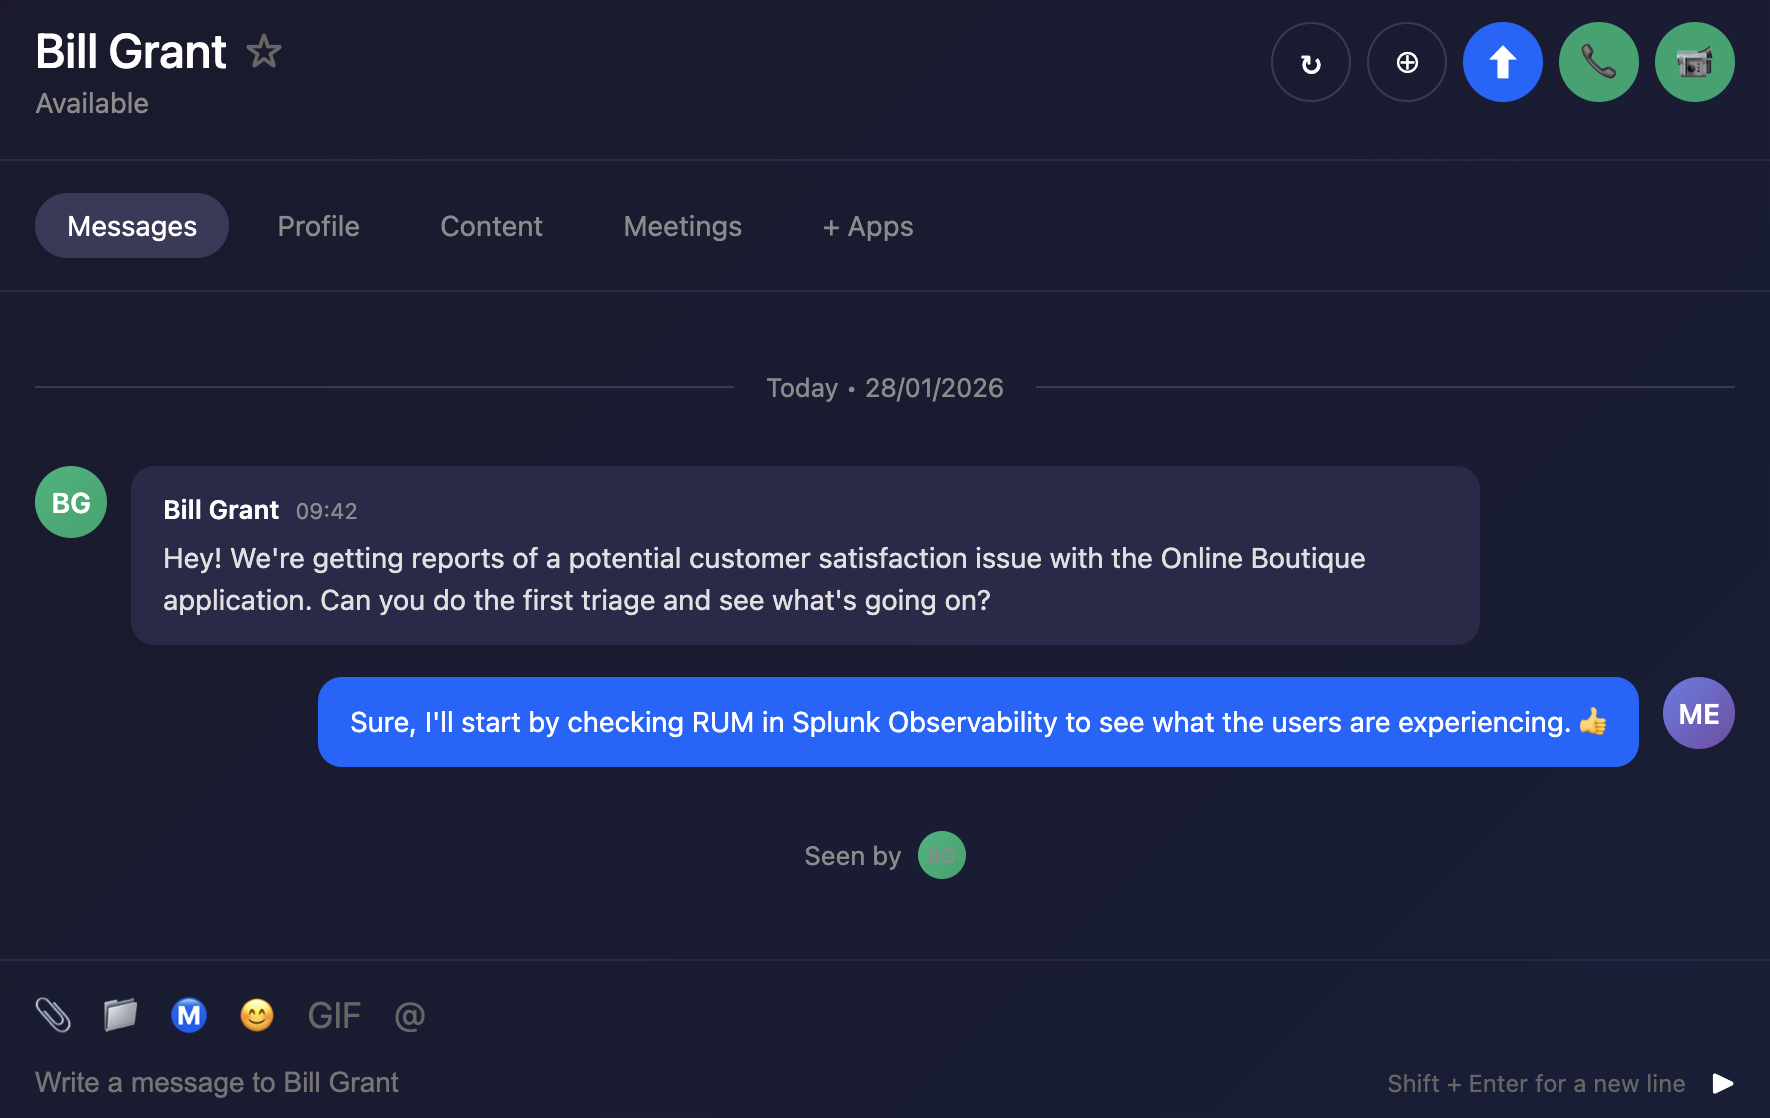
  • RUM - Identify poorly performing browser sessions and begin troubleshooting
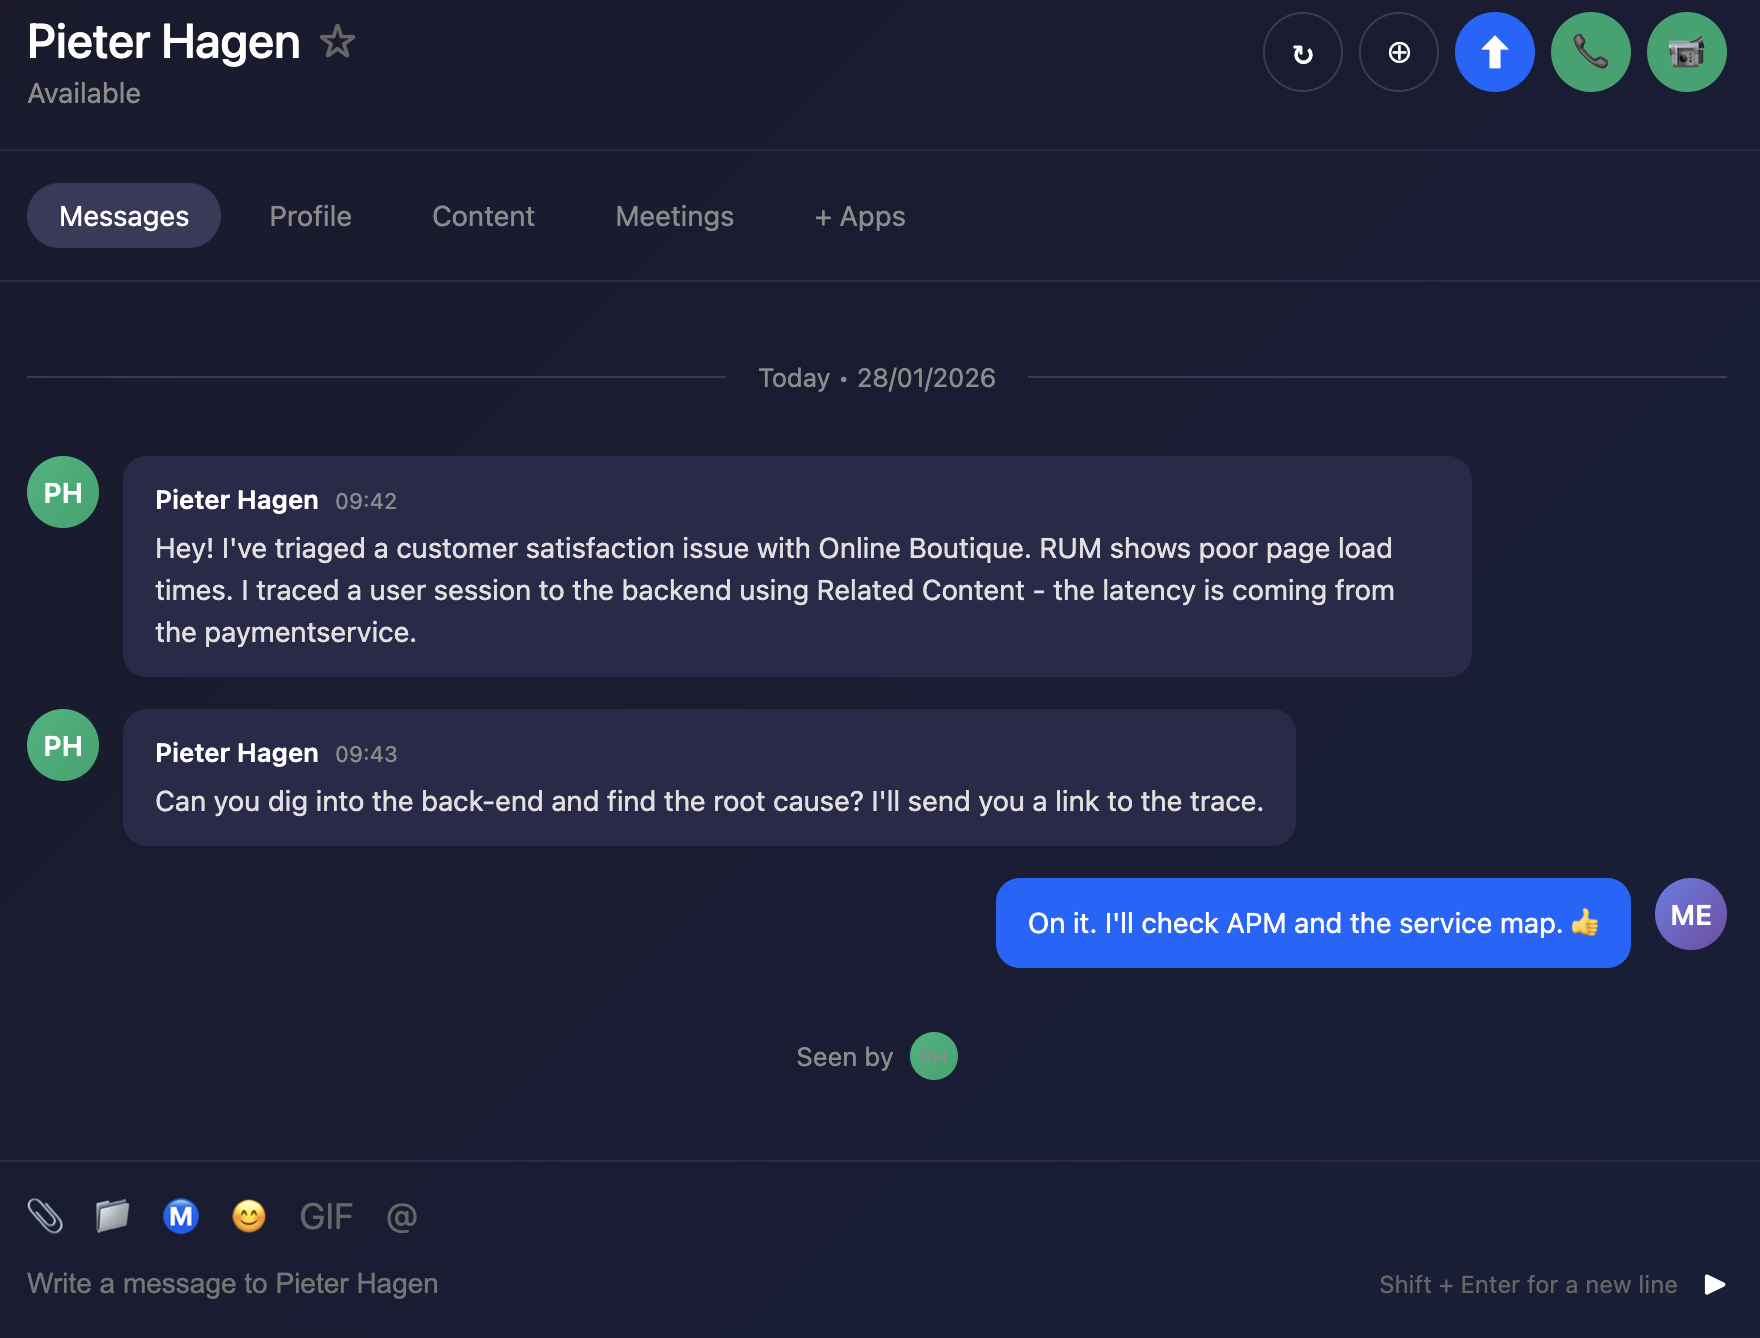
  • APM - Link front-end RUM traces to back-end APM traces to detect anomalies and errors
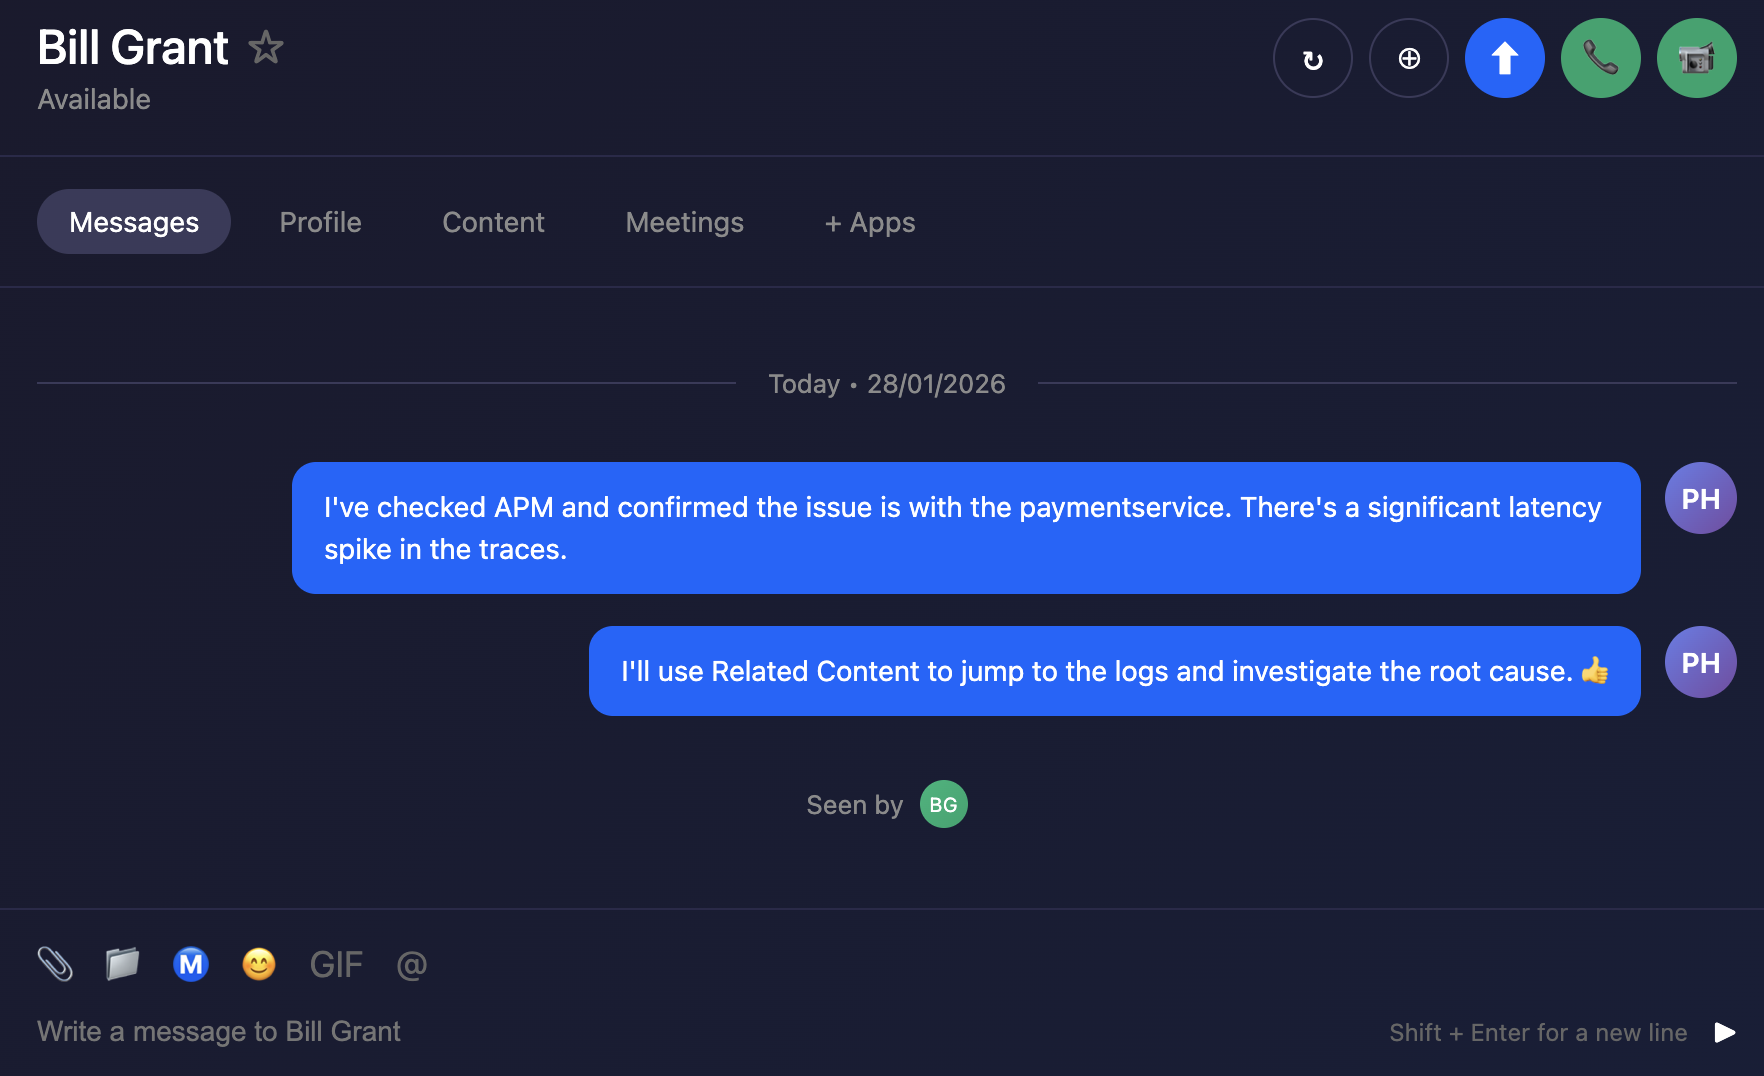
  • Log Observer - Use “Related Content” to navigate from APM traces to related logs
  • Synthetics - Set up 24/7 monitoring with synthetic tests running every minute

Full Stack Full Stack

Let’s go shopping!

Last Modified Feb 17, 2026

Subsections of Observability Cloud (Shortened 1h)

Login to Splunk Observability Cloud

5 minutes  

We are going to examine the real user data that has been provided by the telemetry received from all workshop attendees’ browser sessions. The goal is to find a browser, mobile or tablet session that performed poorly and begin the troubleshooting process.

Exercise
  • You should have received an e-mail from Splunk inviting you to the Workshop Org. If you cannot find it, please check your Spam/Junk folders or inform your Instructor.
  • To proceed click the Join Now button or click on the link provided in the e-mail.
  • If you have already completed the registration process you can skip the rest and proceed directly to Splunk Observability Cloud and log in:

login login

  • You will land on the home page of Splunk Observability Cloud.
Last Modified Feb 17, 2026

Let's go shopping 💶

5 minutes  
Persona

You are a hip urban professional, longing to buy your next novelty items in the famous Online Boutique shop. You have heard that the Online Boutique is the place to go for all your hipster needs.

The purpose of this exercise is for you to interact with the Online Boutique web application. This is a sample application that is used to demonstrate the capabilities of Splunk Observability Cloud. The application is a simple e-commerce site that allows you to browse items, add them to your cart, and then checkout. You will experience some issues and use the data you generate to identify the root cause of that issue.
Exercise - Let’s go shopping
  • The application is pre-deployed — your instructor will provide a link to the Online Boutique website (e.g. http://<s4r-workshop-i-xxx.splunk>.show:81/). Ports 80 and 443 are also available if port 81 is unreachable.
  • Browse the Online Boutique, add a few items to your cart, and complete a checkout.
  • Repeat this at least 3–5 times to surface the performance issues deliberately built into the application.

The whole checkout process is only supposed to take milliseconds. Did you notice anything about the checkout process?

Slow! 🐌

  • When the checkout process is slow, it creates a frustrating user experience. Because this directly impacts customer satisfaction, we should prioritise investigating and resolving the issue.

Online Boutique Online Boutique

Let’s go to the next page where we will start using Splunk Observability Cloud and take a look at what the data looks like in Splunk Real User Monitoring (RUM).

Last Modified Feb 17, 2026

Digital Experience (RUM)

15 minutes  
Persona

You are a frontend engineer, or an SRE tasked to do the first triage of a performance issue. You have been asked to investigate a potential customer satisfaction issue with the Online Boutique application.

We are going to look at the Real User Monitoring (RUM) data generated by you and your fellow attendees while using the Online Boutique. The goal is to find a browser, mobile or tablet session that performed poorly and begin the troubleshooting process.

Messages Messages

Last Modified Feb 17, 2026

Subsections of 3. Digital Experience (RUM)

1. RUM Overview

Exercise
  • In Splunk Observability Cloud, from the main menu, hover over Digital Experience, then click on Overview (1) from the Real User Monitoring section as shown below.

RUM RUM

  • This will open up the Application Summary Dashboard. This section shows a quick overview of all the applications being monitored.

  • The Real User Monitoring (RUM) Overview dashboard in Splunk Observability Cloud provides visibility into how real users experience your web applications. It captures browser-side performance metrics, JavaScript errors, and network request failures as they occur in actual user sessions. The dashboard surfaces Core Web Vitals (LCP, INP, CLS) to measure page load performance, displays error trends over time, and shows recent alerts, giving frontend teams the insights needed to identify and resolve issues affecting end-user experience.

  • To ensure we are looking at the right data, please check the following settings (2):

    • The Time frame is set to -15m.
    • The Environment selected is [NAME OF WORKSHOP]-workshop.
    • The App selected is [NAME OF WORKSHOP]-store.
    • The Source is set to Browser.
  • Next, click on the [NAME OF WORKSHOP]-store (3) above the Page Views / JavaScript Errors chart.

main page main page

Last Modified Feb 17, 2026

2. Application View

Exercise
  • You will now see a dashboard view breaking down the metrics by UX Metrics, Front-end Health, Back-end Health, Custom Events, Network Requests, Pages and a Map View comparing them to historic metrics (1 hour by default).

RUM Dashboard RUM Dashboard

  • The tabs available on this page include:

    • UX Metrics Page Views, Page Load and Web Vitals metrics
    • Front-end Health Breakdown of JavaScript Errors and Long Task duration and count
    • Back-end Health Network Errors and Requests and Time to First Byte
    • Custom Events RED metrics (Rate, Error & Duration) for custom events
    • Network Requests Network URL grouping and key metrics
    • Pages URL grouping and key metrics and web vitals
    • Map View Geographical requests by location
  • Click through each of the tabs and examine the data.

  1. If you examine the charts in the Custom Events tab, what chart shows clearly the latency spikes?
  2. In the Map View tab, where is the largest request volume coming from?
  1. Custom Event Latency P75
  2. Ireland
  • Make sure you are on the Custom Events tab.
  • To identify problematic user sessions, we will use the latency spikes in the Custom Event Latency P75 chart.
  • In the Custom Event Latency chart click on the see all (1) link under the chart title.

RUM See All RUM See All

Last Modified Feb 17, 2026

3. Tag Spotlight

Exercise
  • This dashboard displays all tags associated with the RUM data, key-value pairs automatically generated by the RUM instrumentation. Tags are used to filter data and build charts and tables. The Tag Spotlight view lets you drill down into individual user sessions.

RUM Tag Spotlight RUM Tag Spotlight

  • Change the timeframe to Last 1 hour (1).
  • Find the Operation chart, locate PlaceOrder in the list, click on it and select Add to filter (2).

  • Click on the User Sessions tab (3).

  • Click on the Duration heading twice to sort the sessions by duration (longest at the top) (4).

  • We now have a User Session table sorted by longest duration (descending), showing users who have been shopping on the site. We could apply more filters to further narrow down the data, e.g. OS version, browser version, etc.

RUM Tag Spotlight RUM Tag Spotlight

Last Modified Feb 17, 2026

4. User Sessions

A User Session in RUM represents a single user’s complete interaction with your web application from the moment they arrive until they leave or become inactive. Each session captures a timeline of all page views, user interactions (clicks, scrolls, form submissions), network requests, errors, and performance metrics.

Sessions are identified by a unique Session ID and include metadata such as browser type, device, geographic location, and custom tags. This allows you to replay and analyze the exact experience a specific user had, making it invaluable for troubleshooting issues, understanding user behavior, and identifying performance bottlenecks.

Exercise
  • In the User Sessions table, click on the Session ID with the longest Duration (over 15 seconds or longer). This will take you to the RUM Session view.
  • Note the length of the span PlaceOrder, this is the time it took to complete the order. Not good!

RUM Session RUM Session

  • Look for the Fetch (1) which will be either above or below the PlaceOrder span.
    • It will look something like POST https://labob...y.com/cart/checkout.
  • Hover over the blue APM (2), after a few seconds a popup will appear.
  • You will see paymentservice and checkoutservice are in an error state as per the screenshot above.
  • Under Workflow Name click on front-end:/cart/checkout (3), this will bring up the APM Service Map. Here we will investigate the backend services and their dependencies to identify the root cause of the issue.

RUM Session RUM Session

Last Modified Feb 17, 2026

5. RUM to APM

Exercise
  • In the APM Service Map you can clearly see there is an issue with the paymentservice.

RUM to APM RUM to APM

We have now successfully navigated from RUM into APM, providing an end-to-end view of the user experience. This integration allows us to trace performance issues from the front-end all the way through to the back-end services, enabling more effective troubleshooting and optimization.

The RUM metrics initially pointed to the Checkout Service as the source of the problem. Without APM, teams could waste valuable time investigating this service unnecessarily. However, with APM we can quickly identify that the root cause actually lies in the paymentservice, saving valuable time and significantly reducing MTTx.

Let’s ask our friends in back-end development to continue the investigation.

Last Modified Feb 17, 2026

Application Performance Monitoring (APM)

20 minutes  
Persona

You are a back-end developer and you have been called in to help investigate an issue found by the SRE. The SRE has identified a poor user experience and has asked you to investigate the issue.

Discover the power of full end-to-end visibility by jumping from a RUM trace (front-end) to an APM trace (back-end). All the services are sending telemetry (traces and spans) that Splunk Observability Cloud can visualize, analyze and use to detect anomalies and errors.

RUM and APM are two sides of the same coin. RUM is the client-side view of the application and APM is the server-side view. In this section, we will use APM to drill down and identify where the problem is.

Messages Messages

Last Modified Feb 17, 2026

Subsections of 4. APM

1. APM Service Map

The APM Service Map displays the dependencies and connections among your instrumented and inferred services in APM. The map is dynamically generated based on your selections in the time range, environment, workflow, service, and tag filters.

When we clicked on the APM link in the RUM waterfall, filters were automatically added to the service map view to show the services that were involved in that WorkFlow Name (frontend:/cart/checkout).

You can see the services involved in the workflow in the Service Map. In the side pane, charts for the selected workflow are displayed. When you select a service in the Service Map, the charts in the side pane are updated to show metrics for the selected service.

Exercise
  • Click on the paymentservice in the Service Map to select it.

APM Explore APM Explore

With the paymentservice selected, what can you conclude from the Service Requests & Errors chart in the side pane? (1)

The Errors percentage is very high.

  • Splunk APM also provides built-in Service Centric Views to help you see problems occurring in real time and quickly determine whether the problem is associated with a service, a specific endpoint, or the underlying infrastructure. Let’s have a closer look.
  • In the right-hand pane, click on paymentservice in blue (2).
Last Modified Feb 17, 2026

2. APM Service View

Service View

As a service owner you can use the service view in Splunk APM to get a complete view of your service health in a single pane of glass. The service view includes a service-level indicator (SLI) for availability, dependencies, request, error, and duration (RED) metrics, runtime metrics, infrastructure metrics, Tag Spotlight, endpoints, and logs for a selected service. You can also quickly navigate to code profiling and memory profiling for your service from the service view.

Exercise
  • Check the Time box, you can see that the dashboards only show data relevant to the time it took for the APM trace we previously selected to complete (note that the charts are static).
  • In the Time box change the timeframe to -1h (1).

Service Dashboard Service Dashboard

  • You can clearly see the Success rate is not 100%, this is because we have errors in our service.
  • We need to understand if there is a pattern to this error rate. We have a handy tool for that, click on the Tag Spotlight tab (2).
Last Modified Feb 17, 2026

3. APM Tag Spotlight

Exercise
  • Once in Tag Spotlight ensure the toggle Show tags with no values is off.

APM Tag Spotlight APM Tag Spotlight

  • This view displays a series of cards, each representing an indexed tag (such as Endpoint, Environment, Version, or custom tags like tenant.level). Within each card, you can see the distribution of tag values along with key metrics including request count, error count, root cause errors, and latency percentiles (P50, P90, P99).

Which card exposes the tag that identifies what the problem is?

The version card. The number of requests against v350.10 matches the number of errors i.e. 100%

  • Now that we have identified the tag that indicates the issue, let’s see if we can find out more information about the error.
  • Click the APM link above paymentservice at the top of the page to return to the APM Overview.
  • In APM Overview, click on Service Map in the right-hand pane.
Last Modified Feb 17, 2026

4. APM Service Breakdown

Exercise
  • Select the paymentservice in the Service Map.
  • In the right-hand pane click on the Breakdown.
  • Select version in the list.

What can you conclude from what you are seeing?

There are no errors for v350.9, but v350.10 clearly has a problem.

APM Service Breakdown APM Service Breakdown

Span Tags

Using span tags to break down services is a very powerful feature. It allows you to see how your services are performing for different customers, different versions, different regions, etc. In this exercise, we have determined that v350.10 of the paymentservice is causing problems.

  • Next, we need to drill down into a trace to see what is going on. Click on the red circle for v350.10 (1) in the paymentservice, then click on the Traces (2) tab in the right-hand pane.
Last Modified Feb 17, 2026

5. APM Trace Analyzer

We have arrived at the Trace Analyzer.

Trace Analyzer is a powerful tool in Splunk APM designed for exploring and analyzing distributed traces at scale. Because Splunk APM captures every trace with full-fidelity (NoSample), you have complete visibility into all transactions flowing through your services.

Trace Analyzer enables you to:

  • Search with high-cardinality tags: Filter traces using any indexed span tag, such as customer IDs, order IDs, or custom business attributes.
  • Visualize trace patterns: View trace and error counts over time to identify trends and anomalies.
  • Analyze latency distribution: Use the heatmap view to understand trace duration patterns and spot outliers.
  • Drill down to specific traces: Quickly find the exact trace you need, whether investigating a customer complaint or debugging a specific transaction.

This makes Trace Analyzer ideal for investigating unknown issues, researching specific transactions, and performing root cause analysis when you need to find a needle in a haystack.

Exercise

APM Trace Analyzer APM Trace Analyzer

  • Find a trace with:
    • an error in the checkoutservice and the paymentservice (1)
    • and an Initiating Operation of frontend: POST /cart/checkout
    • then select the blue Trace ID (2) to continue
  • This will open the Trace Waterfall for that specific trace.
Last Modified Feb 17, 2026

6. APM Waterfall

The Trace Waterfall view displays all spans within a trace as a hierarchical timeline. Each span appears as a horizontal bar, with the bar’s length representing its duration and its position showing when it occurred relative to other spans.

A trace is a collection of spans that share the same trace ID, representing a unique transaction handled by your application and its constituent services.

A span represents a single unit of work within a trace, capturing information about a specific operation such as an API call, database query, or service request. Each span includes metadata like the operation name, start time, duration, and associated tags or attributes that provide context about the work being performed.

Exercise
  • Click on the ! next to any of the paymentservice:grpc.hipstershop.PaymentService/Charge spans in the waterfall.

Trace Waterfall Trace Waterfall

What is the error message and version being reported in the Span Details?

Invalid request and v350.10.

Last Modified Feb 17, 2026

7. APM to Logs

Exercise

Now that we have identified the version of the paymentservice that is causing the issue, let’s see if we can find out more information about the error. This is where Related Logs come in.

Related Content relies on specific metadata that allows APM, Infrastructure Monitoring, and Log Observer to pass filters around Observability Cloud. For related logs to work, you need to have the following metadata in your logs:

  • service.name

  • deployment.environment

  • host.name

  • trace_id

  • span_id

  • At the very bottom of the Trace Waterfall click on Logs. This highlights that there are Related Logs for this trace.

  • Click on the Logs for trace xxx entry in the pop-up, this will open the logs for the complete trace in Logs.

Related Logs Related Logs

  • Next, let’s find out more about the error in the logs.
Last Modified Feb 17, 2026

Logs

20 minutes  
Persona

Remaining in your back-end developer role, you need to inspect the logs from your application to determine the root cause of the issue.

Using the content related to the APM trace (logs) we will now use Logs to drill down further to understand exactly what the problem is. Related Content is a powerful feature that allows you to jump from one component to another and is available for metrics, traces and logs.

Messages Messages

Last Modified Feb 17, 2026

Subsections of 5. Logs

1. Introduction to Logs

You’ve now navigated directly from an APM trace into Logs using the Related Content link. Logs is Splunk Observability Cloud’s no-code interface for exploring and analyzing log data.

The key advantage, just as with the RUM and APM integration, is that you’re viewing your logs in the context of your previous actions. In this case, that context includes the matching time range (1) from the trace and a filter (2) automatically applied to the trace_id.

Trace Logs Trace Logs

This view will include all the log lines from all services that participated in the back-end transaction started by the end-user interaction with the Online Boutique.

Even in a small application such as our Online Boutique, the sheer amount of logs found can make it hard to see the specific log lines that matter to the actual incident we are investigating.

Before we go any further, let’s quickly recap what we have done so far and why we are here based on the 3 pillars of Observability:

MetricsTracesLogs
Do I have a problem?Where is the problem?What is the problem?
  • Using RUM metrics we identified we have a problem with our application. This was obvious from the duration metrics for the user sessions.
  • Using traces and span tags we found where the problem is. The paymentservice comprises two versions, v350.9 and v350.10, and the error rate was 100% for v350.10.
  • We did see that this error from the paymentservice v350.10 caused multiple retries and a long delay in the response back from the Online Boutique checkout.
  • From the trace, using the power of Related Content, we arrived at the log entries for the failing paymentservice version. Now, we can determine what the problem is.
Last Modified Feb 17, 2026

2. Log Filtering

Exercise
  • We need to focus on just the Error messages in the logs:
  • Click on the Group By (1) drop-down box and use the filter to find severity.
  • Once selected click the Apply button (notice that the chart legend changes to show debug, error and info).

legend legend

  • Selecting just the error logs can be done by either clicking on the word error (2) in the legend, followed by selecting Add to filter. Then click Run Search at the top of the page.

Error Logs Error Logs

Next, we will look at log entries in detail.

Last Modified Feb 17, 2026

3. Viewing Log Entries

Exercise
  • Click on an error entry in the log table (make sure it says hostname: "paymentservice-xxxx" in case there is a rare error from a different service in the list too).

Based on the message, what would you tell the development team to do to resolve the issue?

The development team needs to rebuild and deploy the container with a valid API Token or rollback to v350.9.

Log Message Log Message

  • Click on the X in the log message pane to close it.
Congratulations

You have successfully used Splunk Observability Cloud to understand why you experienced a poor user experience whilst shopping at the Online Boutique. You used RUM, APM and logs to understand what happened in your service landscape and subsequently, found the underlying cause, all based on the 3 pillars of Observability, metrics, traces and logs.

You also learned how to use Splunk’s intelligent tagging and analysis with Tag Spotlight to detect patterns in your applications’ behavior and to use the full stack correlation power of Related Content to quickly move between the different components whilst keeping in context of the issue.

In the next part of the workshop, we will move from problem-finding mode into mitigation, prevention and process improvement mode.

Last Modified Feb 17, 2026

Digital Experience (Synthetics)

15 minutes  
Persona

Putting your SRE hat back on, you have been asked to set up monitoring for the Online Boutique. You need to ensure that the application is available and performing well 24 hours a day, 7 days a week.

Wouldn’t it be great if we could have 24/7 monitoring of our application, and be alerted when there is a problem? This is where Synthetics comes in. We will show you a simple test that runs every 1 minute and checks the performance and availability of a typical user journey through the Online Boutique.

Messages Messages

Last Modified Feb 17, 2026

Subsections of 6. Digital Experience (Synthetics)

1. Synthetics Dashboard

Exercise
  • In Splunk Observability Cloud from the main menu, click on Digital Experience → Synthetics tests. Click on All or Browser tests to see the list of active tests.

  • During our investigation in the RUM section, we found there was an issue with the Place Order Transaction. Let’s see if we can confirm this from the Synthetics test as well.


  • In the Search box, enter [NAME OF WORKSHOP] to filter the tests for this workshop.

  • Select the test.

  • Click on Go to all run results.

  • Change All to Failure (1).

    Transaction Filter Transaction Filter

  • Click on one of the failed results.

Last Modified Feb 17, 2026

2. Synthetics Test Detail

Exercise
  • Now we are looking at the result of a single Synthetic Browser Test.

waterfall waterfall

  • By default, Splunk Synthetics provides screenshots and video capture of the test. This is useful for debugging issues. You can see, for example, the slow loading of large images, the slow rendering of a page, etc.

  • Use your mouse to scroll left and right through the filmstrip to see how the site was being rendered during the test run.

  • In the Video pane, press on the play button (1) to see the test playback.

  • Using the filter above the filmstrip, under the heading Filter by a synthetic transaction, page, or step (2), click on Place Order under Synthetic transactions.

Last Modified Feb 17, 2026

3. Synthetics to APM

Exercise
  • In the waterfall find an entry that starts with POST checkout. If you don’t see that, go back and select another failed run result from the Run results page.

Place Order Place Order

  • Click on the > (1) to open the metadata section. Observe the metadata that is collected, and note the server-timing header under Response Headers. This header is what allows us to correlate the test run to a back-end trace.
  • Click on the blue APM (2) link on the POST checkout line in the waterfall.

APM trace APM trace

  • Validate you see one or more errors for the paymentservice (1).
  • To validate that it’s the same error, click on the related content for Logs (2).
  • Repeat the earlier exercise to filter down to the errors only.
  • View the error log to validate the failed payment due to an invalid token.
Last Modified Feb 17, 2026

4. Synthetics Detector

Given you can run these tests 24/7, it is an ideal tool to get warned early if your tests are failing or starting to run longer than your agreed SLA—instead of getting informed by social media or uptime websites.

Social media Social media

To stop that from happening, let’s detect if our test is taking more than 50 seconds.

Last Modified Feb 17, 2026

5. Create Detector

Exercise
  • Go to Digital Experience → Synthetics tests from the main menu.
  • Select the workshop test [NAME OF WORKSHOP].
  • Click on the test.
  • Click Create Detector button at the top of the page:
  • Change the alert criteria so that the metric is Run Duration (1) (instead of Uptime) and the condition is Static Threshold.
  • Set the Trigger threshold (2) to be around 50000 ms.
  • Set Split by location (3) to No.
  • Note that there is now a row of red and white triangles appearing below the spikes in the chart.
  • The red triangles let you know that your detector found that your test was above the given threshold and the white triangle indicates that the result returned below the threshold. Each red triangle will trigger an alert.
We will not add a recipient or activate the detector as we don’t want to flood your email with alerts.

synth detector synth detector

  • This application is designed to fail constantly, hence the large number of alerts that would be generated. In a real-world scenario, you would want to fine-tune the threshold to avoid false positives.
Last Modified Feb 17, 2026

Workshop Wrap-up 🎁

1 minute  

Congratulations, you have completed the Cisco Live Walk in Lab Splunk4Rookies - Observability Cloud Workshop. Today, you have become familiar with how to use Splunk Observability Cloud to monitor your applications and infrastructure.

Celebrate your achievement by adding this certificate to your LinkedIn profile.

Champagne Champagne