Observability Cloud (2 hours)
Explore the full stack in two hours, from user experience to infrastructure.
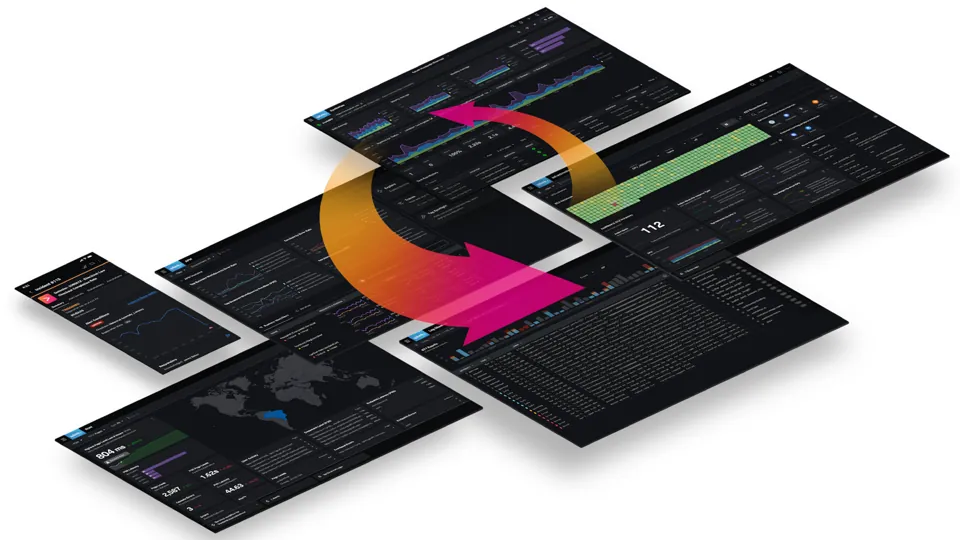
In this workshop, we’ll demonstrate how Splunk Observability Cloud delivers instant visibility into the user experience—covering everything from front-end applications to back-end services. You’ll have the opportunity to explore some of the platform’s most powerful features, which set it apart from other observability solutions:
- Infrastructure Monitoring
- Full-fidelity Real User Monitoring (RUM)
- Complete end-to-end trace visibility with NoSample Full-fidelity Application Performance Monitoring (APM)
- No-code log querying
- Synthetic Monitoring
- Root cause analysis with tag analytics and error stacks
- Related Content for seamless navigation between components
One of the core strengths of Splunk Observability Cloud is its ability to unify telemetry data, creating a comprehensive picture of both the end-user experience and your entire application stack.
The workshop will focus on a microservices-based e-commerce application deployed on AWS EC2 instances. Users can browse products, add items to a cart, and complete purchases. This application is fully instrumented with OpenTelemetry to capture detailed performance data.
What is OpenTelemetry?
OpenTelemetry is an open-source collection of tools, APIs, and software development kits (SDKs) designed to help you instrument, generate, collect, and export telemetry data—such as metrics, traces, and logs. This data enables in-depth analysis of your software’s performance and behavior.
The OpenTelemetry community is growing rapidly, supported by leading companies like Splunk, Google, Microsoft, and Amazon. It currently has the second-largest number of contributors within the Cloud Native Computing Foundation, following only Kubernetes.