Log Observer Overview
Log Observer Home Page
Click Logs in the main menu, then Log Observer. The Log Observer Home Page is made up of 4 distinct sections:
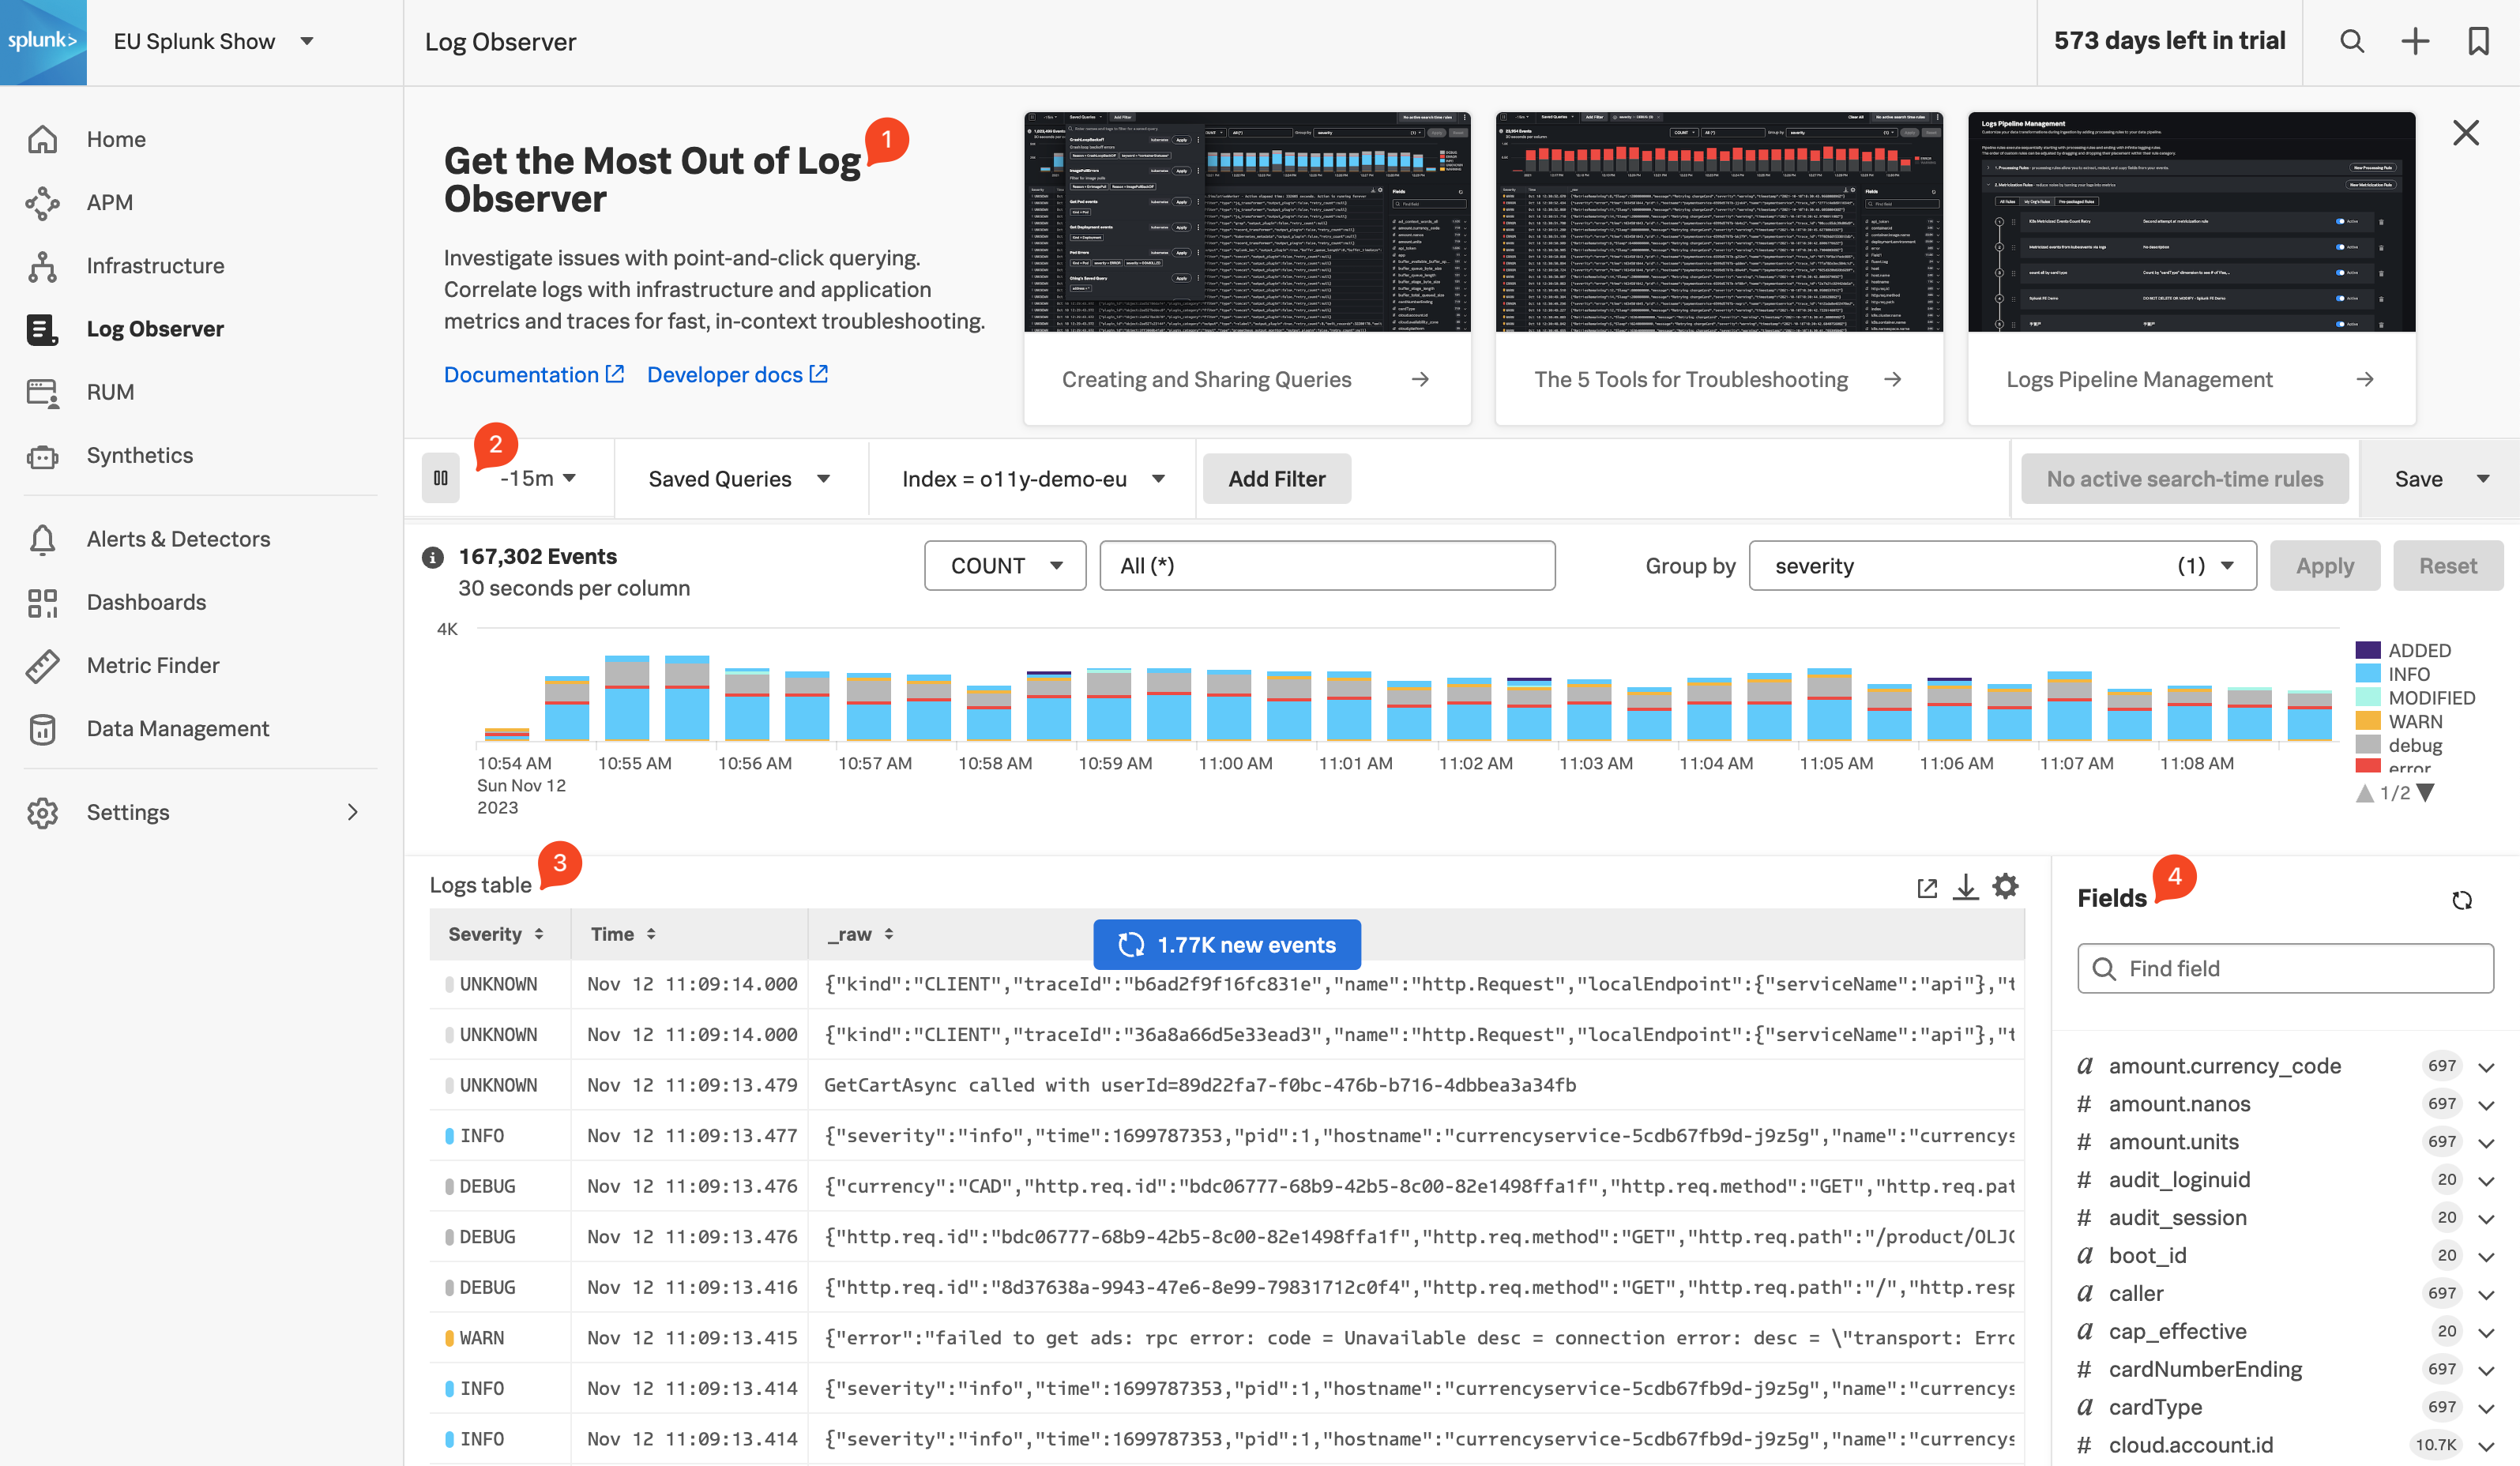
- Onboarding Pane: Training videos and links to documentation to get you started with Splunk Log Observer.
- Filter Bar: Filter on time, indexes, and fields and also Save Queries.
- Logs Table Pane: List of log entries that match the current filter criteria.
- Fields Pane: List of fields available in the currently selected index.
Splunk indexes
Tip
Let’s run a little search exercise:
Set the time frame to -15m.
Click on in the filter bar then click on Fields in the dialog.
Type in cardType and select it.
Under Top values click on visa, then click on = to add it to the filter.
Click

Click on one of the log entries in the Logs table to validate that the entry contains
cardType: "visa".Let’s find all the orders that have been shipped. Click on Clear All in the filter bar to remove the previous filter.
Click again on in the filter bar, then select Keyword. Next just type
orderin the Enter Keyword… box and press enter.Click
You should now only have log lines that contain the word
order. There are still a lot of log lines, so let’s filter some more.Add another filter, this time select the Fields box, then type
severityin the Find a field … search box and select it.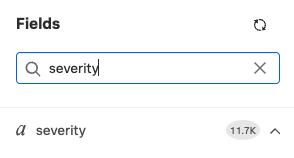
Under Top values click on error, then click on = to add it to the filter.
Click
You should now have a list of orders that failed to complete for the last 15 minutes.
Next, let’s check out Splunk Synthetics.