Splunk RUM
1. RUM Dashboard
Click Digital Experience then under Real User Monitoring click Overview in the main menu. You arrive at the RUM Home page, this view has already been covered in the short introduction earlier.
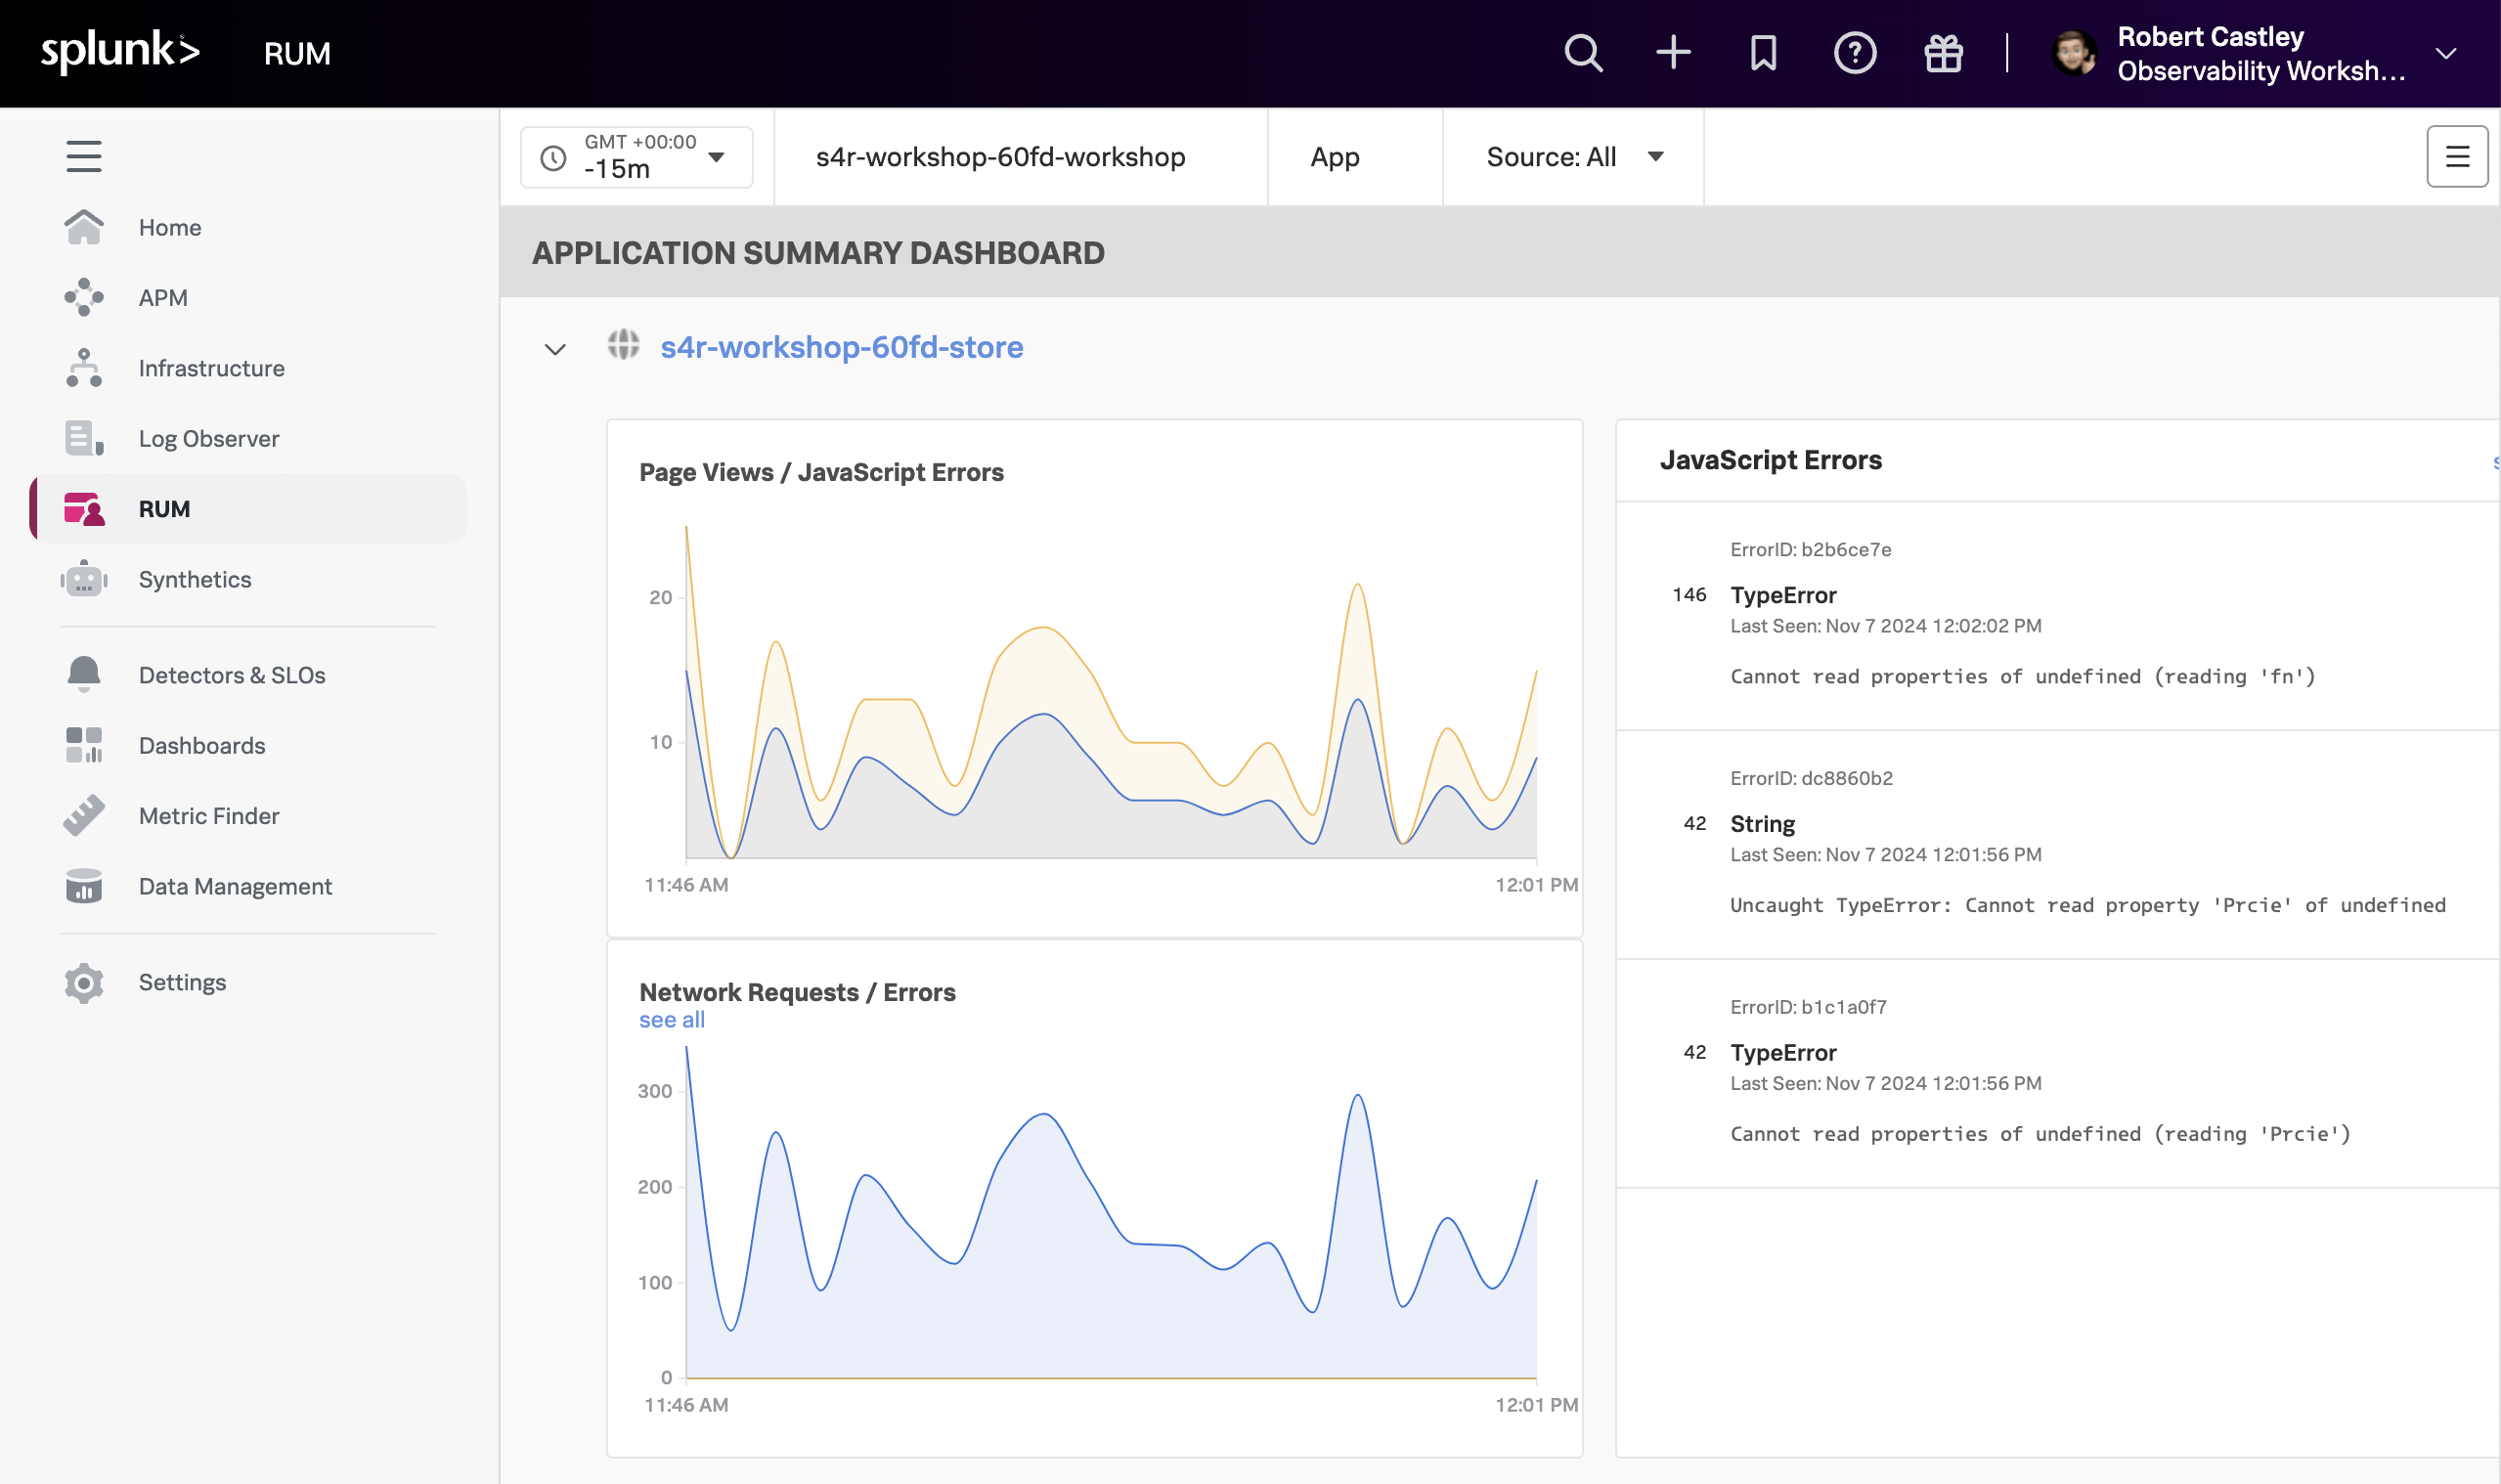
- Make sure you select your workshop by ensuring the drop-downs are set/selected as follows:
- The Time frame is set to -15m.
- The Environment selected is [NAME OF WORKSHOP]-workshop.
- The App selected is [NAME OF WORKSHOP]-store.
- The Source is set to All.
- Next, click on the [NAME OF WORKSHOP]-store above the Page Views / JavaScript Errors chart.
- This will bring up a new dashboard view breaking down the metrics by UX Metrics, Front-end Health, Back-end Health, and Custom Workflows, and comparing them to historic metrics (1 hour by default).
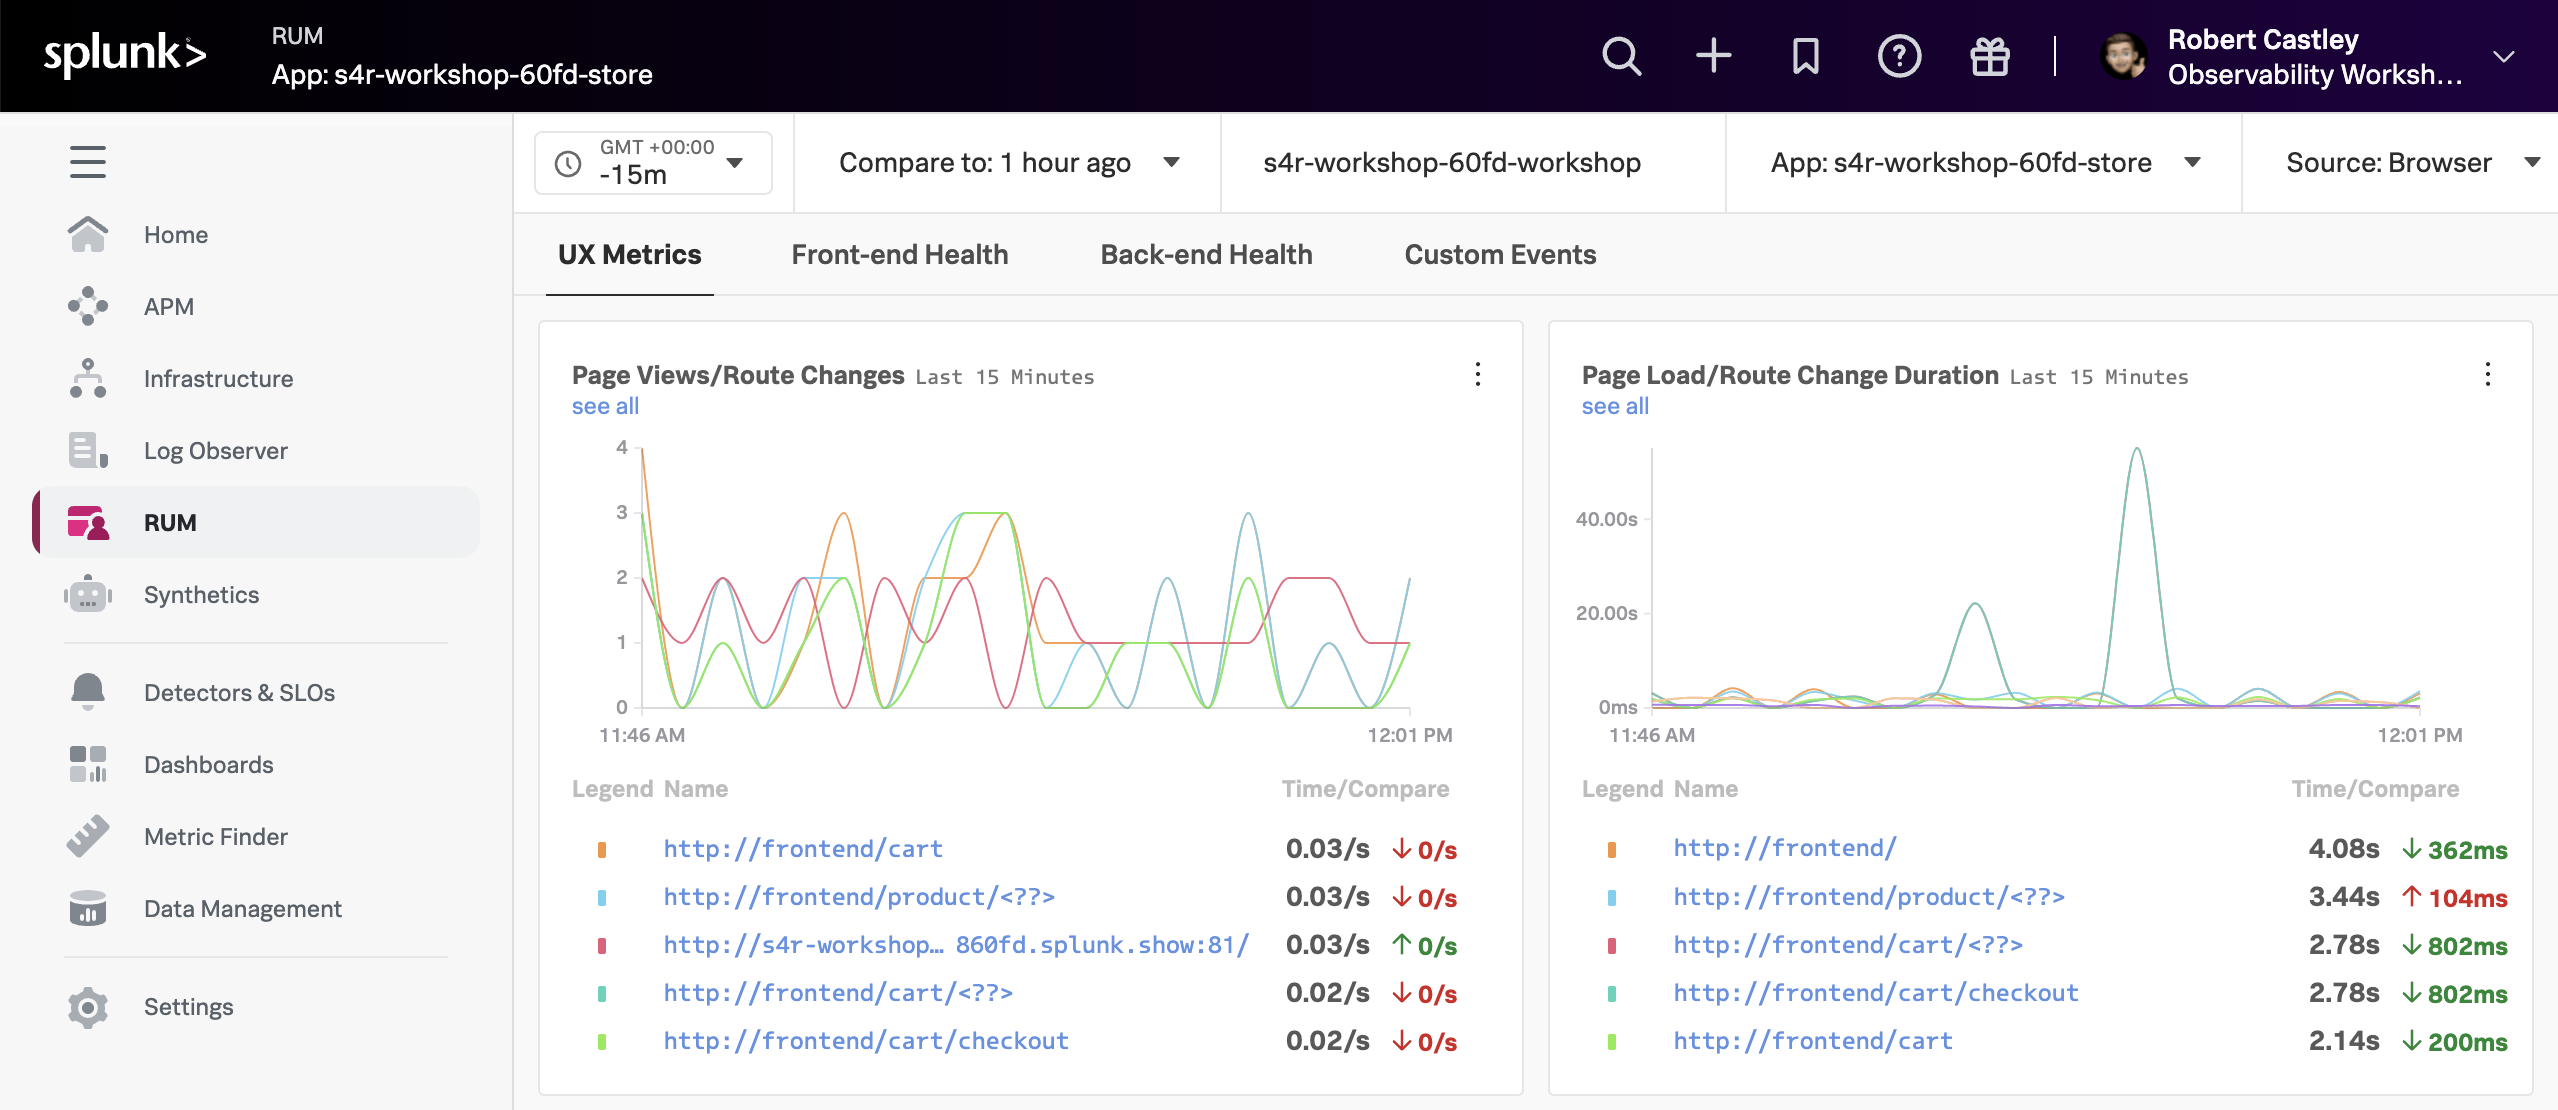
- UX Metrics: Page Views, Page Load and Web Vitals metrics.
- Front-end Health: Breakdown of Javascript Errors and Long Task duration and count.
- Back-end Health: Network Errors and Requests and Time to First Byte.
- Custom Workflows: RED metrics (Rate, Error & Duration) for custom events.
- Click through each of the tabs (UX Metrics, Front-end Health, Back-end Health and Custom Workflows) and examine the data.
If you examine the charts in the Custom Workflows Tab, what chart shows clearly the latency Spikes?
It is the Custom Workflow Duration chart