

Splunk APM
2. APM Service View
Service View
As a service owners you can use the service view in Splunk APM to get a complete view of your service health in a single pane of glass. The service view includes a service-level indicator (SLI) for availability, dependencies, request, error, and duration (RED) metrics, runtime metrics, infrastructure metrics, Tag Spotlight, endpoints, and logs for a selected service. You can also quickly navigate to code profiling and memory profiling for your service from the service view.
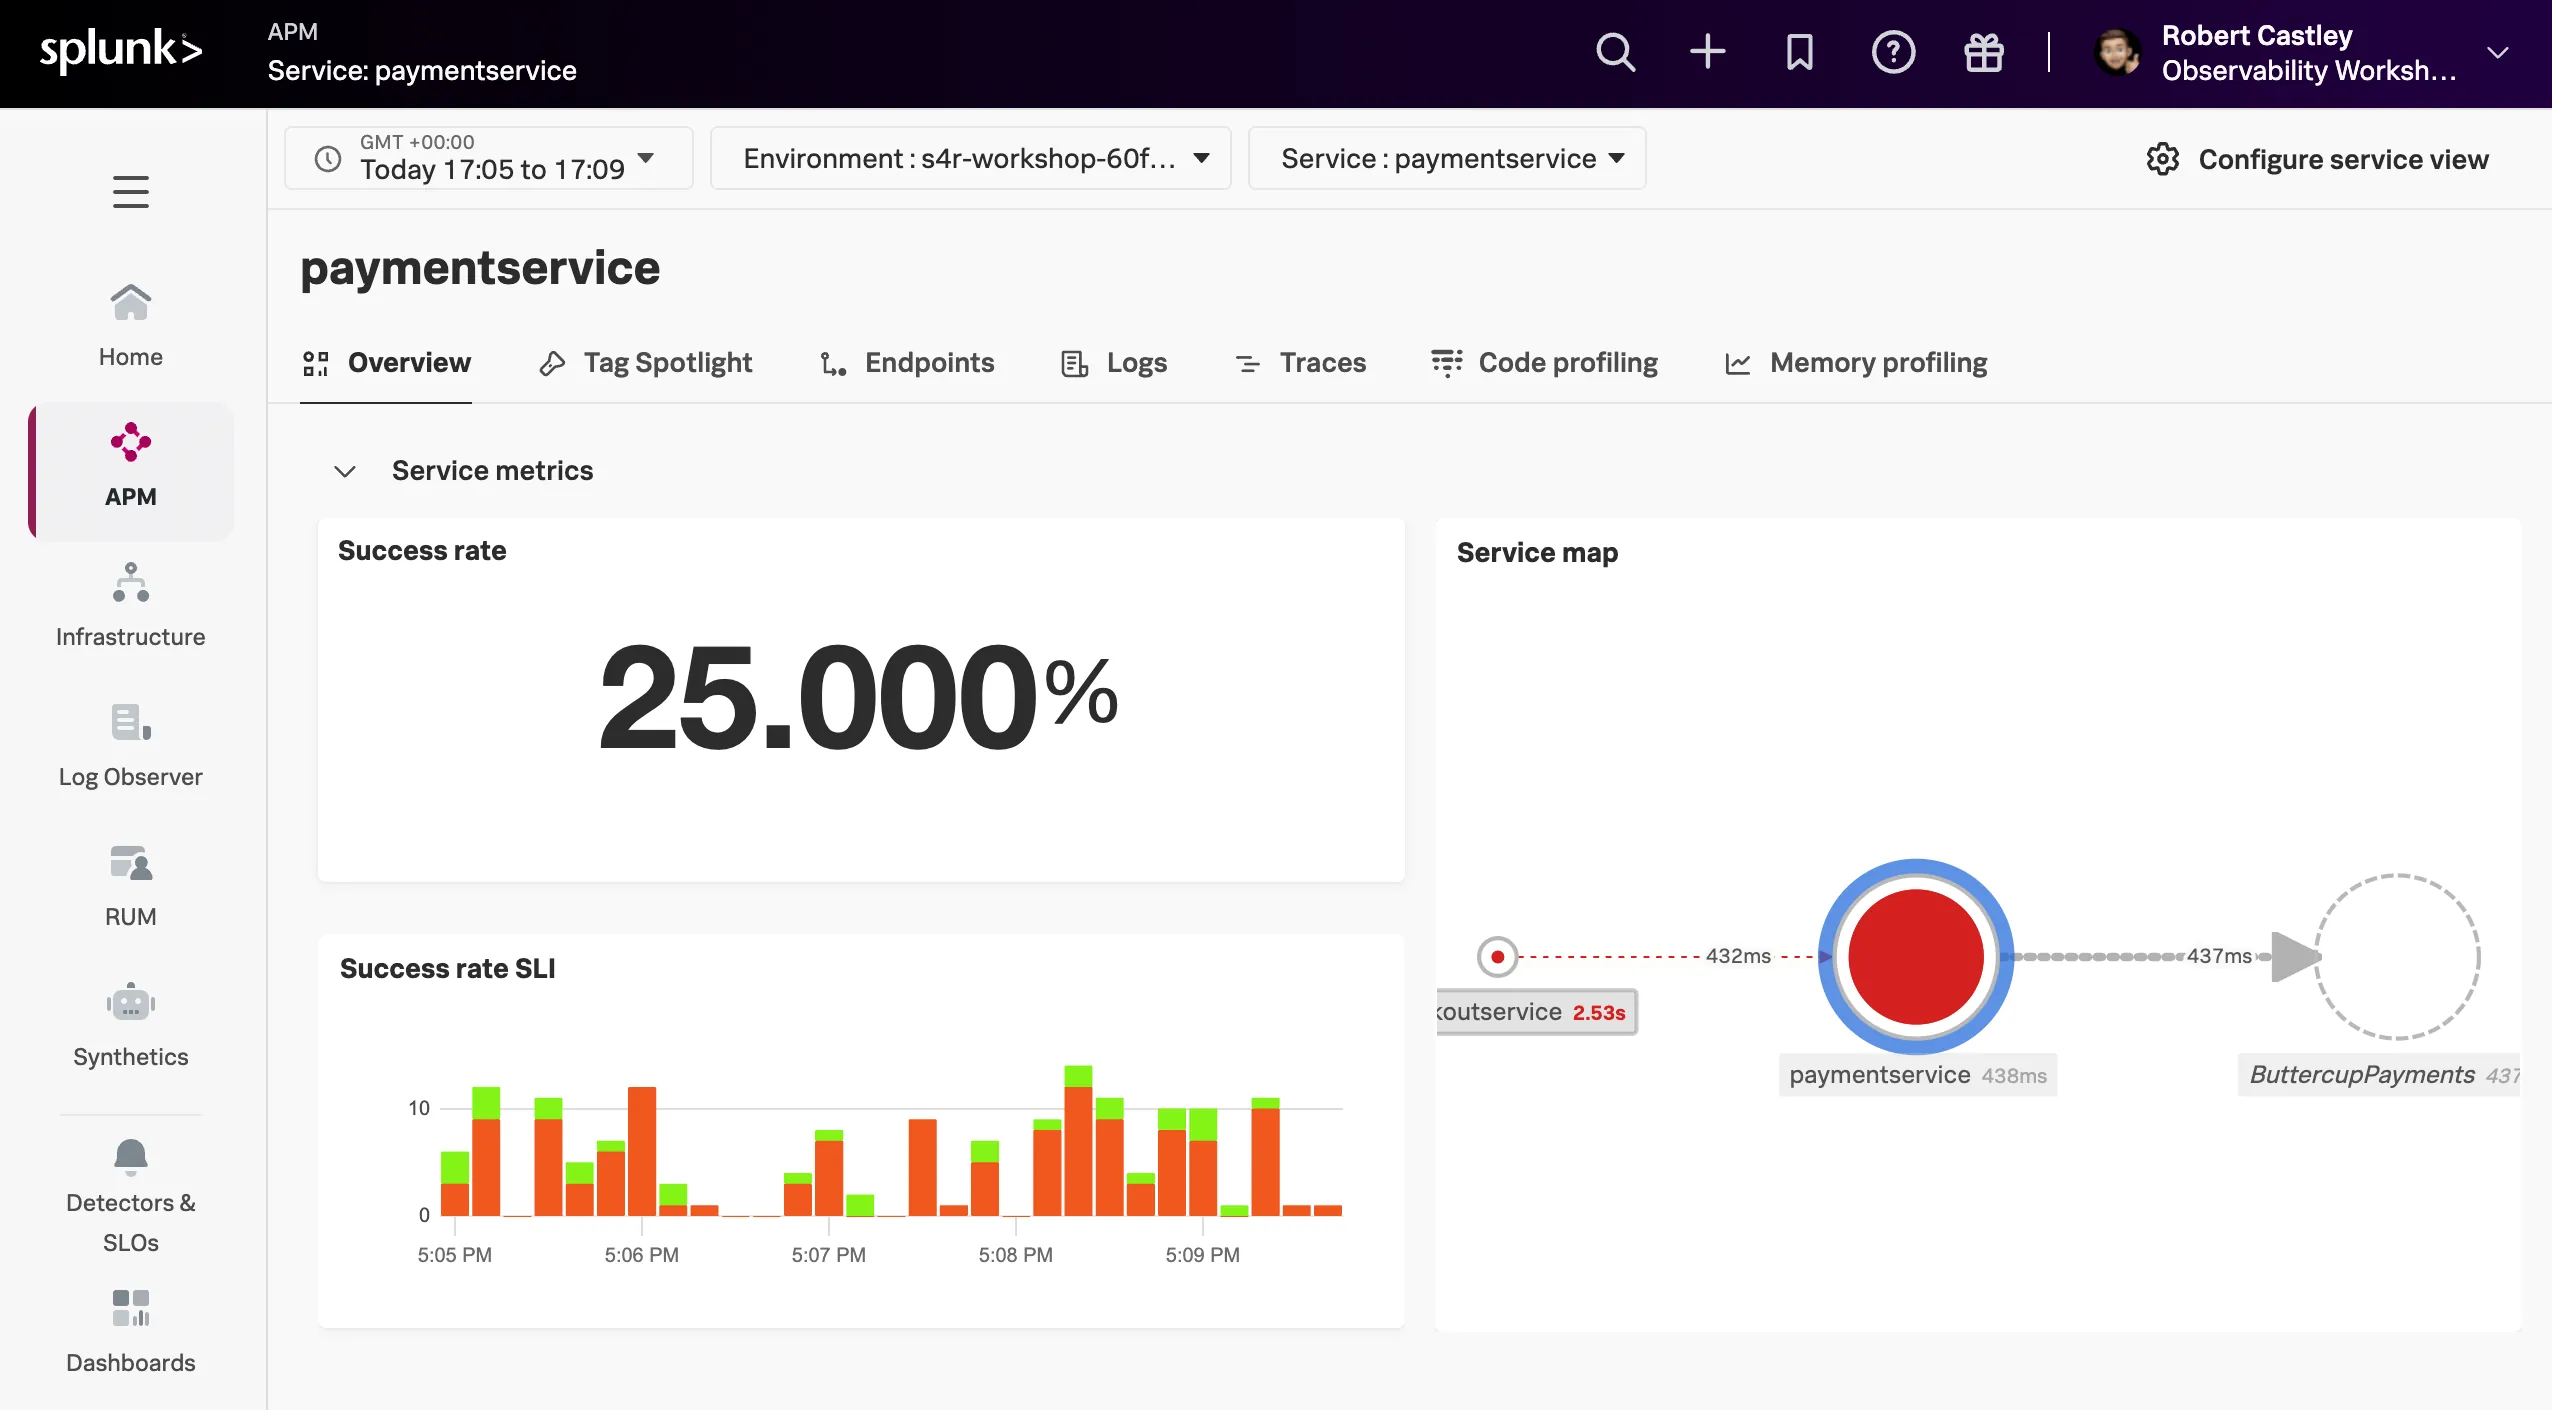
- Check the Time box, you can see that the dashboards only show data relevant to the time it took for the APM trace we previosuly selected to complete (note that the charts are static).
- In the Time box change the timeframe to -1h.
- These charts are very useful to quickly identify performance issues. You can use this dashboard to keep an eye on the health of your service.
- Scroll down the page and expand Infrastructure Metrics. Here you will see the metrics for the Host and Pod.
- Runtime Metrics are not available as profiling data is not available for services written in Node.js.
- Now let’s go back to the service map view using the menu (APM > Service map).
Quick check
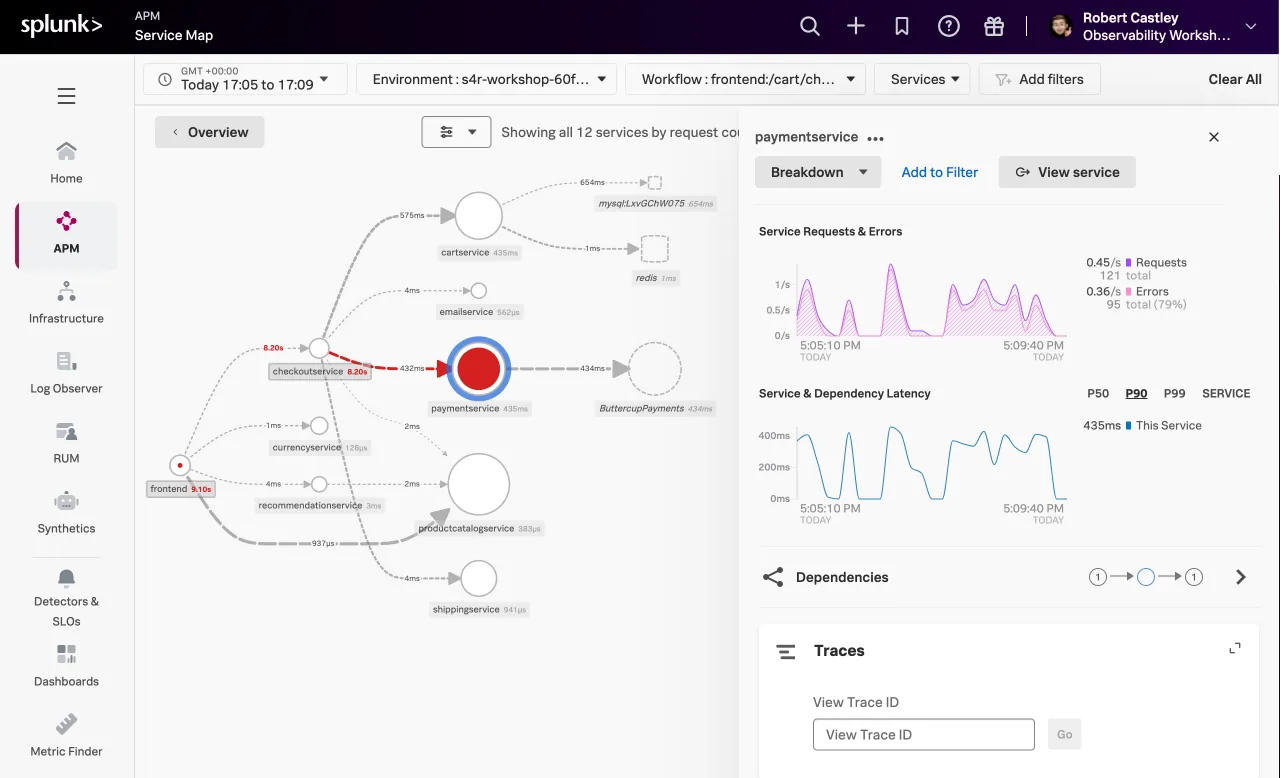
In the Service Map, click paymentservice. What can you conclude from the Service Requests & Errors chart in the sidebar?
The error percentage is very high.
We need to understand if there is a pattern to this error rate. We have a handy tool for that, Tag Spotlight.