

Splunk Log Observer
2. Viewing Log Entries
Before we look at a specific log line, let’s quickly recap what we have done so far and why we are here based on the 3 pillars of Observability:
| Metrics | Traces | Logs |
|---|---|---|
| Do I have a problem? | Where is the problem? | What is the problem? |
- Using metrics we identified we have a problem with our application. This was obvious from the error rate in the Service Dashboards as it was higher than it should be.
- Using traces and span tags we found where the problem is. The paymentservice consists of two versions,
v350.9andv350.10, and the error rate was 100% forv350.10. - We did see that this error from the paymentservice
v350.10caused multiple retries and a long delay in the response back from the Online Boutique checkout. - From the trace, using the power of Related Content, we arrived at the log entries for the failing paymentservice version. Now, we can determine what the problem is.
- Click on an error entry in the log table (make sure it says
hostname: "paymentservice-xxxx"in case there is a rare error from a different service in the list too).
Quick check
Based on the message, what would you tell the development team to do to resolve the issue?
v350.9.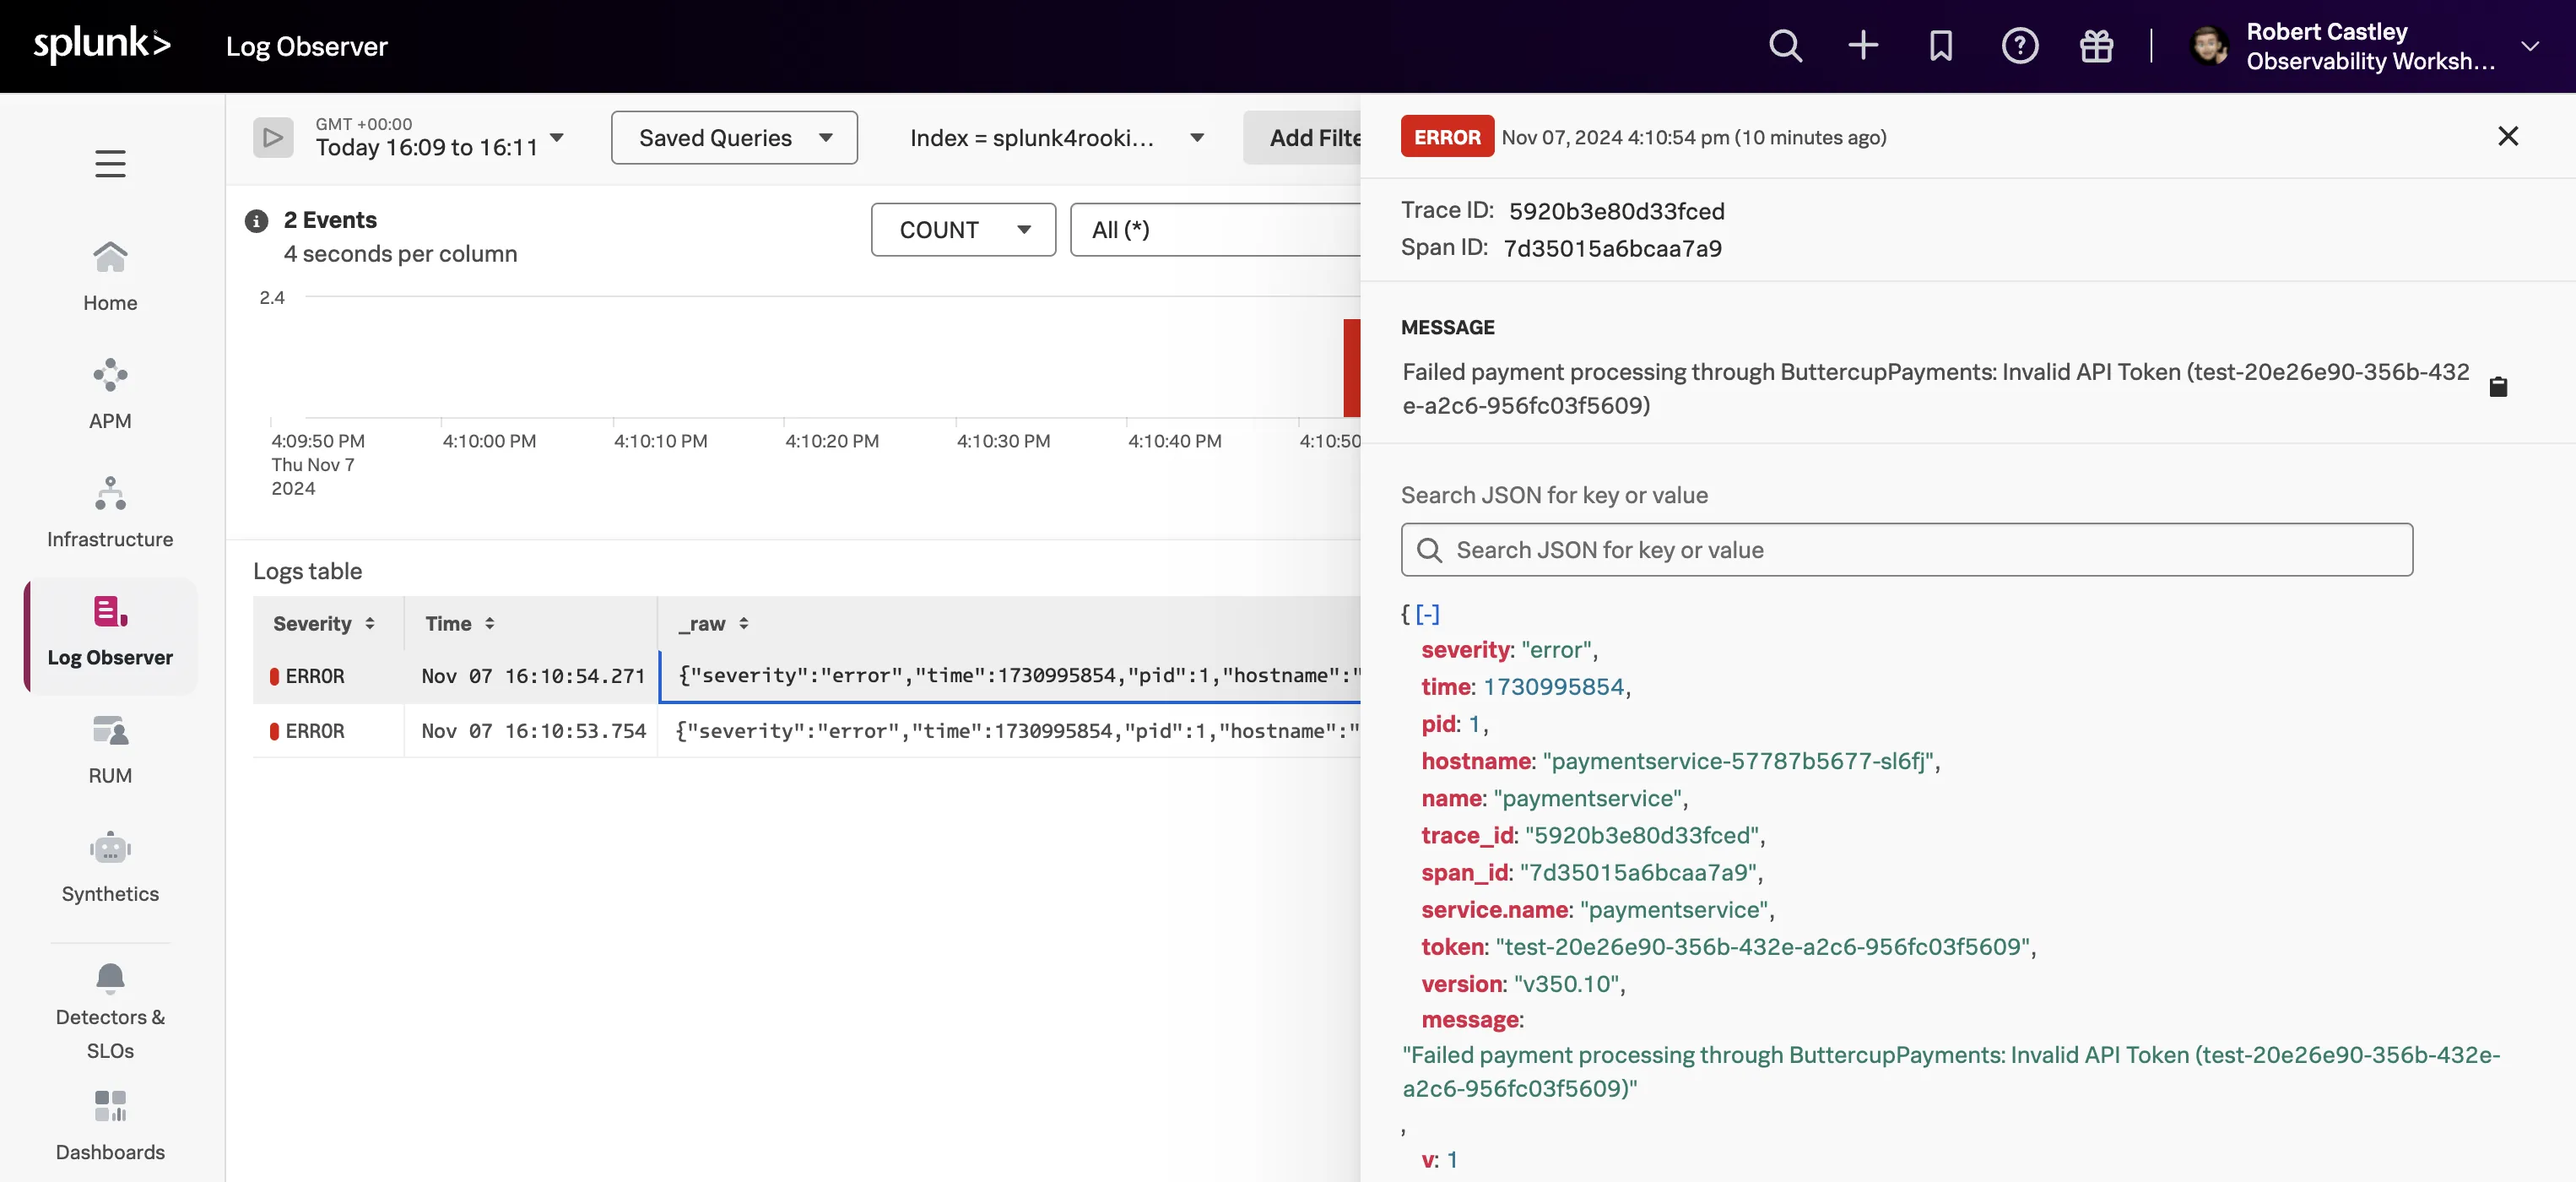
- Click on the X in the log message pane to close it.
Congratulations
You have successfully used Splunk Observability Cloud to understand why you experienced a poor user experience while shopping at the Online Boutique. You used RUM, APM and logs to understand what happened in your service landscape and subsequently, found the underlying cause, all based on the 3 pillars of Observability, metrics, traces and logs
You also learned how to use Splunk’s intelligent tagging and analysis with Tag Spotlight to detect patterns in your applications’ behavior and to use the full stack correlation power of Related Content to quickly move between the different components while keeping in context of the issue.
In the next part of the workshop, we will move from problem-finding mode into mitigation, prevention and process improvement mode.
Next up, creating log charts in a custom dashboard.