Splunk Observability Cloud uses detectors, events, alerts, and notifications to keep you informed when certain criteria are met. For example, you might want a message sent to a Slack channel or an email address for the Ops team when CPU Utilization has reached 95%, or when the number of concurrent users is approaching a limit that might require you to spin up an additional AWS instance.
These conditions are expressed as one or more rules that trigger an alert when the conditions in the rules are met. Individual rules in a detector are labeled according to criticality: Info, Warning, Minor, Major, and Critical.
2. Creating a Detector
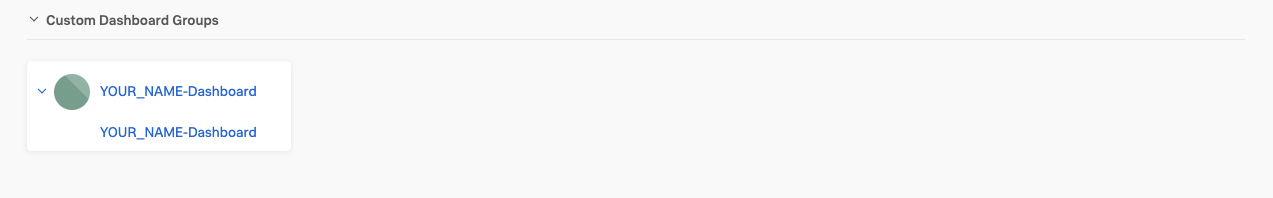
In Dashboards click on your Custom Dashboard Group (that you created in the previous module) and then click on the dashboard name.
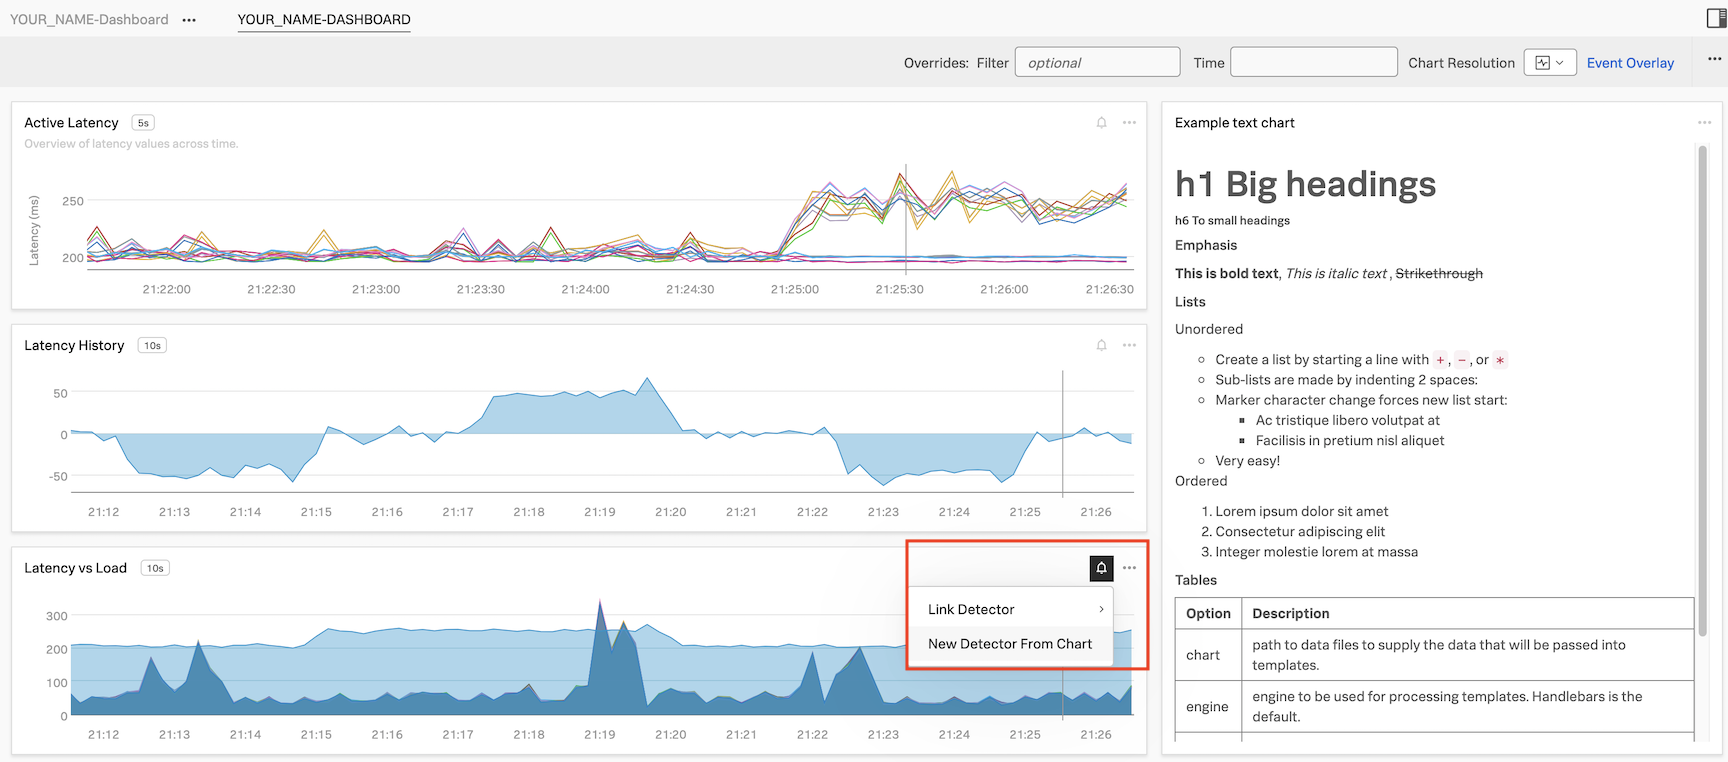
We are now going to create a new detector from a chart on this dashboard. Click on the bell icon on the Latency vs Load chart, and then click New Detector From Chart.
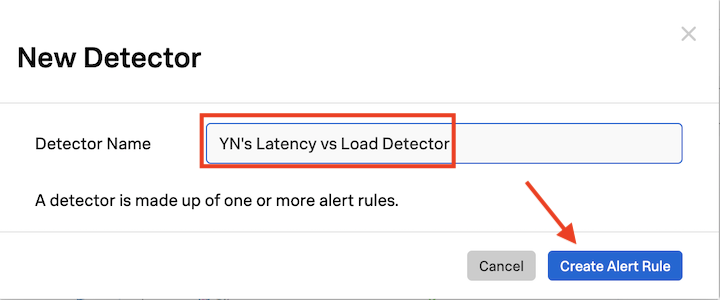
In the text field next to Detector Name, ADD YOUR INITIALS before the proposed detector name.
Naming the detector
It’s important that you add your initials in front of the proposed detector name.
It should be something like this: XYZ’s Latency Chart Detector.
Click on Create Alert Rule
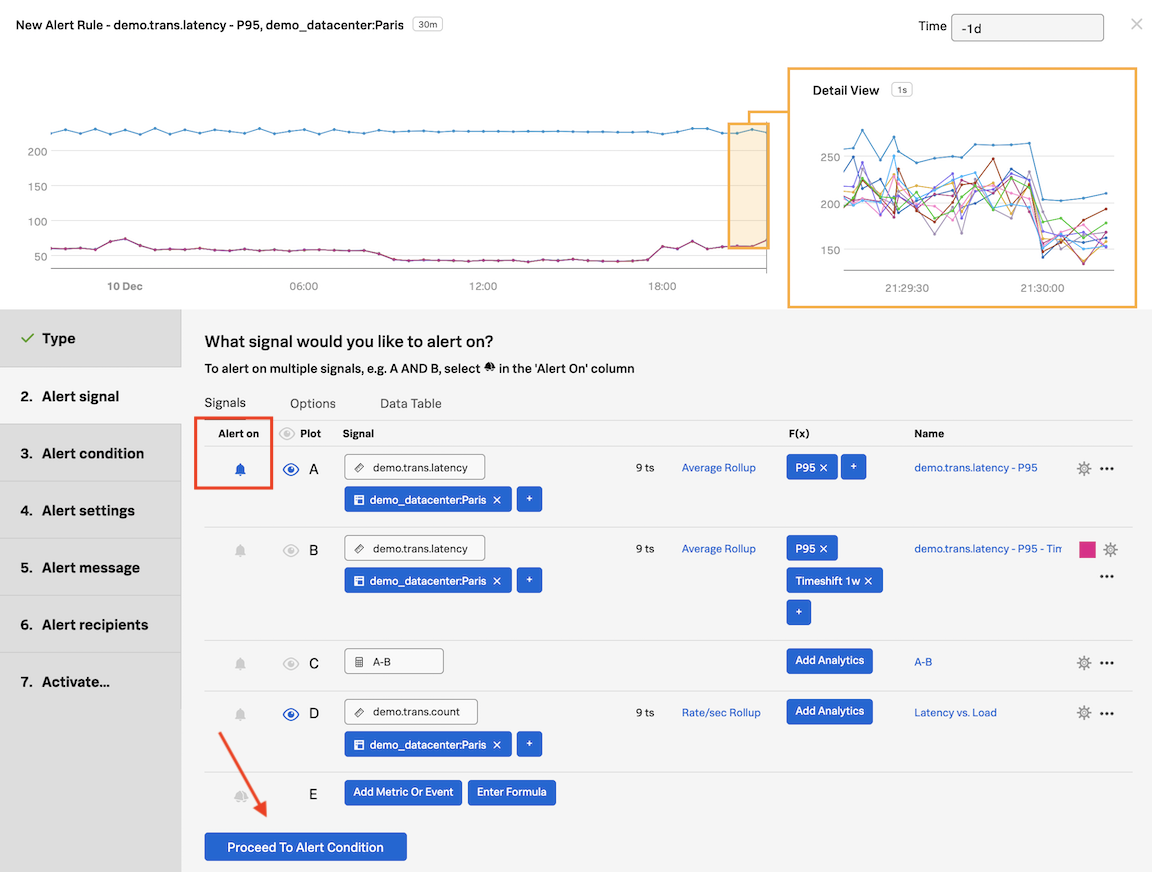
In the Detector window, inside Alert signal, the Signal we will alert on is marked with a (blue) bell in the Alert on column. The bell indicates which Signal is being used to generate the alert.
Click on Proceed to Alert Condition
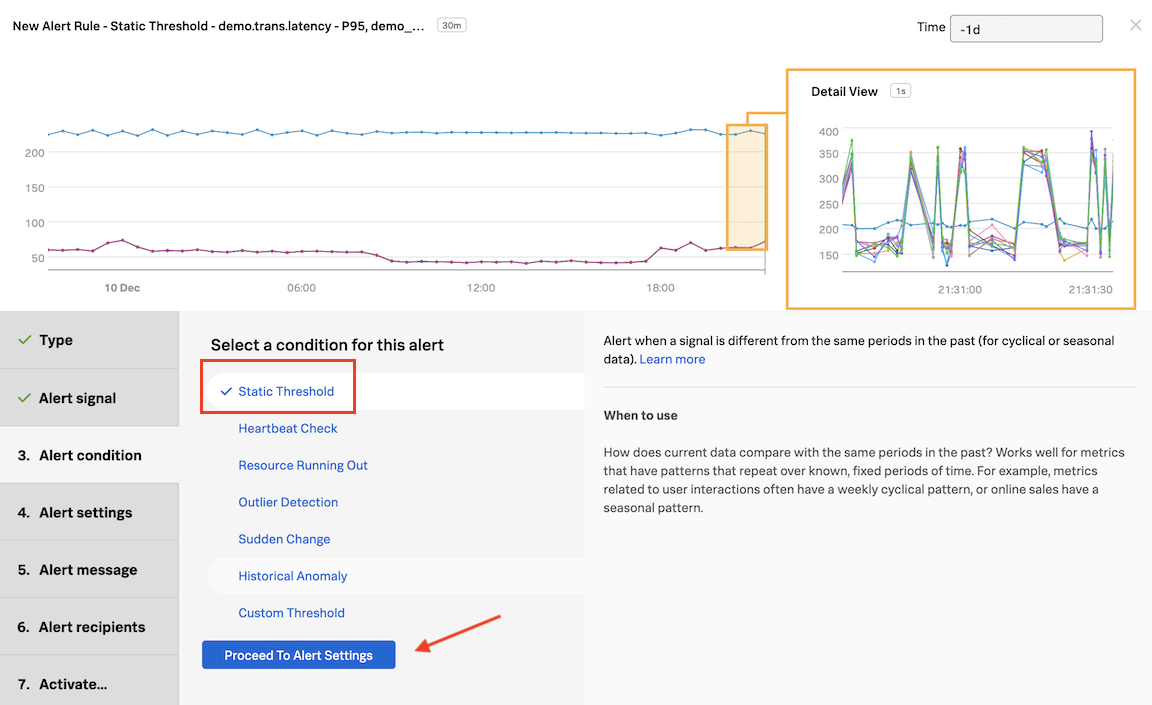
3. Setting Alert condition
In Alert condition, click on Static Threshold and then on Proceed to Alert Settings
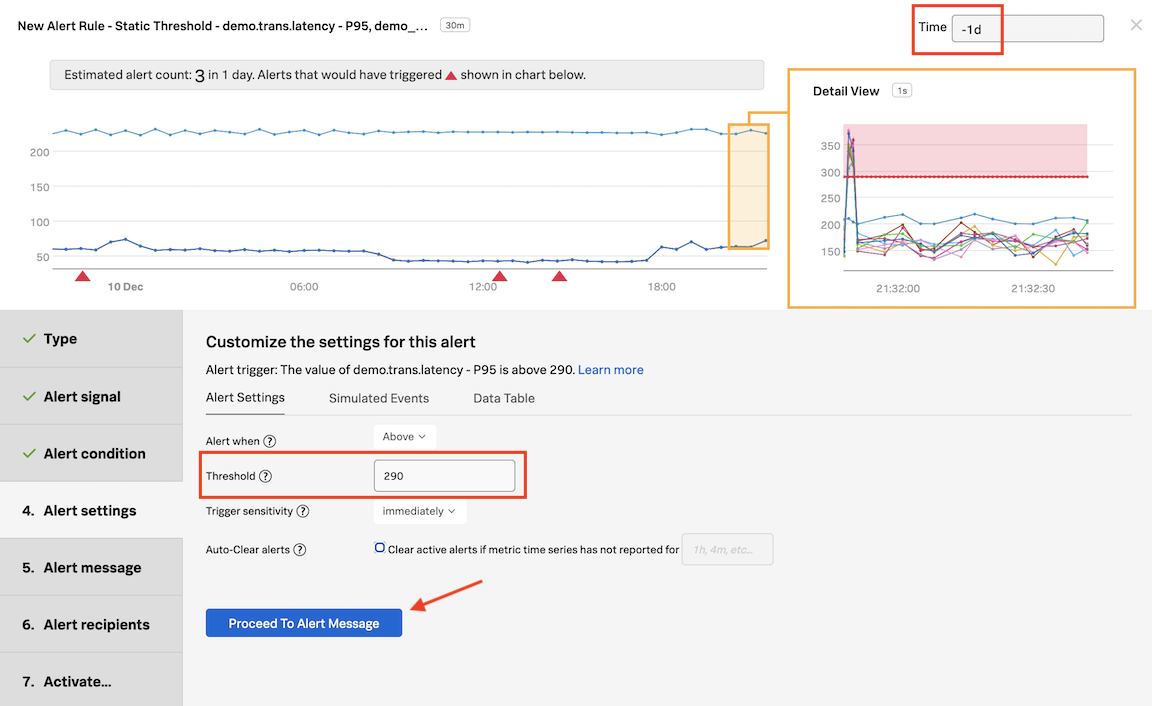
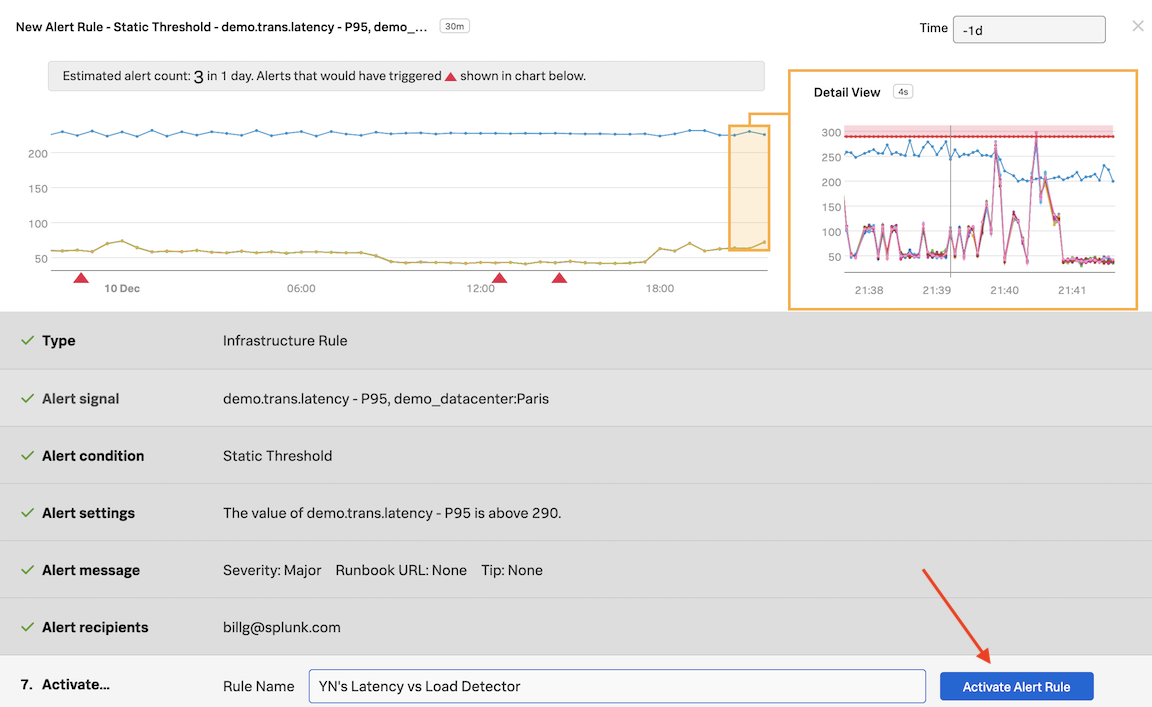
In Alert Settings, enter the value 290 in the Threshold field. In the same window change Time on top right to past day (-1d).
4. Alert pre-flight check
A pre-flight check will take place after 5 seconds. See the Estimated alert count. Based on the current alert settings, the amount of alerts we would have received in 1 day would have been 3.
About pre-flight checks
Once you set an alert condition, the UI estimates how many alerts you might get based on the current settings, and in the timeframe set on the upper right corner - in this case, the past day.
Immediately, the platform will start analyzing the signals with the current settings, and perform something we call a Pre-flight Check. This enables you to test the alert conditions using the historical data in the platform, to ensure the settings are logical and will not inadvertently generate an alert storm, removing the guesswork from configuring alerts in a simple but very powerful way, only available using the Splunk Observability Cloud.
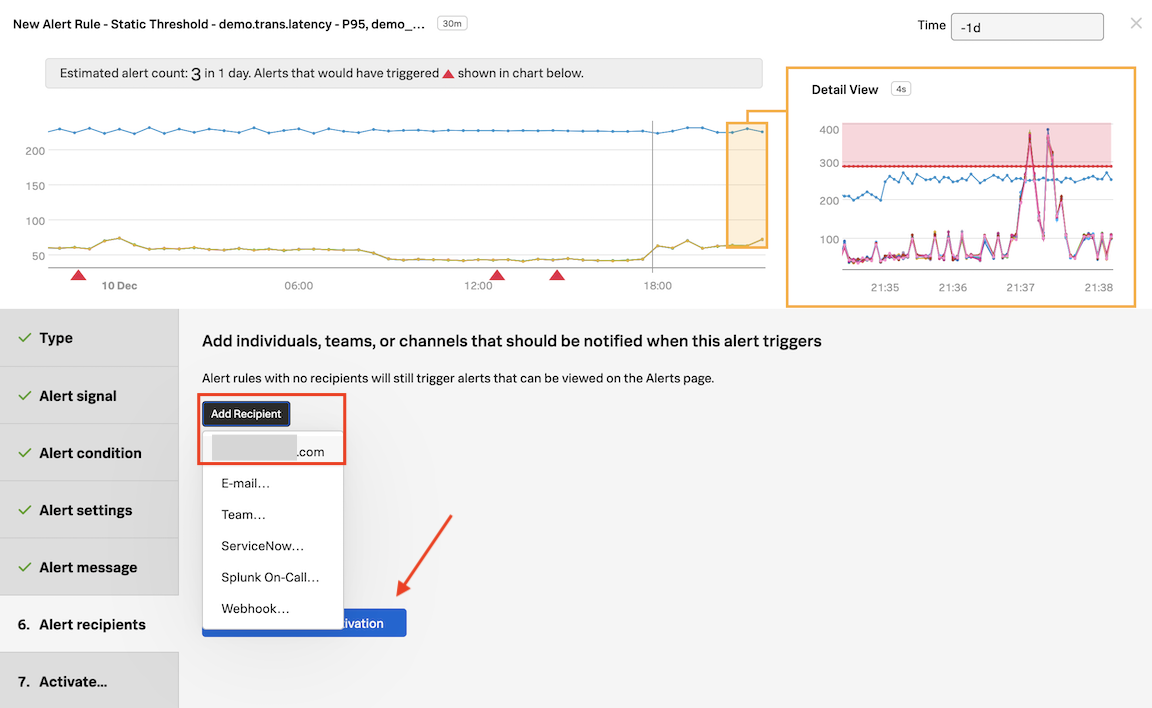
Click on Add Recipient and then on your email address displayed as the first option.
Notification Services
That’s the same as entering that email address OR you can enter another email address by clicking on E-mail….
This is just one example of the many Notification Services the platform has available. You can check this out by going to the Integrations tab of the top menu, and see Notification Services.
6. Alert Activation
Click on Proceed to Alert Activation
In Activate… click on Activate Alert Rule
If you want to get alerts quicker you edit the rule and lower the value from 290 to say 280.
If you change the Time to -1h you can see how many alerts you might get with the threshold you have chosen based on the metrics from the last 1 hour.
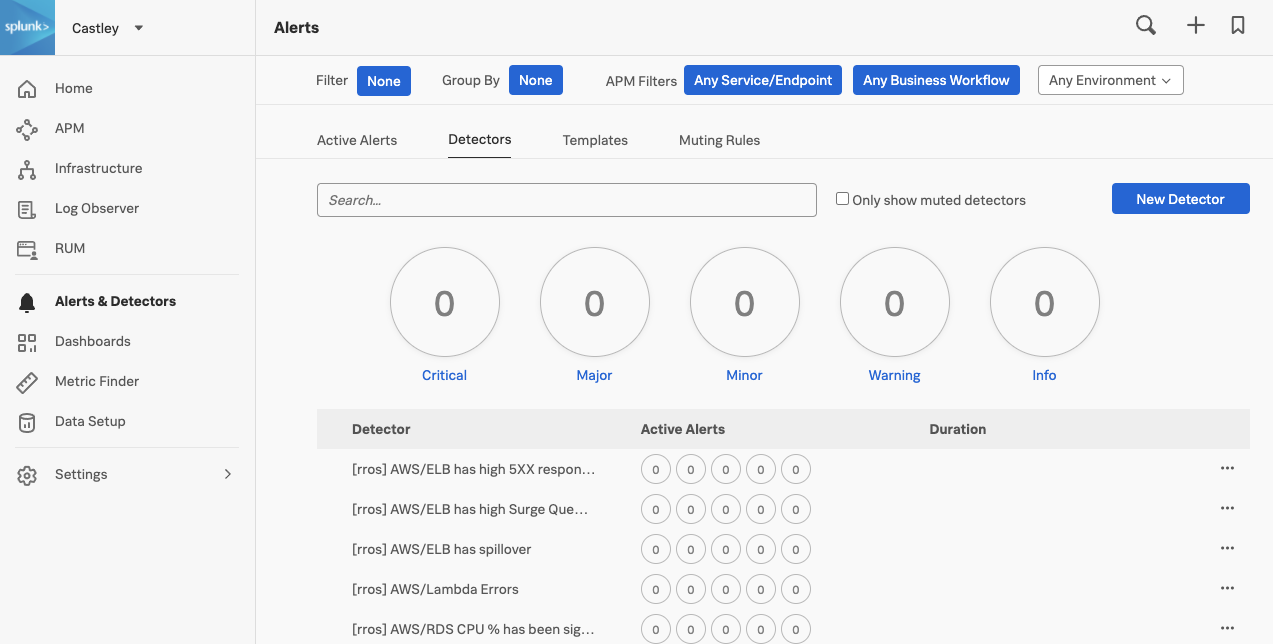
Click on the in the navbar and then click on Detectors. You can optionally filter for your initials. You will see you detector listed here. If you don’t then please refresh your browser.
Congratulations! You have created your first detector and activated it!
Subsections of 4. Detectors
Working with Muting Rules
Learn how to configure Muting Rules
Learn how to resume notifications
1. Configuring Muting Rules
There will be times when you might want to mute certain notifications. For example, if you want to schedule downtime for maintenance on a server or set of servers, or if you are testing new code or settings etc. For that you can use muting rules in Splunk Observability Cloud. Let’s create one!
Click on Alerts & Detectors in the sidebar and then click Detectors to see the list of active detectors.
If you created a detector in Creating a Detector you can click on the three dots ... on the far right for that detector; if not, do that for another detector.
From the drop-down click on Create Muting Rule…
In the Muting Rule window check Mute Indefinitely and enter a reason.
Important
This will mute the notifications permanently until you come back here and un-check this box or resume notifications for this detector.
Click Next and in the new modal window confirm the muting rule setup.
Click on Mute Indefinitely to confirm.
You won’t be receiving any email notifications from your detector until you resume notifications again. Let’s now see how to do that!
2. Resuming notifications
To Resume notifications, click on Muting Rules, you will see the name of the detector you muted notifications for under Detector heading.
Click on the thee dots ... on the far right, and click on Resume Notifications.
Click on Resume to confirm and resume notifications for this detector.
Congratulations! You have now resumed your alert notifications!
Advanced Detectors
Author
Charity Anderson
Lab Objective
Build a multi-condition detector that alerts only when:
A metric is historically anomalous
AND above a static operational threshold
For a sustained duration
With a customized, actionable alert message
The intent of this lab is to use a real-world example to gain hands-on experience with the SignalFlow behind detectors and alerts. You will move beyond the wizard interface to understand how metric streams are evaluated, how threshold functions generate anomaly conditions, and how detection logic is composed programmatically.
You will examine the out-of-the-box functions used by the wizard, understand how they translate to SignalFlow, and introduce additional SignalFlow methods and functions to construct a detector with greater precision and control.
Scenario
Alert when:
CPU utilization is anomalous based on history
AND above 90%
For 15 minutes sustained
This pattern reduces noise by combining statistical deviation with an operational guardrail and reinforces how threshold generation and alert logic work together within SignalFlow.
Subsections of 4.2 Multi-Condition Detectors
Historical Anomaly Detector
Objective
Create a historical baseline anomaly detector using the detector wizard and examine the generated alert message.
ADD YOUR INITIALS before the proposed detector name.
Naming the detector
It’s important that you add your initials in front of the proposed detector name.
It should be something like this: XYZ’s Advanced Detector.
Create Alert Rule
Configure the following in the alert signal:
Signal (A):system.cpu.utilization
Add Filter
Filter:deployment.environment : astronomy-shop
Proceed to Alert Condition, choose Historical Anomaly and then
Proceed to Alert Settings
Cycle length:1d
Alert when:Too high
Trigger Sensitivity:High
Show advanced settings and review
Proceed to Alert Message.
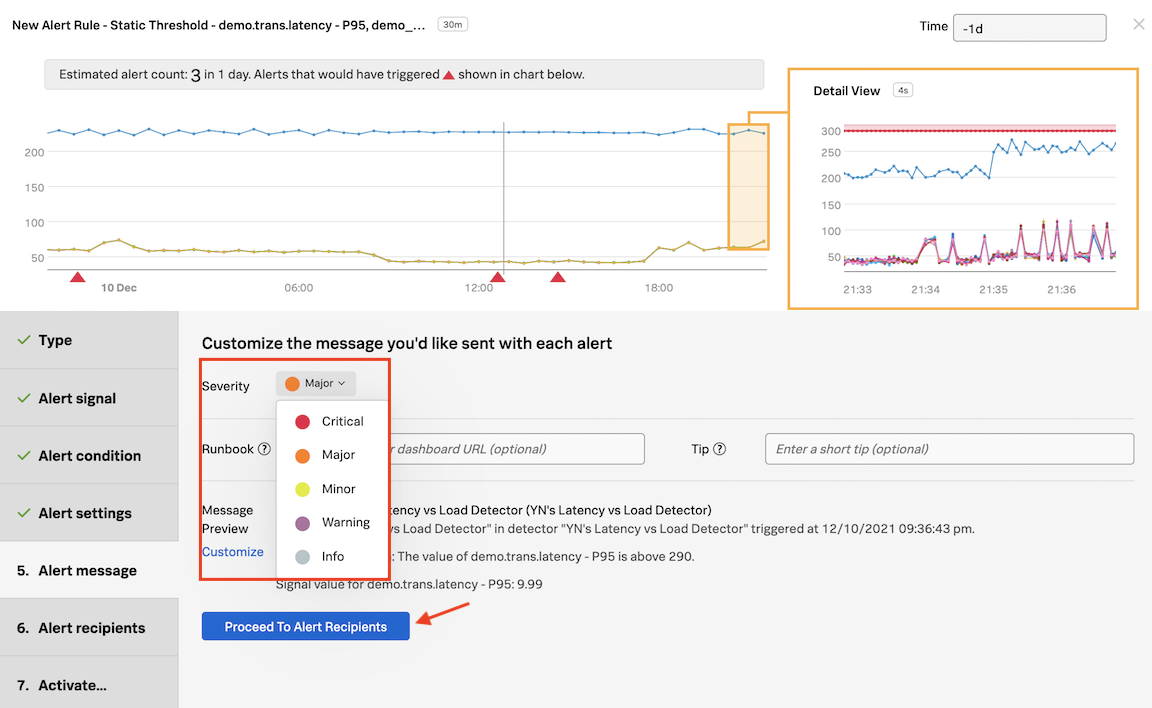
Step 2 – Examine the Default Alert Message
Under Message Preview, click Customize and review the generated message:
{{#ifanomalous}} Rule "{{{ruleName}}}" in detector "{{{detectorName}}}" triggered at {{timestamp}}.
{{else}} Rule "{{{ruleName}}}" in detector "{{{detectorName}}}" cleared at {{timestamp}}.
{{/if}}{{#ifanomalous}}Triggering condition: {{{readableRule}}}{{/if}}Mean value of signal in the last {{event_annotations.current_window}}: {{inputs.summary.value}}{{#ifanomalous}}Trigger threshold: {{inputs.fire_top.value}}{{else}}Clear threshold: {{inputs.clear_top.value}}.
{{/if}}{{#notEmptydimensions}}Signal details:
{{{dimensions}}}{{/notEmpty}}{{#ifanomalous}}{{#ifrunbookUrl}}Runbook: {{{runbookUrl}}}{{/if}}{{#iftip}}Tip: {{{tip}}}{{/if}}{{/if}}{{#ifdetectorTags}}Tags: {{detectorTags}}{{/if}}{{#ifdetectorTeams}}Teams:{{#eachdetectorTeams}}{{name}}{{#unless@last}},{{/unless}}{{/each}}.
{{/if}}
What This Message Is Doing
This message uses conditional blocks to render different content depending on whether the detector is triggering or clearing.
{{#if anomalous}} renders content only when the detector is firing.
The {{else}} branch renders when the detector clears.
This allows one template to handle both trigger and clear notifications.
Important Variables Available in Alert Messages
The following variables are automatically available:
Any stream that is published in SignalFlow becomes available as:
{{inputs.<stream_name>.value}}
Click Done Editing to close the custom message.
Proceed to Alert Recipients and do not select anything, we don’t actually want to send notifications for this scenario
Proceed to Alert ActivationActivate Alert Rule
When prompted about Missing Alert Notification Policy, choose Save
Edit in SignalFlow
Objective
Refactor the wizard-generated detector to:
Separate threshold calculation from alert logic
Compose multiple conditions in a single detect() statement
Introduce a static operational guardrail
Surface dynamic anomaly thresholds for reuse in alert messages
Edit in SignalFlow
From the detector action menu in the upper right hand corner (⋯), select Edit in SignalFlow
You should still be in the Detector UI for the detector you just saved, if not:
Navigate to:
Alerts & Detectors → Detectors
Locate your detector and open it, then Edit in SignalFlow.
Generated SignalFlow
Choose the SignalFlow tab and review the generated SignalFlow for the historical anomaly detector.
Notice on Format
Note that the format of against_periods.detector_mean_std function is on a single line. You an either add line returns after each parameter or copy and paste the same formatted SignalFlow below for readability.
While convenient, this structure bundles threshold generation and alert behavior together. To build multi-condition logic, we must separate threshold calculation from detection logic.
SignalFlow Detector Library
Explore the underlying helper functions and threshold stream implementations used in this lab.
Step 3 – Convert the Helper Call into Threshold Streams
The wizard-generated helper already contains the anomaly tuning we want to preserve:
window_to_compare='10m'
space_between_windows='1d'
num_windows=4
fire_num_stddev=2.5
clear_num_stddev=2
discard_historical_outliers=True
We will keep these values.
Locate:
against_periods.detector_mean_std(
Replace only the function name with:
#Use the streams.mean_std_thresholds function to establish the built in min/max fire and clear threshold conditionsfire_bot,clear_bot,clear_top,fire_top=streams.mean_std_thresholds(
Update the stream argument:
Replace:
stream=A,
With:
CPU,
Remove Helper-Only Alert Parameters
streams.mean_std_thresholds() generates threshold streams only. It does not implement detector behaviors such as orientation or auto-resolve.
Remove:
orientation='above',auto_resolve_after='1h'
Remove the Helper Publish
The helper call publishes a detector directly:
).publish('XYZ_AdvancedDetector')
streams.mean_std_thresholds() does not publish a detector.
Remove.publish('XYZ_AdvancedDetector')
Step 4 – Add Multi-Condition Detect Logic
Now that threshold generation and alert logic are separated, you must explicitly define the detection criteria.
First, define the static guardrail as its own stream by appending:
#Define static threshold for CPU as a variablestatic_threshold=threshold(90)
This creates a constant threshold stream at 90%. By defining it as a stream (instead of embedding threshold(90) directly inside detect()), it can be published, visualized, and referenced in alert messages.
Next, define the multi-condition detection logic:
#detect when CPU has exceeded the fire_top thresholds established AND CPU exceeds static threshold (90%) for 15 minutes; publish detectordetect(CPU>fire_topandwhen(CPU>static_threshold,lasting='15m')).publish('custom_CPU_detector')
This detect statement evaluates two independent conditions:
Historical baseline anomaly CPU > fire_top The 10-minute moving average exceeds the dynamically calculated anomaly threshold.
Static operational guardrail with duration when(CPU > static_threshold, lasting='15m') CPU must remain above 90% for 15 consecutive minutes.
Both conditions must evaluate to true before the detector fires.
You now control exactly how anomaly behavior and operational thresholds interact.
This introduces:
Step 5 – Publish Threshold Streams for Preview and Messaging
To surface both thresholds for detector preview and alert messaging:
#publish the fire_top threshold and static_threshold for data visualizationfire_top.publish('CPU_top_threshold')static_threshold.publish('CPU_static_threshold')
Result
You have transformed a wizard convenience helper into:
Explicit threshold generation
Composable multi-condition alert logic
Static guardrail enforcement
Sustained evaluation logic
Reusable anomaly and static threshold streams
This structure provides greater precision, flexibility, and clarity in detector behavior.
#import from SignalFx Libraryfromsignalfx.detectors.against_periodsimportstreamsfromsignalfx.detectors.against_periodsimportconditions#Calculate/filter CPUCPU=data('system.cpu.utilization',filter=filter('deployment.environment','astronomy-shop')).publish(label='CPU')#Use the streams.mean_std_thresholds function to establish the built in min/max fire and clear threshold conditionsfire_bot,clear_bot,clear_top,fire_top=streams.mean_std_thresholds(CPU,window_to_compare='10m',space_between_windows='1d',num_windows=4,fire_num_stddev=2.5,clear_num_stddev=2,discard_historical_outliers=True,)#Define static threshold for CPU as a variablestatic_threshold=threshold(90)#detect when CPU has exceeded the fire_top thresholds established AND CPU exceeds static threshold (90%) for 15 minutes; publish detectordetect(CPU>fire_topandwhen(CPU>static_threshold,lasting='15m')).publish('custom_CPU_detector')#publish the fire_top threshold and static_threshold for data visualizationfire_top.publish('CPU_top_threshold')static_threshold.publish('CPU_static_threshold')
Static Threshold in Alert Messages
Because the static guardrail is defined and published:
static_threshold.publish('CPU_static_threshold')
it is now available in the custom alert message as:
{{inputs.CPU_static_threshold.value}}
Any published stream in SignalFlow becomes accessible as inputs.<stream_name>.value in alert messaging.
Update Alert Message and Alert Rule
Objective
Customize the alert message to accurately reflect the multi-condition detection logic by:
Explaining why the wizard-generated message is removed
Referencing published threshold streams
Explicitly communicating both the historical anomaly and static guardrail conditions
Step 1 – Save the Detector
Click Save in the upper right corner.
Step 2 – Edit Alert Message
Navigate to the detector’s Alert Rules tab.
Click Edit on the existing Alert Rule.
Select the Alert message tab and click Customize.
Observe
Notice that the previously wizard-generated message body is no longer populated.
Why did the default message disappear after editing the detector in SignalFlow?
Why the Message Was Removed
Once you edited the detector in SignalFlow, you moved beyond the wizard-managed helper function.
Because the detection logic now uses custom streams and a manually composed detect() statement, the platform can no longer safely infer:
What condition triggered the alert
Which threshold is authoritative
How to describe the detection logic
When you take ownership of detection logic, you must also take ownership of the alert message.
Replace the message body with:
{{#ifanomalous}} Rule "{{{ruleName}}}" in detector "{{{detectorName}}}" triggered at {{timestamp}}.
{{else}} Rule "{{{ruleName}}}" in detector "{{{detectorName}}}" cleared at {{timestamp}}.
{{/if}}{{#ifanomalous}}Triggering condition: {{{readableRule}}}{{/if}}Mean value of signal in the last {{event_annotations.current_window}}: {{inputs.CPU.value}}{{#ifanomalous}}Historical anomaly threshold: {{inputs.CPU_top_threshold.value}}Static guardrail threshold: {{inputs.CPU_static_threshold.value}}{{else}}Clear threshold: {{inputs.clear_top.value}}{{/if}}{{#notEmptydimensions}}Signal details:
{{{dimensions}}}{{/notEmpty}}{{#ifanomalous}}{{#ifrunbookUrl}}Runbook: {{{runbookUrl}}}{{/if}}{{#iftip}}Tip: {{{tip}}}{{/if}}{{/if}}{{#ifdetectorTags}}Tags: {{detectorTags}}{{/if}}{{#ifdetectorTeams}}Teams:{{#eachdetectorTeams}}{{name}}{{#unless@last}},{{/unless}}{{/each}}.
{{/if}}
These variables are available because both streams were published in SignalFlow.
Click Done Editing to save the custom message.
Click ProceedAlert Recipients..
Step 3 – Update the Alert Rule Description
Proceed to Alert Activation
In the Activate… step, update the Description to:
The 10m moving average of system.cpu.utilization (assumed to be cyclical over 1d periods) is more than 2.5 standard deviation(s) above its historical norm and has exceeded 90% for 15 minutes.
Click Update Alert Rule to save changes.
Wrap Up
You have now:
Used the wizard to configure historical baseline parameters
Refactored the generated SignalFlow to expose threshold streams