Deploying the OpenTelemetry Collector in Kubernetes
- Use the Splunk Helm chart to install the OpenTelemetry Collector in K3s
- Explore your cluster in the Kubernetes Navigator
1. Installation using Helm #
Install the OpenTelemetry Collector using the Splunk Helm chart. First, add the Splunk Helm chart repository to Helm and update:
helm repo add splunk-otel-collector-chart https://signalfx.github.io/splunk-otel-collector-chart && helm repo updateInstall the OpenTelemetry Collector Helm chart with the following commands, do NOT edit this:
helm install splunk-otel-collector --version 0.136.0 \
--set="splunkObservability.realm=$REALM" \
--set="splunkObservability.accessToken=$ACCESS_TOKEN" \
--set="clusterName=$INSTANCE-k3s-cluster" \
--set="logsEngine=otel" \
--set="splunkObservability.profilingEnabled=true" \
--set="environment=$INSTANCE-workshop" \
--set="splunkPlatform.endpoint=$HEC_URL" \
--set="splunkPlatform.token=$HEC_TOKEN" \
--set="splunkPlatform.index=splunk4rookies-workshop" \
splunk-otel-collector-chart/splunk-otel-collector \
-f ~/workshop/k3s/otel-collector.yamlUsing ACCESS_TOKEN={REDACTED}
Using REALM=eu0
NAME: splunk-otel-collector
LAST DEPLOYED: Fri May 7 11:19:01 2021
NAMESPACE: default
STATUS: deployed
REVISION: 1
TEST SUITE: NoneYou can monitor the progress of the deployment by running kubectl get pods which should typically report a new pod is up and running after about 30 seconds.
Ensure the status is reported as Running before continuing.
kubectl get podsNAME READY STATUS RESTARTS AGE
splunk-otel-collector-agent-2sk6k 0/1 Running 0 10s
splunk-otel-collector-k8s-cluster-receiver-6956d4446f-gwnd7 0/1 Running 0 10sEnsure there are no errors by tailing the logs from the OpenTelemetry Collector pod. The output should look similar to the log output shown in the Output tab below.
Use the label set by the helm install to tail logs (You will need to press ctrl+c to exit). Or use the installed k9s terminal UI for bonus points!
kubectl logs -l app=splunk-otel-collector -f --container otel-collectorDeleting a failed installation
If you make an error installing the OpenTelemetry Collector you can start over by deleting the installation using:
helm delete splunk-otel-collector2. Validate metrics in the UI #
In the Splunk UI, click the » bottom left and click on Infrastructure.
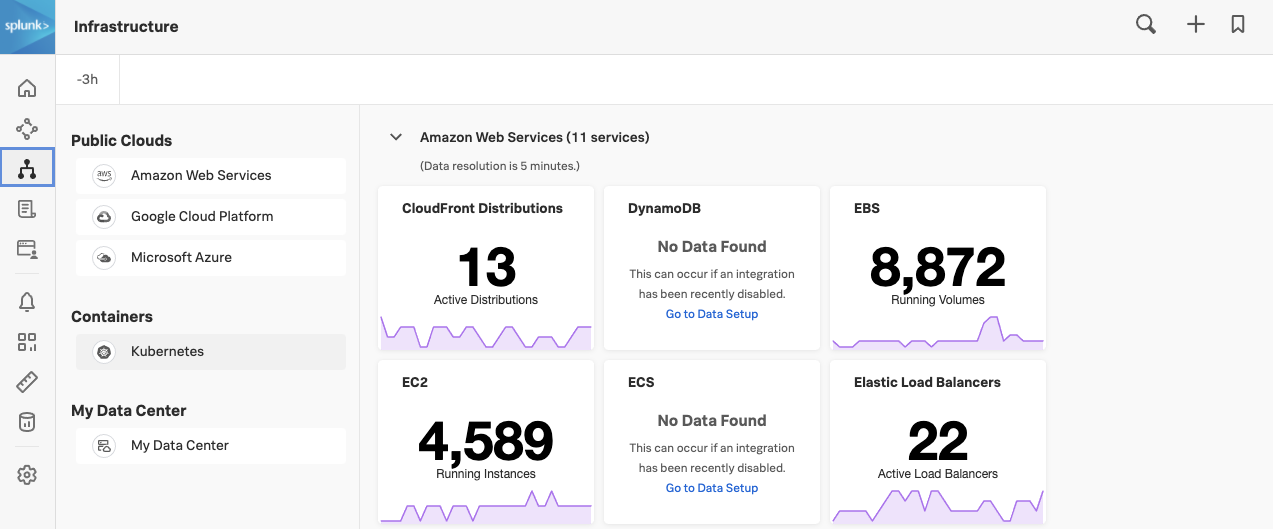
Under Containers click on Kubernetes to open the Kubernetes Navigator Cluster Map to ensure metrics are being sent in.
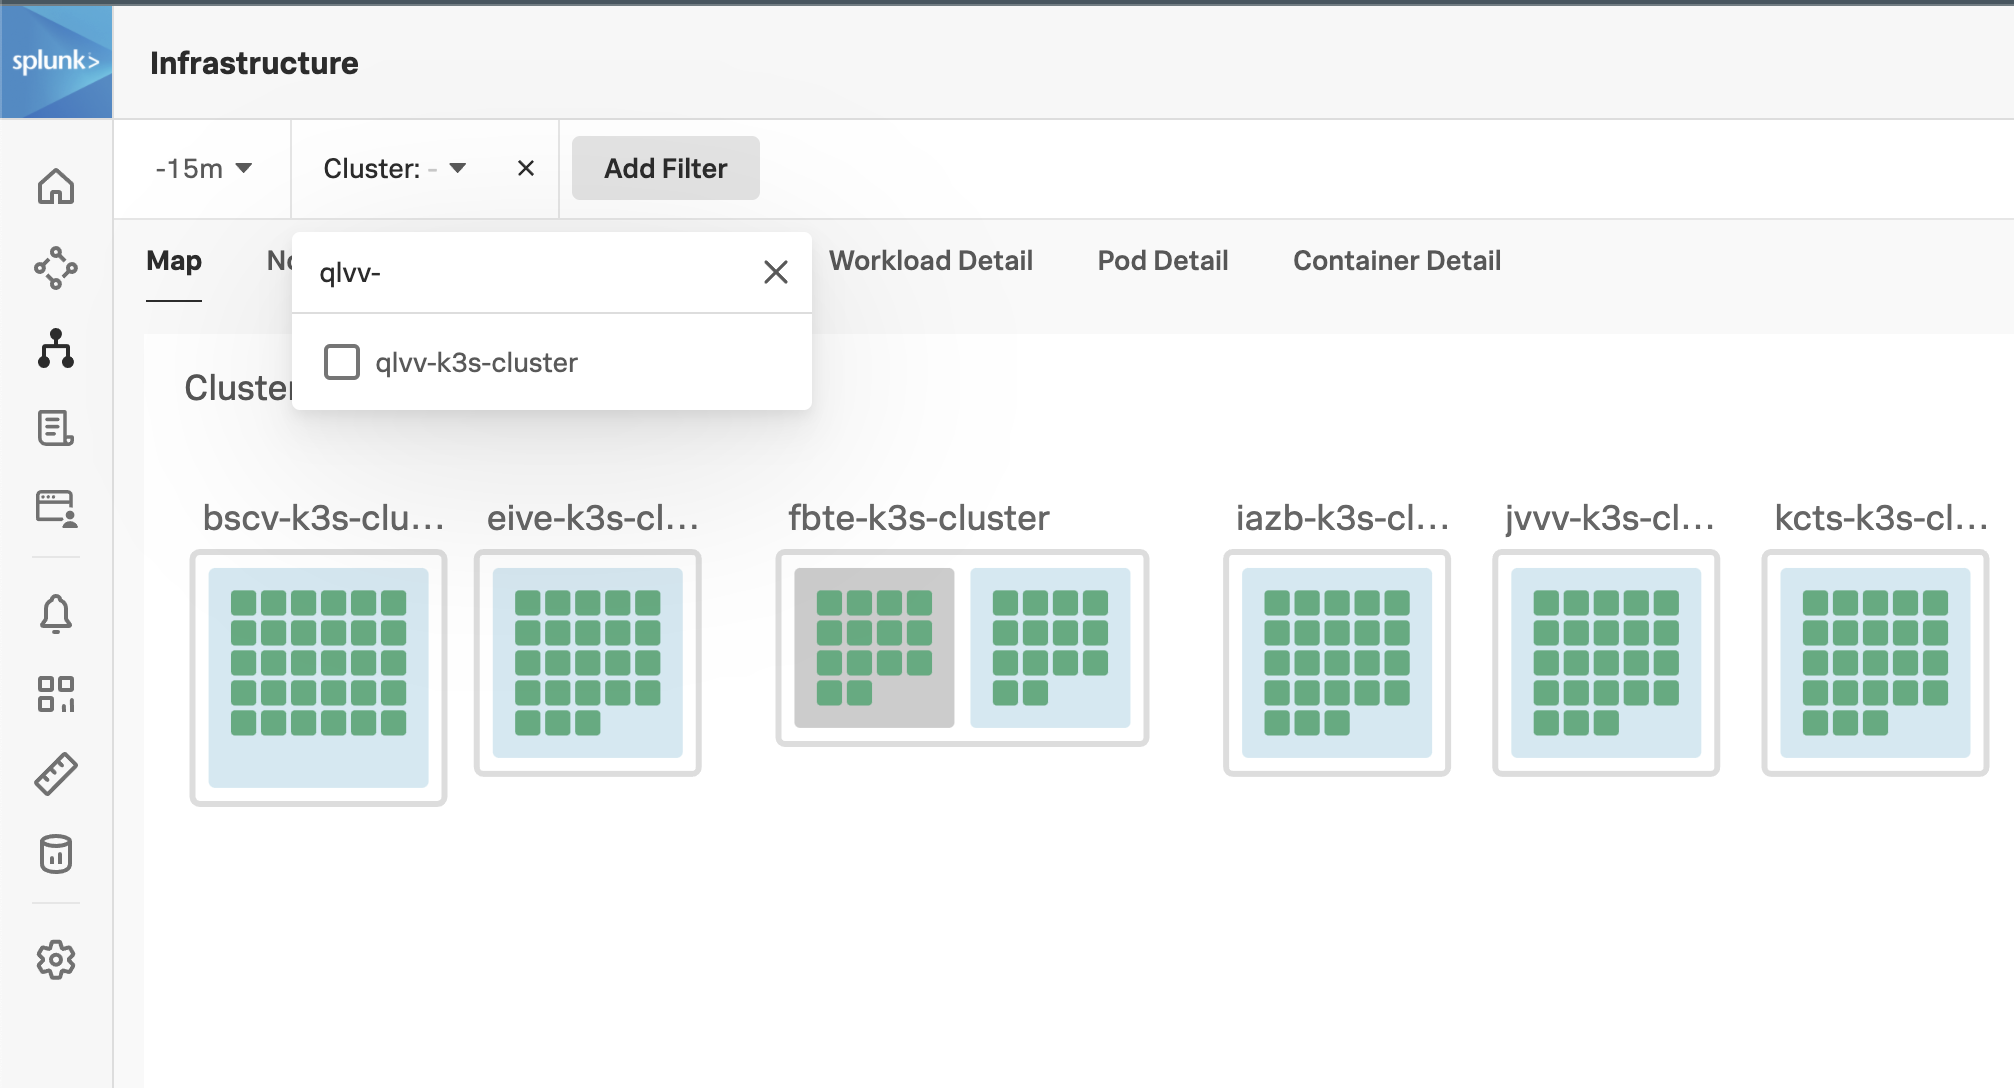
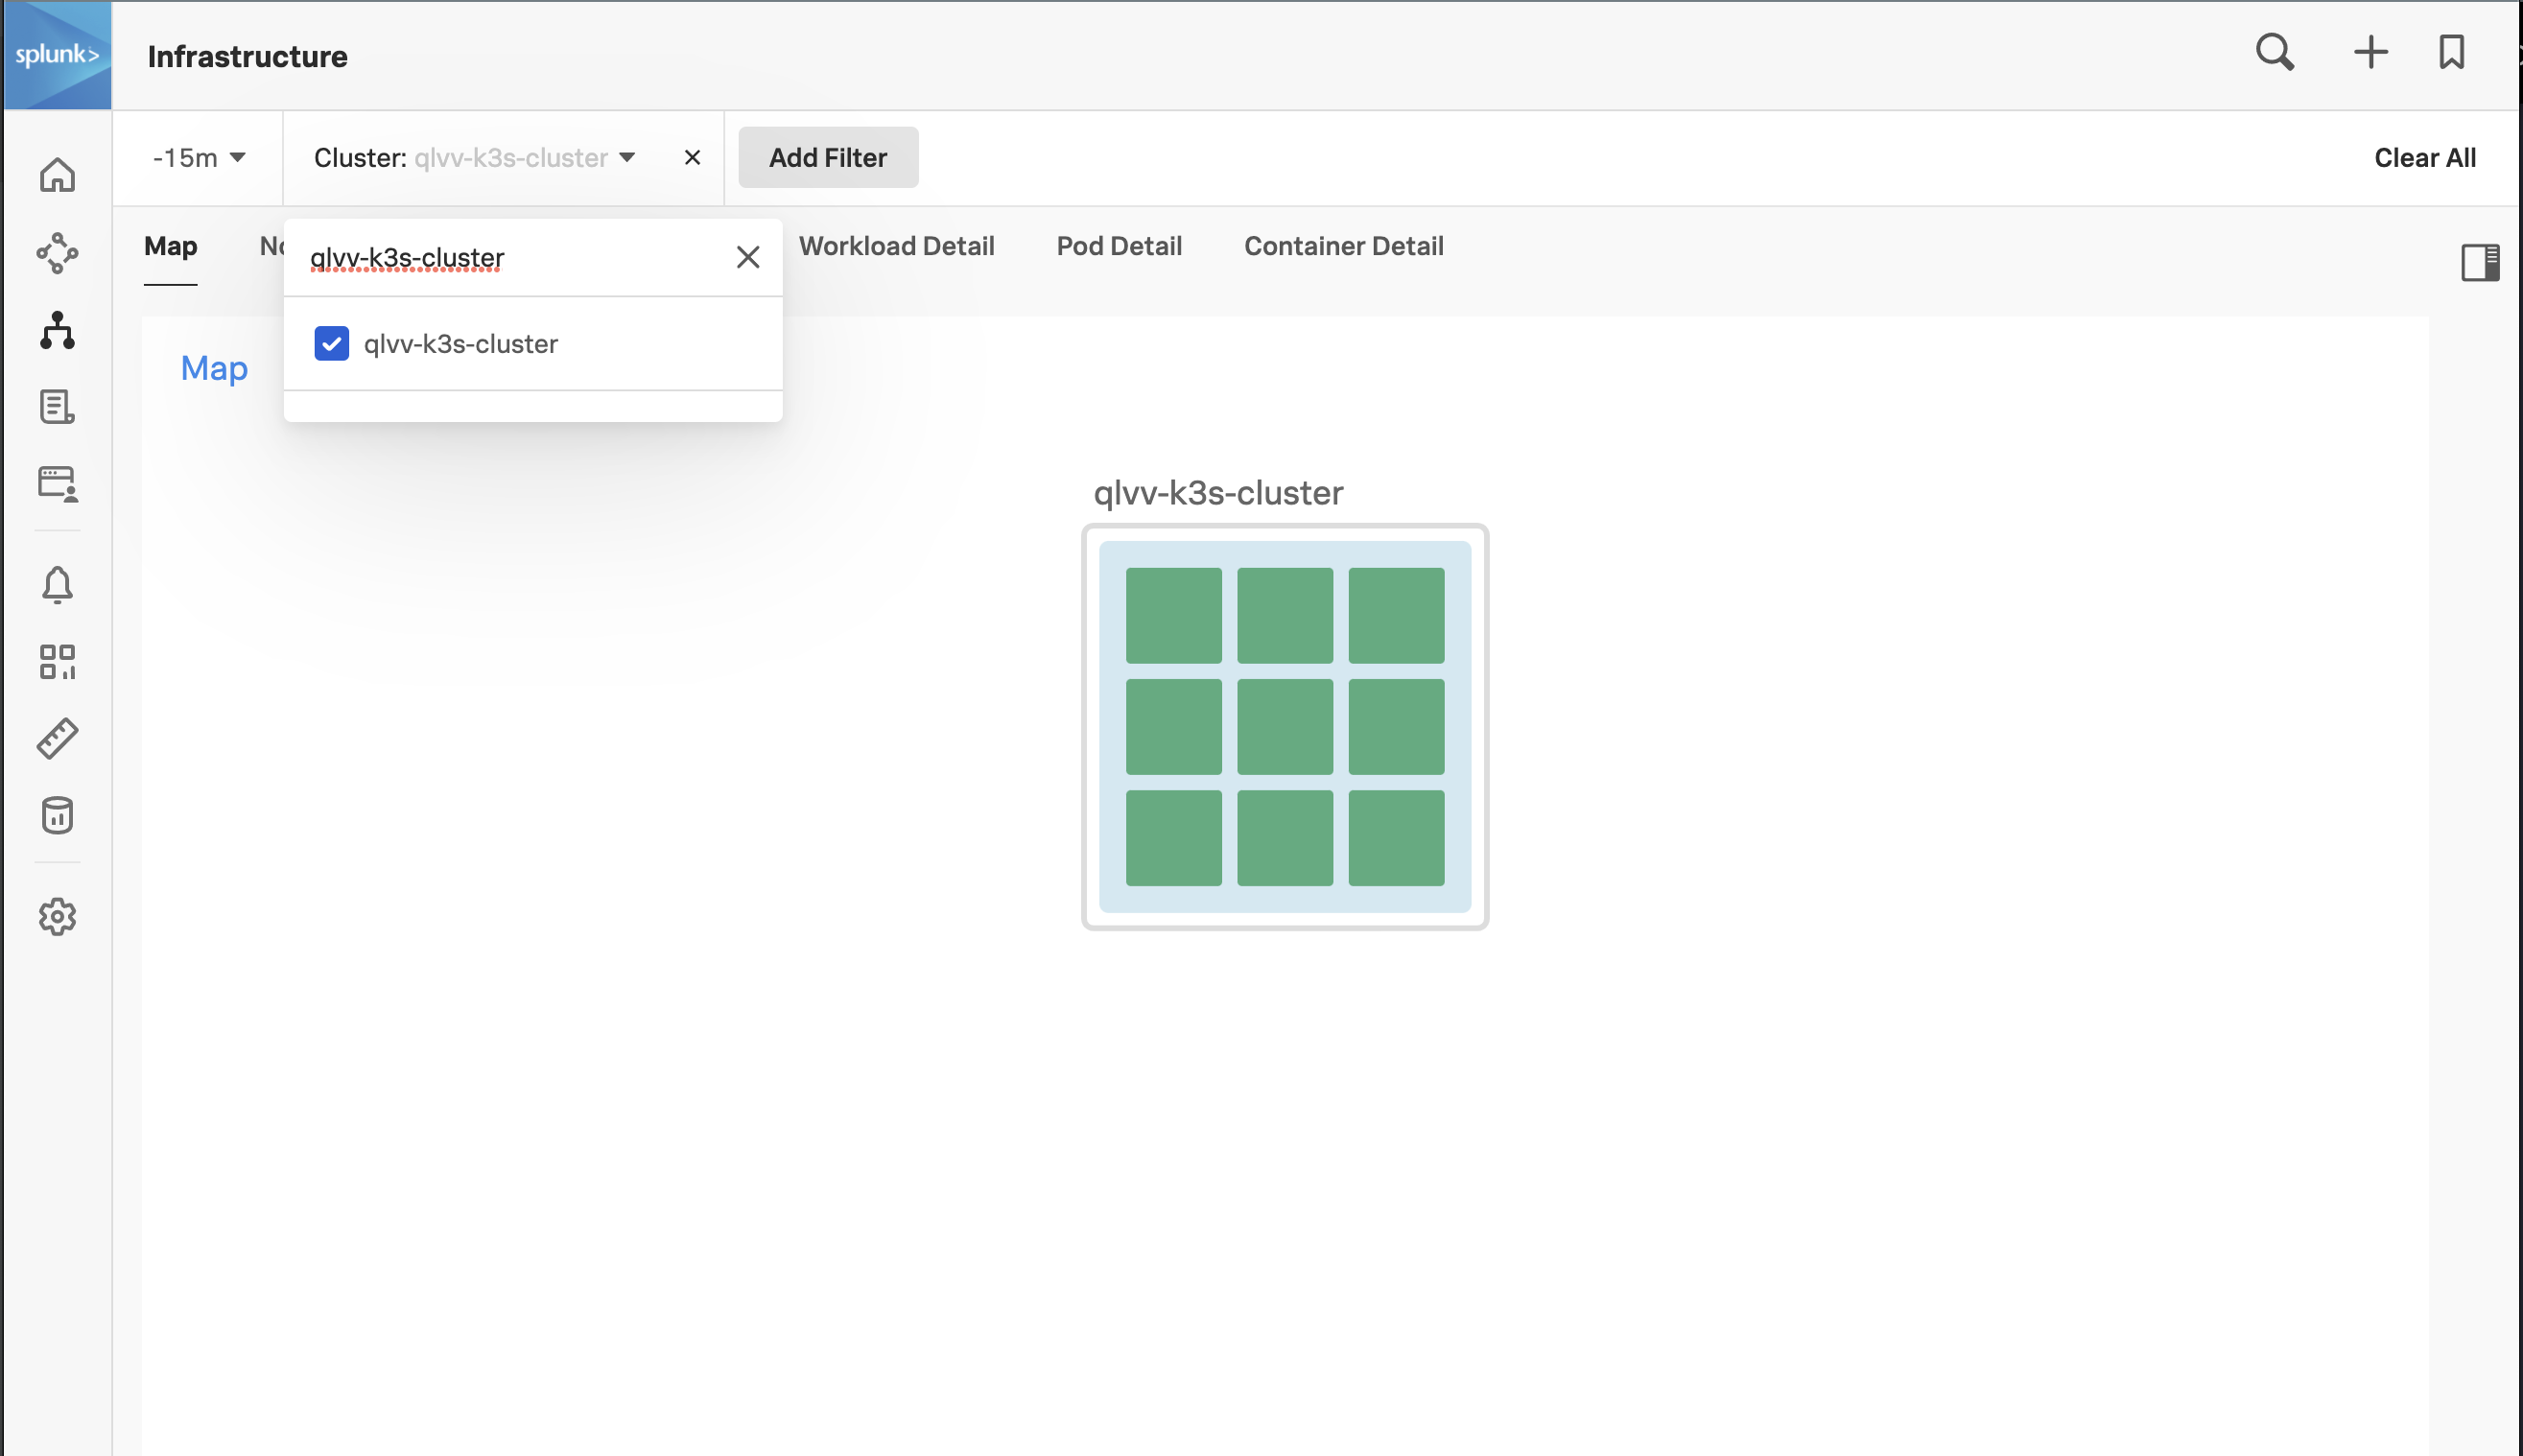
Validate that your cluster is discovered and reported by finding your cluster (in the workshop you will see many other clusters). To find your cluster name run the following command and copy the output to your clipboard:
echo $INSTANCE-k3s-clusterThen in the UI, click on the “Cluster: - " menu just below the Splunk Logo, paste the Cluster name you just copied into the search box, click the box to select your cluster, and finally click off the menu into white space to apply the filter.
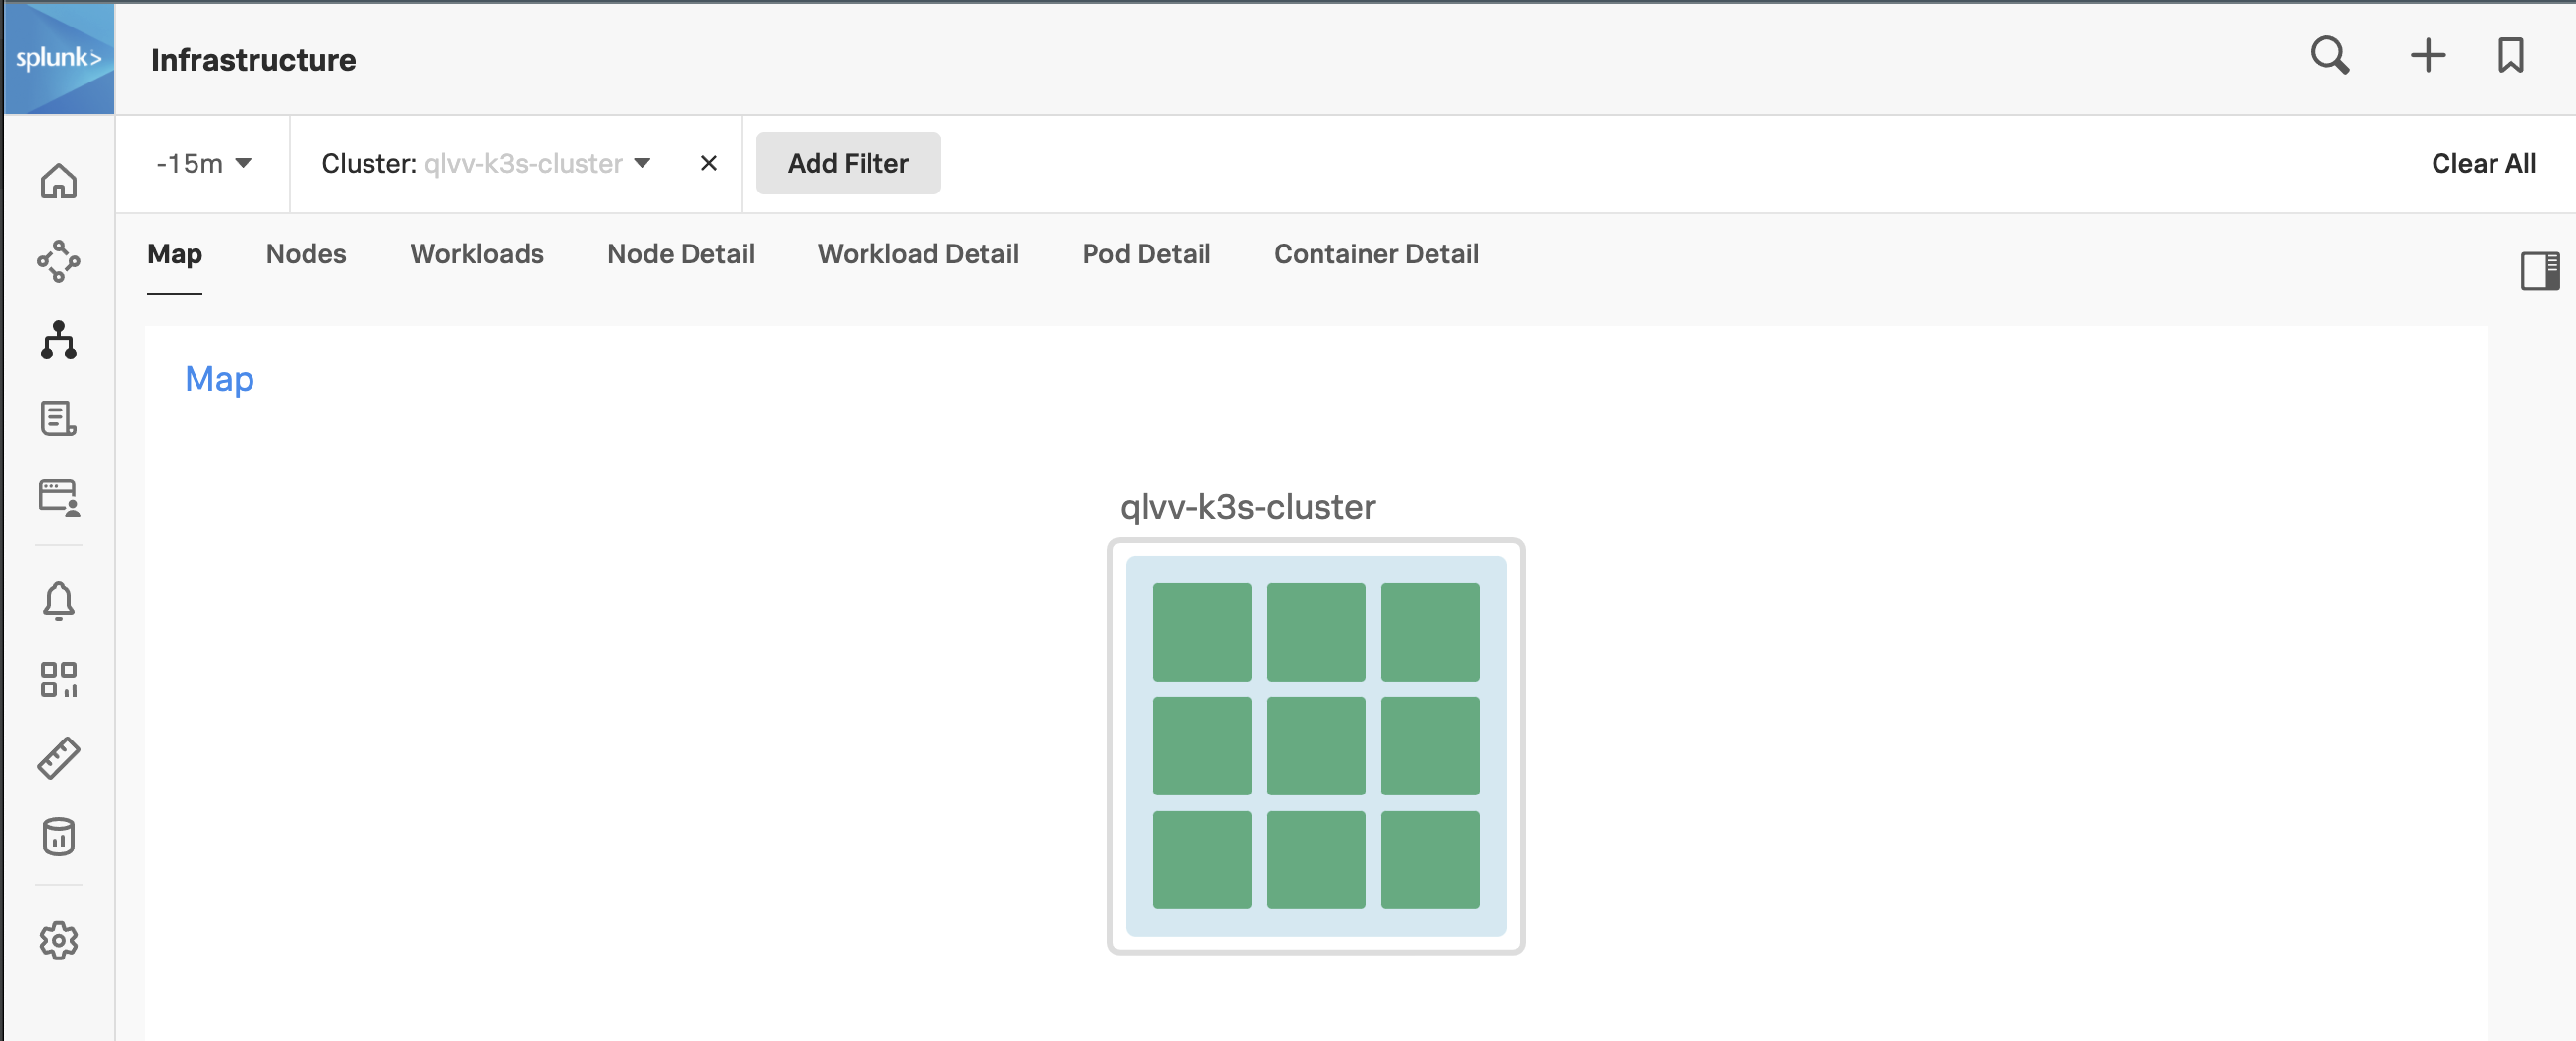
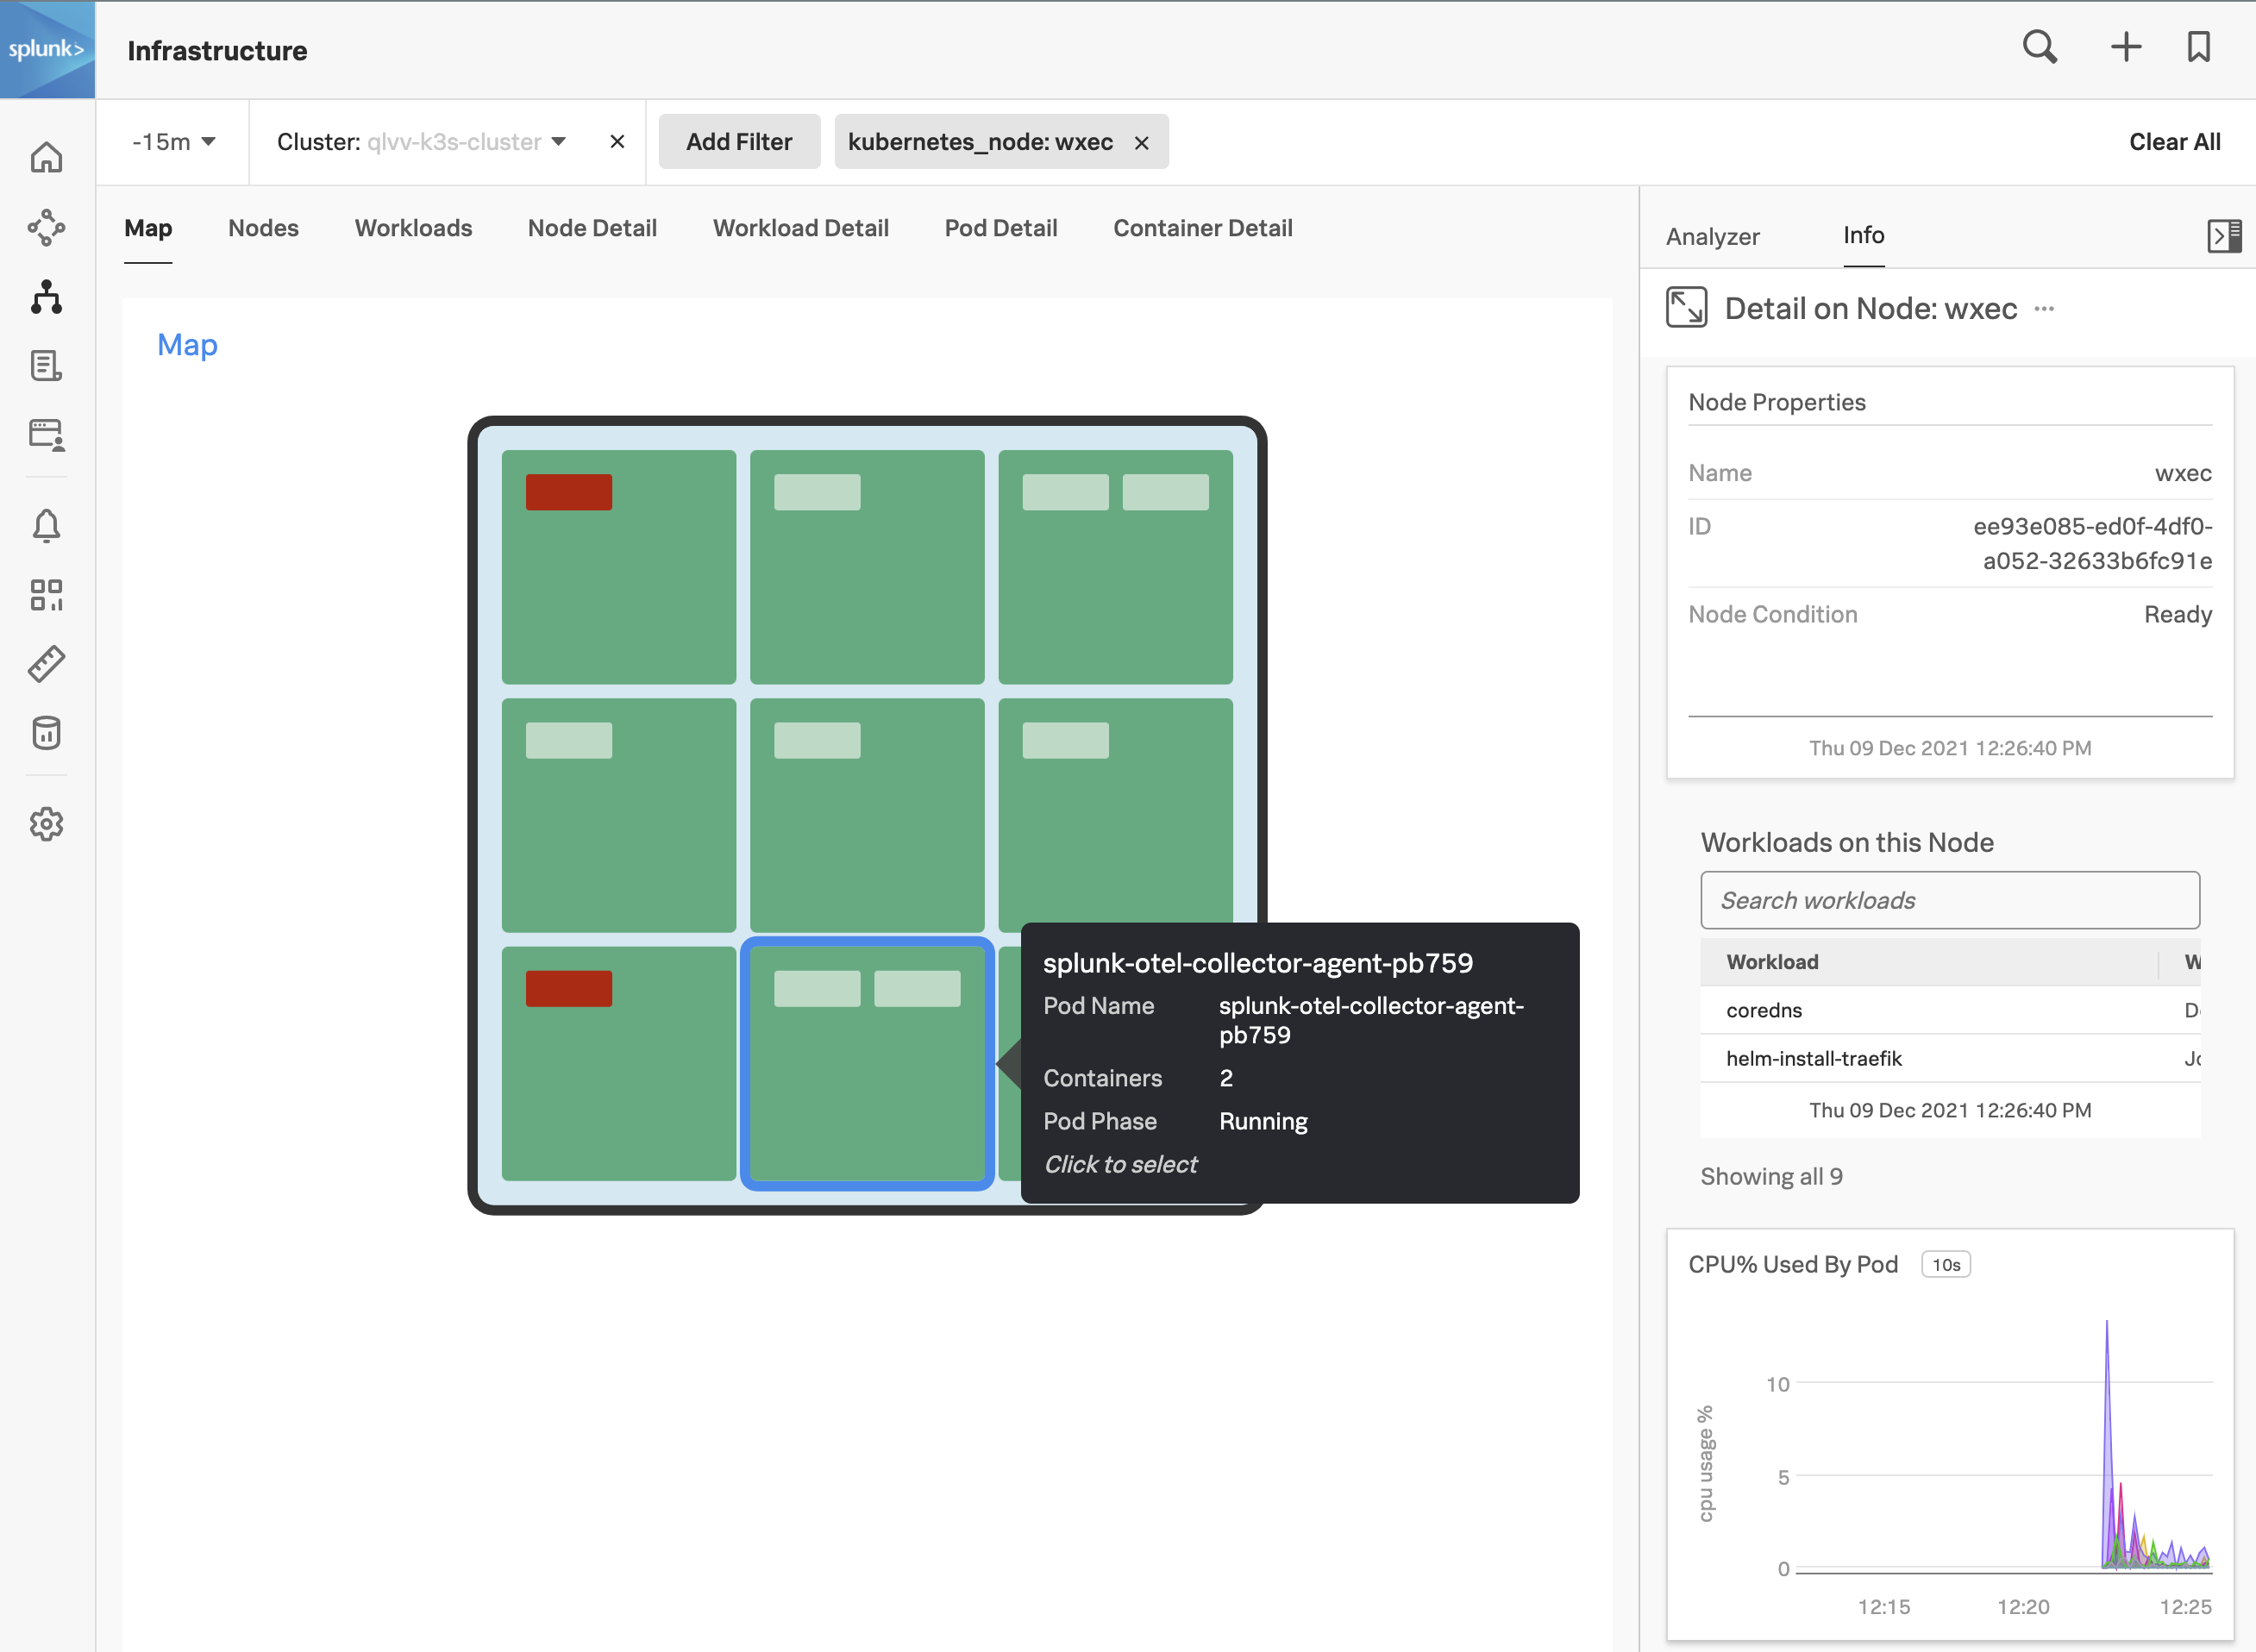
To examine the health of your node, hover over the pale blue background of your cluster, then click on the blue magnifying glass
This will drill down to the node level. Next, open the Metrics sidebar by clicking on the sidebar button.
Once it is open, you can use the slider on the side to explore the various charts relevant to your cluster/node: CPU, Memory, Network, Events etc.