

Deploying the OpenTelemetry Collector in Kubernetes
Deploying NGINX in K3s
- Deploy a NGINX ReplicaSet into your K3s cluster and confirm the discovery of your NGINX deployment.
- Run a load test to create metrics and confirm them streaming into Splunk Observability Cloud!
1. Start your NGINX #
Verify the number of pods running in the Splunk UI by selecting the WORKLOADS tab. This should give you an overview of the workloads on your cluster.
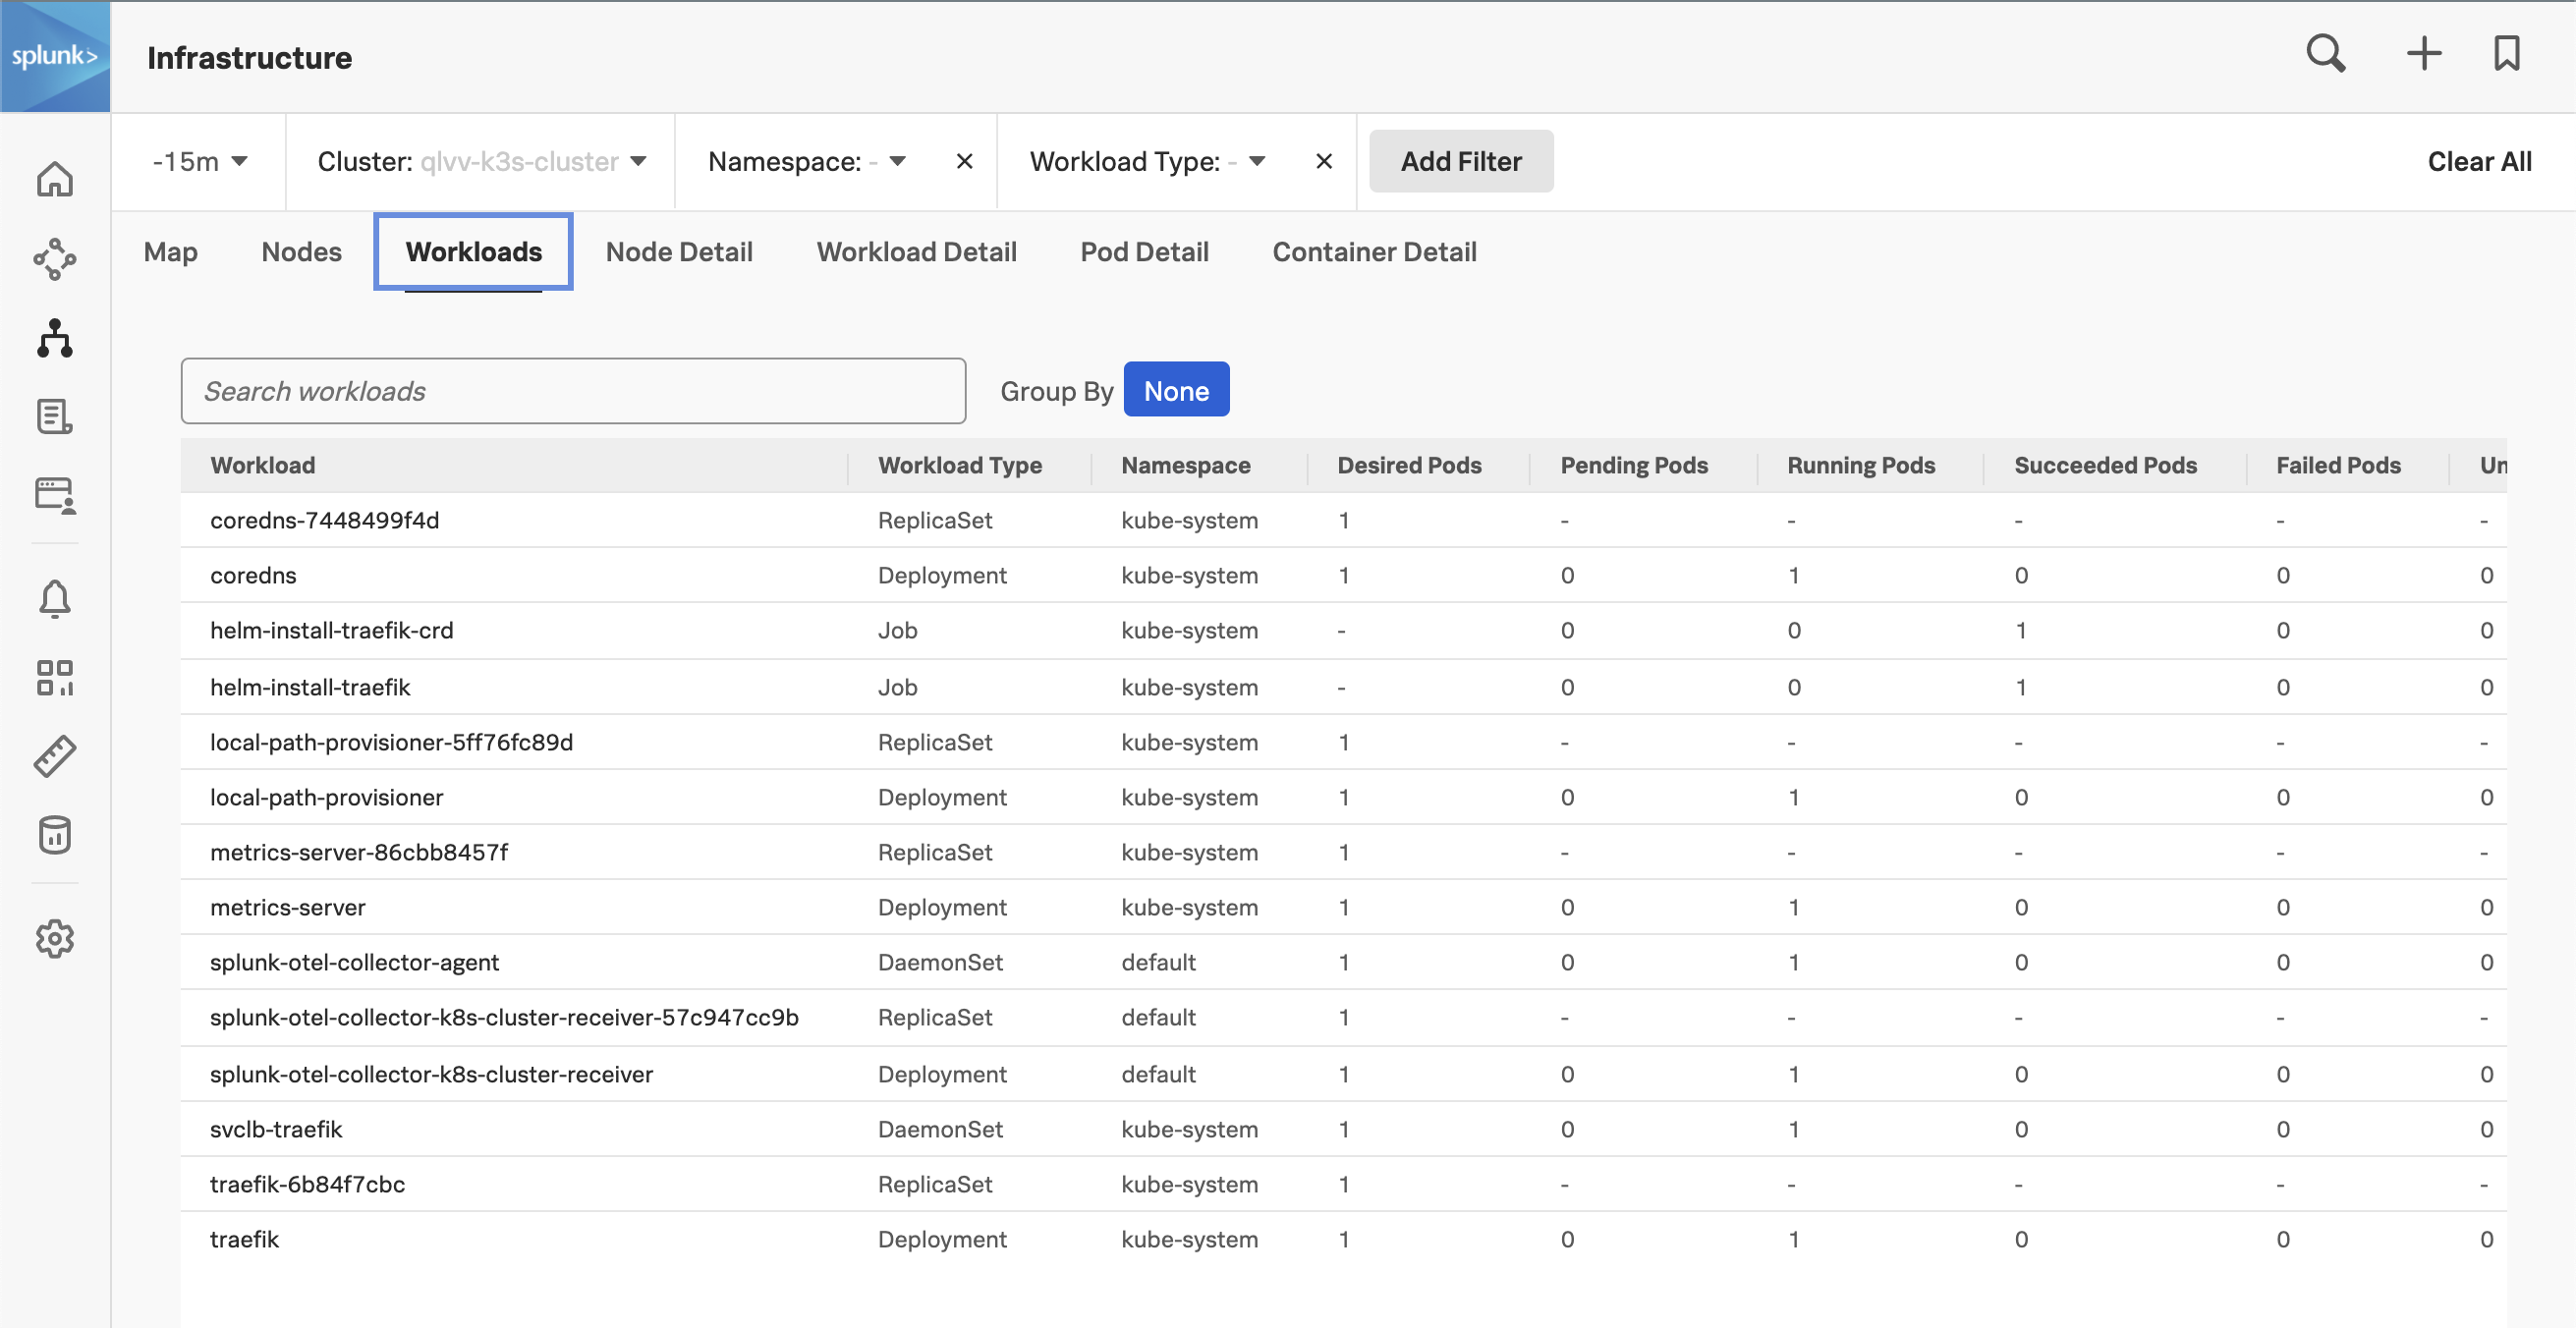
Note the single agent container running per node among the default Kubernetes pods. This single container will monitor all the pods and services being deployed on this node!
Now switch back to the default cluster node view by selecting the MAP tab and selecting your cluster again.
In your AWS/EC2 or Multipass shell session change into the nginx directory:
cd ~/workshop/k3s/nginx2. Create NGINX deployment #
Create the NGINX ConfigMap1 using the nginx.conf file:
kubectl create configmap nginxconfig --from-file=nginx.confThen create the deployment:
kubectl create -f nginx-deployment.yamlNext, we will deploy Locust2 which is an open-source tool used for creating a load test against NGINX:
kubectl create -f locust-deployment.yamlValidate the deployment has been successful and that the Locust and NGINX pods are running.
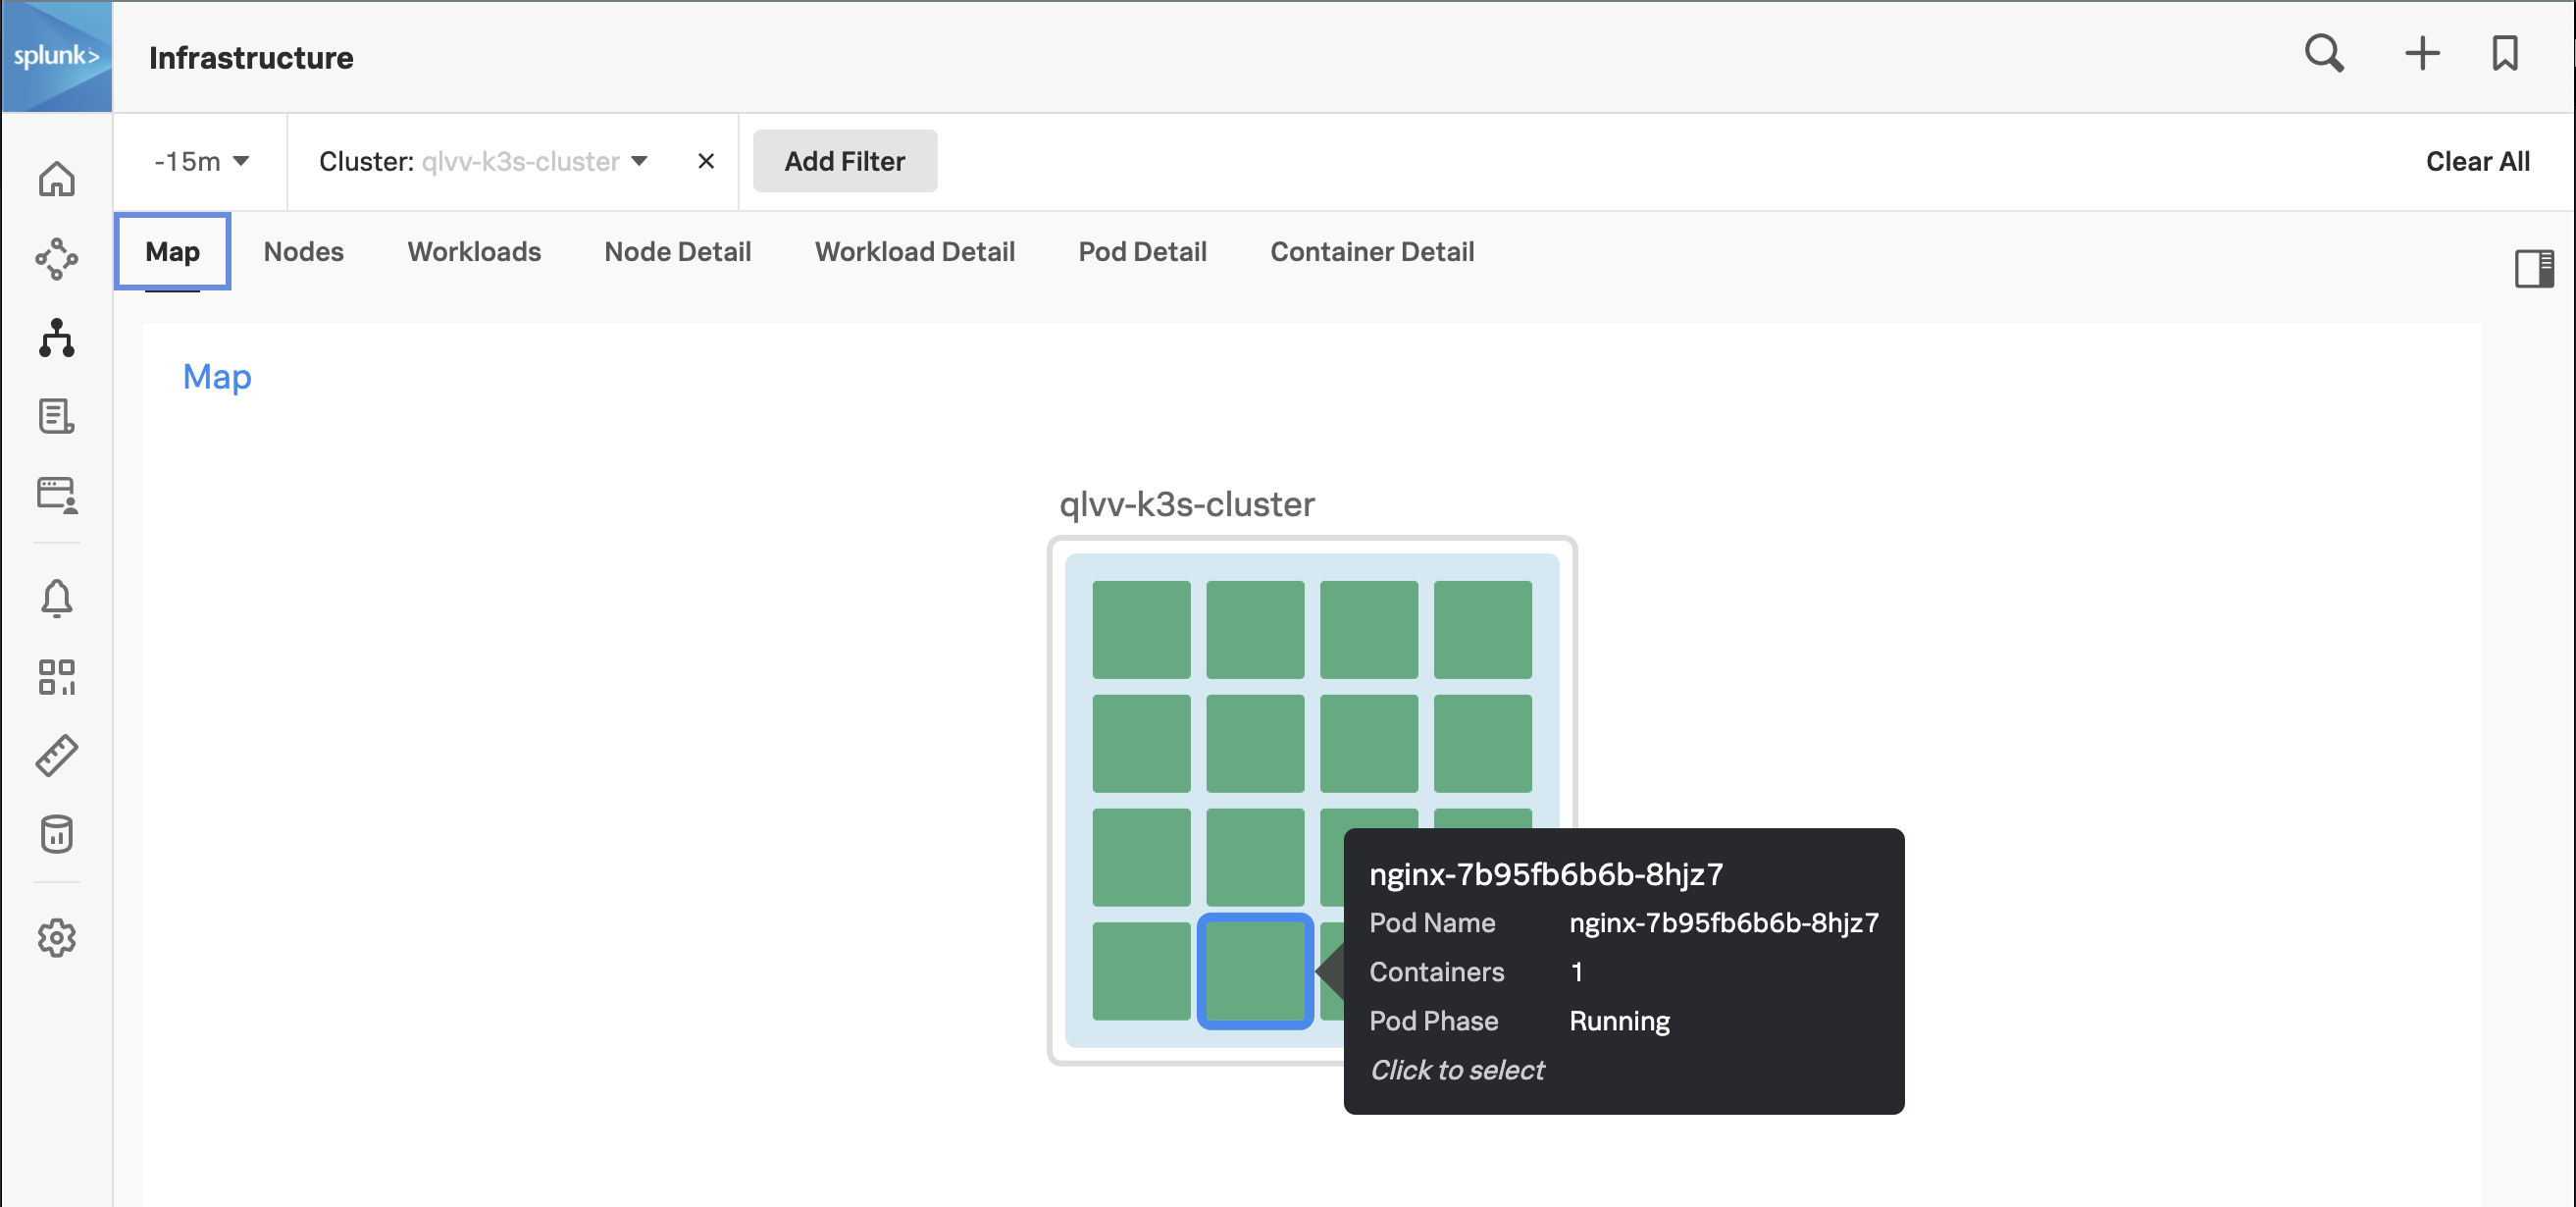
If you have the Splunk UI open you should see new Pods being started and containers being deployed.
It should only take around 20 seconds for the pods to transition into a Running state. In the Splunk UI you will have a cluster that looks like the screenshot below:
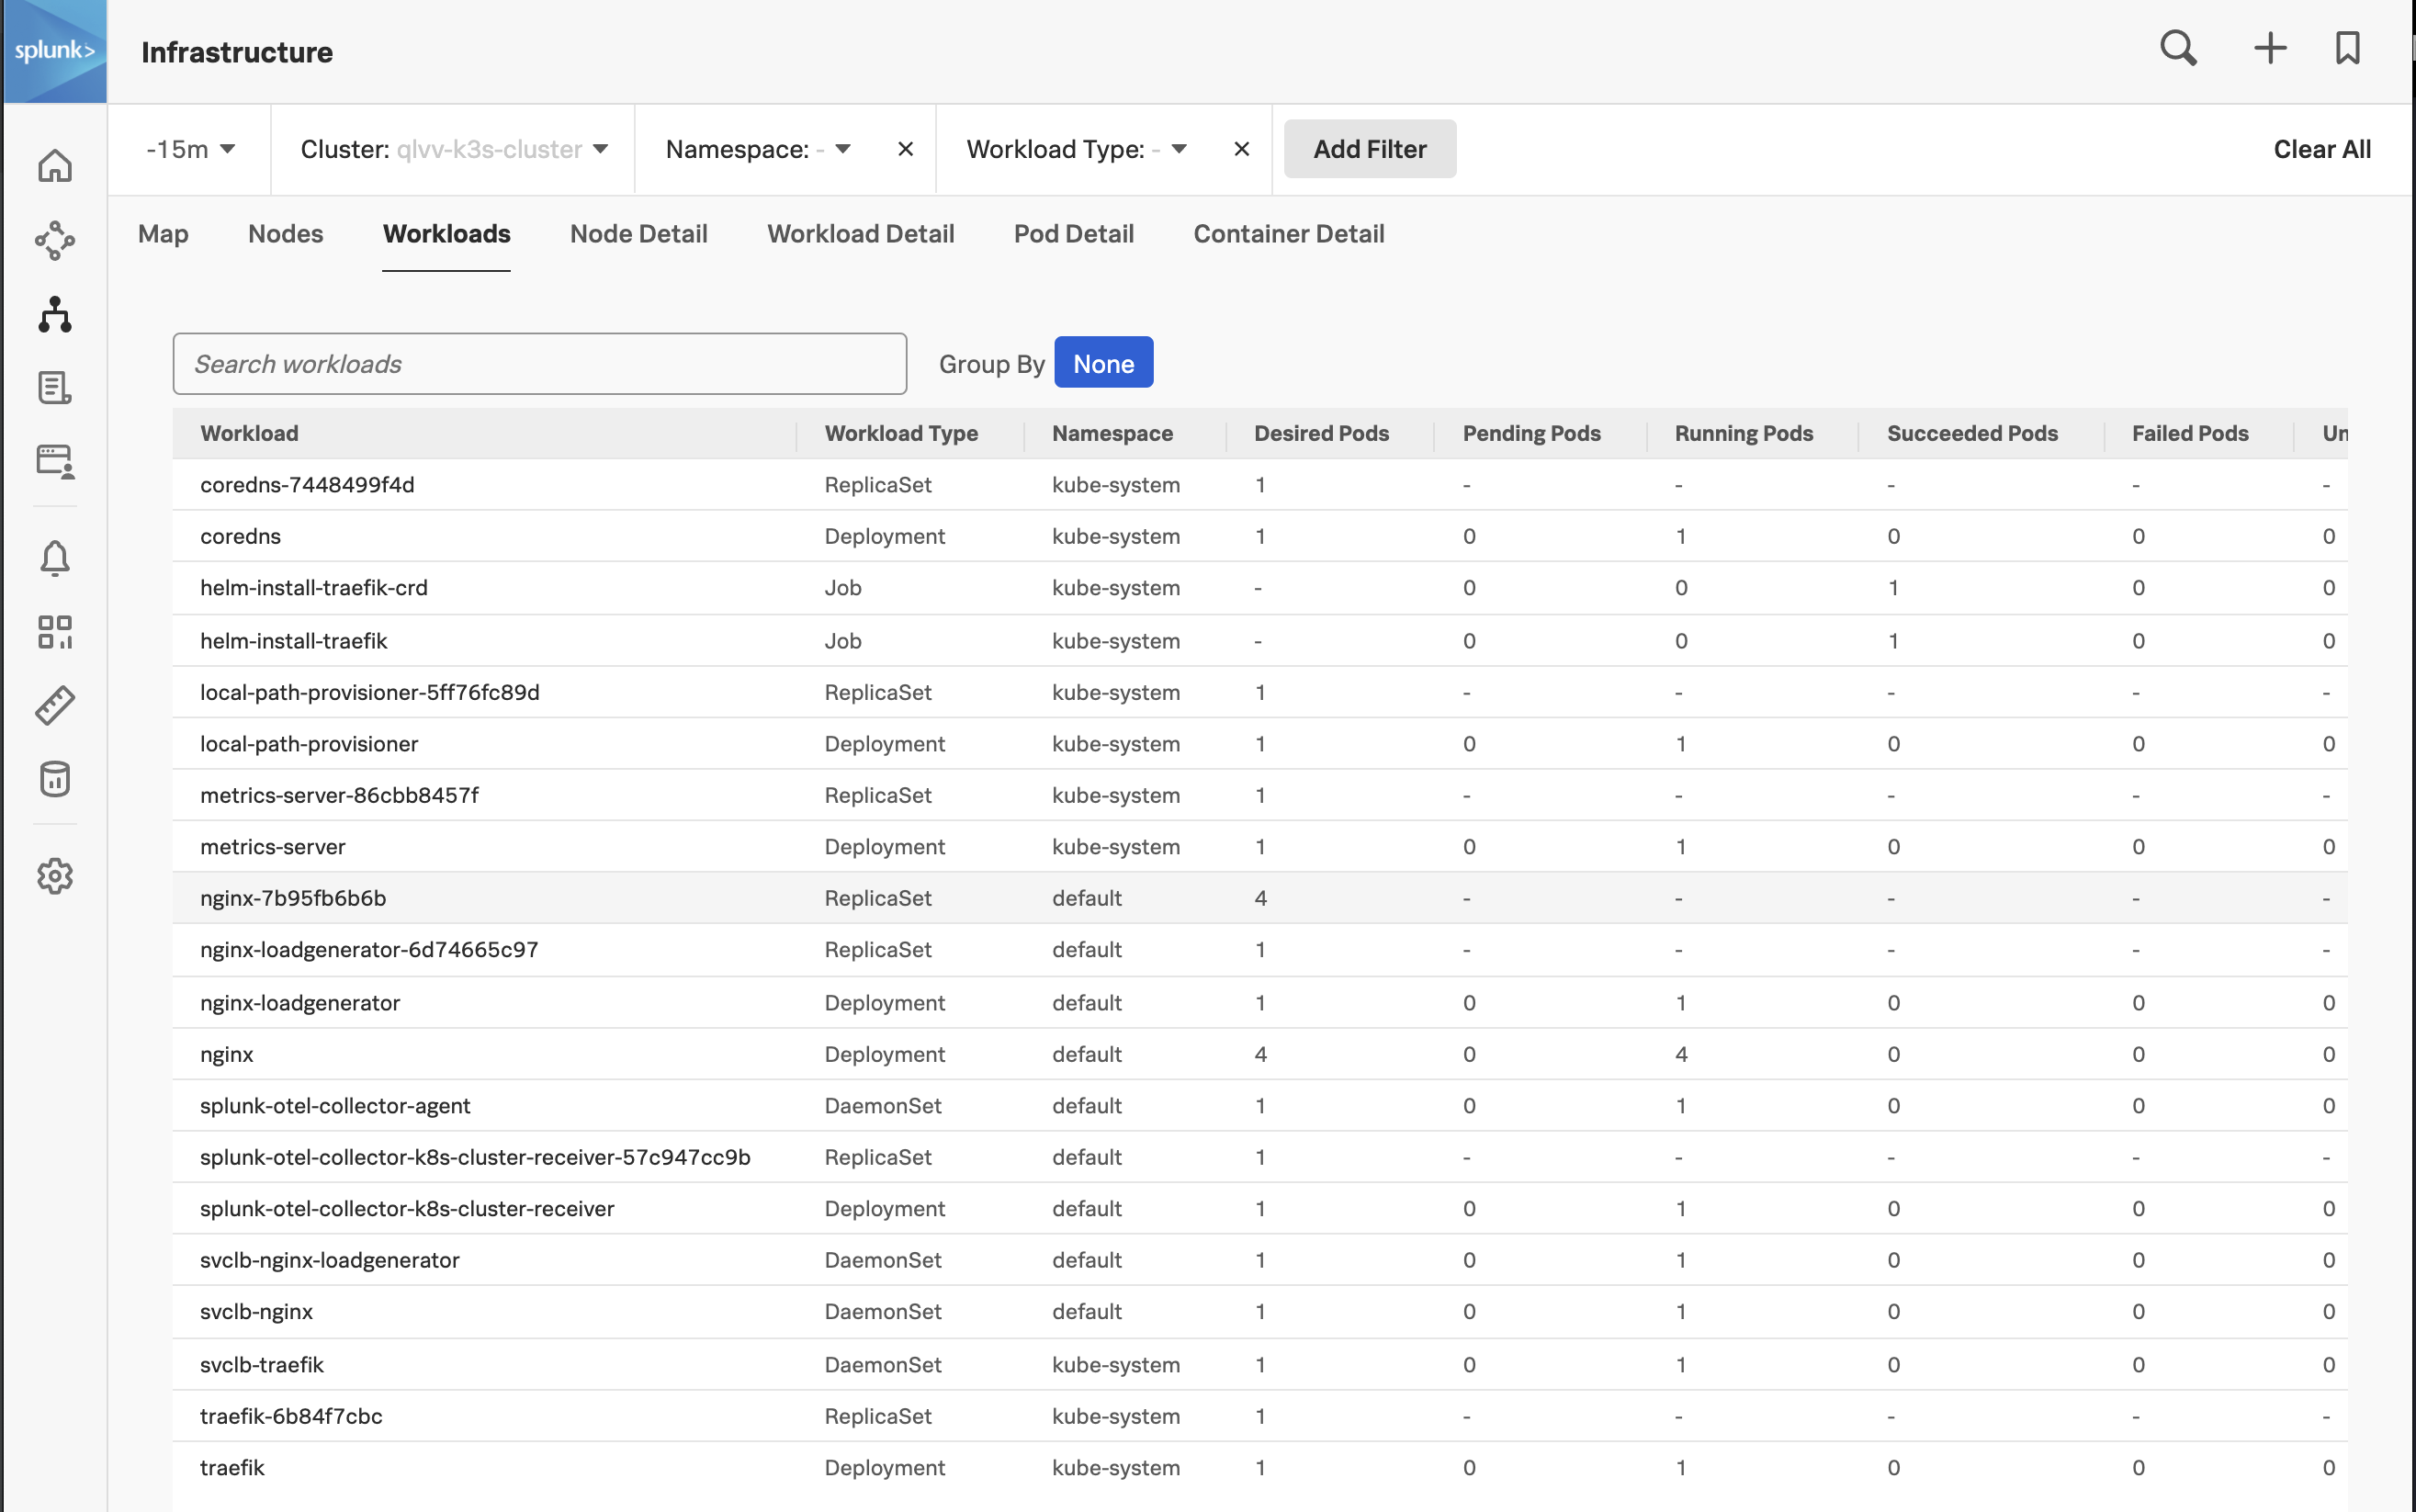
If you select the WORKLOADS tab again you will now see that there is a new ReplicaSet and a deployment added for NGINX:
Let’s validate this in your shell as well:
kubectl get pods3. Run Locust load test #
Locust, an open-source load generator, is available on port 8083 of the EC2 instance’s IP address. Open a new tab in your web browser and go to http://{==EC2-IP==}:8083/, you will then be able to see the Locust running.
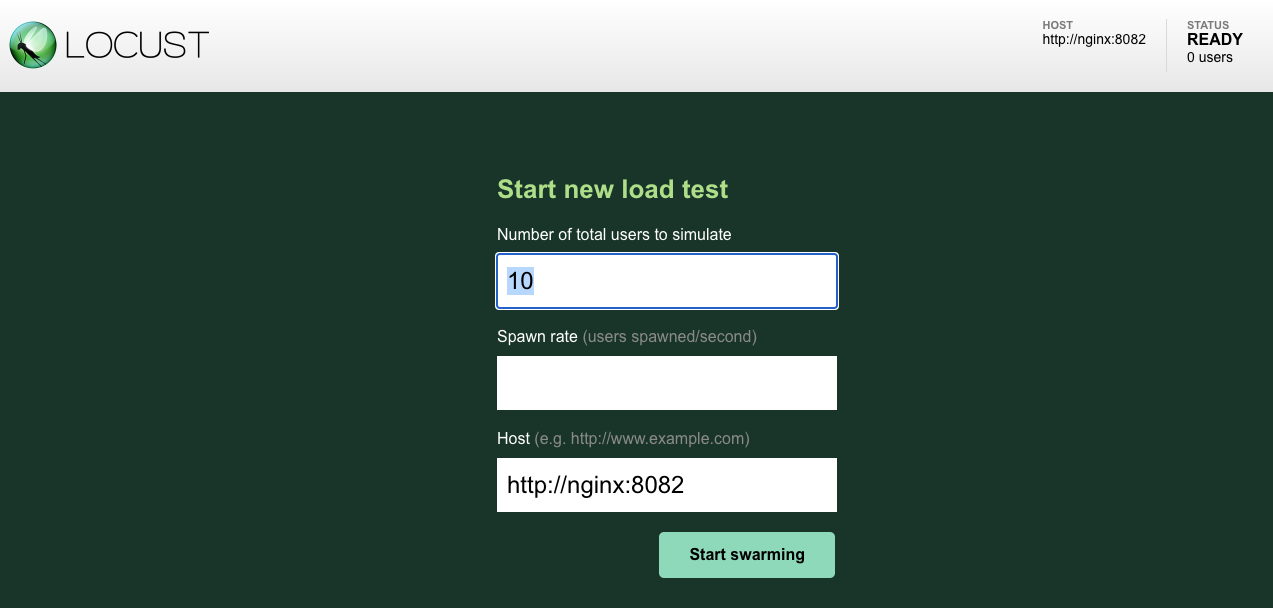
Set the Spawn rate to 2 and click Start Swarming.
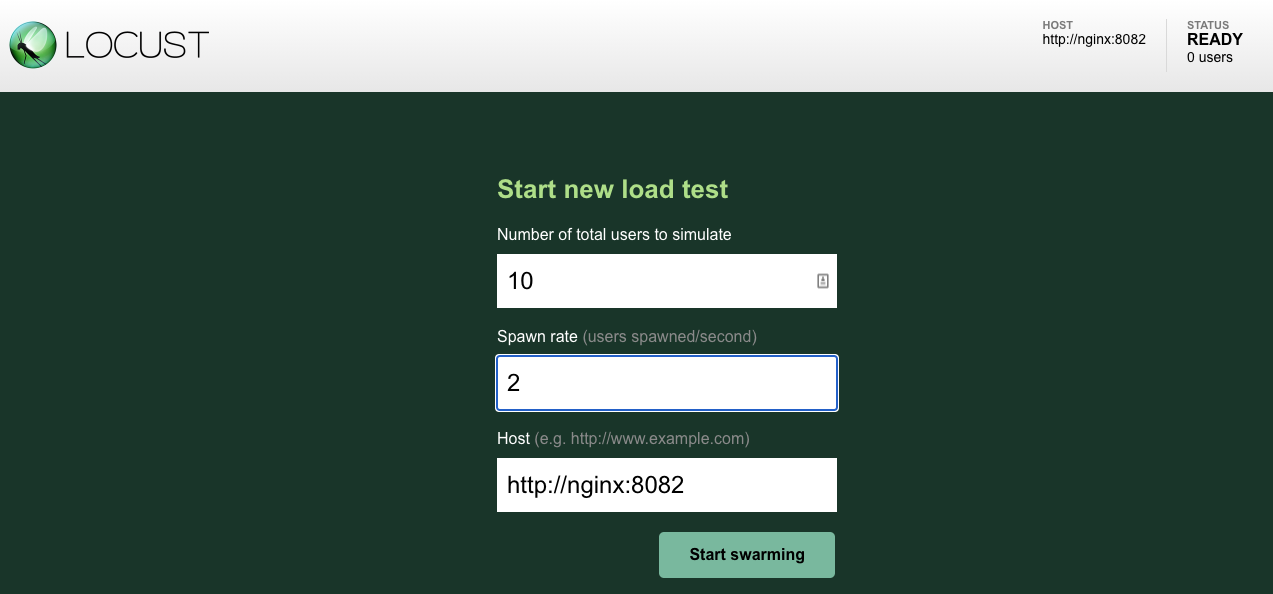
This will start a gentle continuous load on the application.
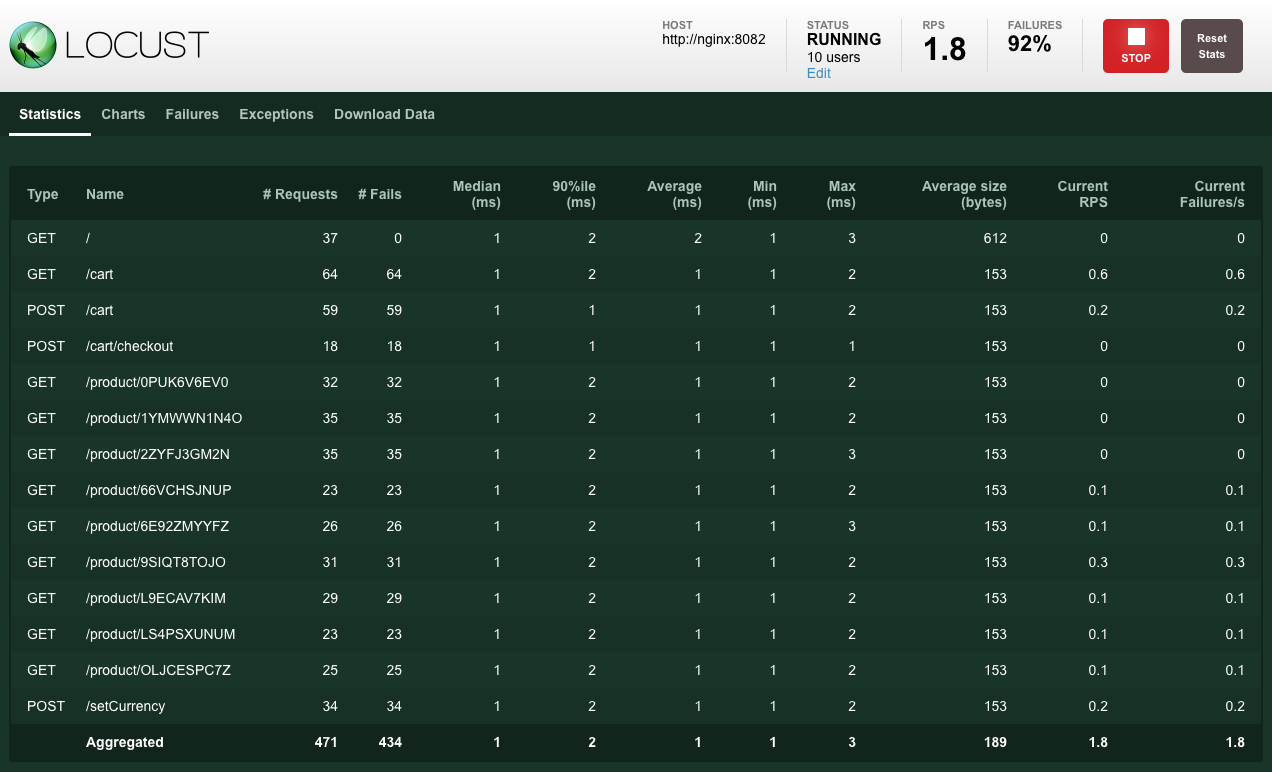
As you can see from the above screenshot, most of the calls will report a fail, this is expected, as we have not yet deployed the application behind it, however, NGINX is reporting on your attempts and you should be able to see those metrics.
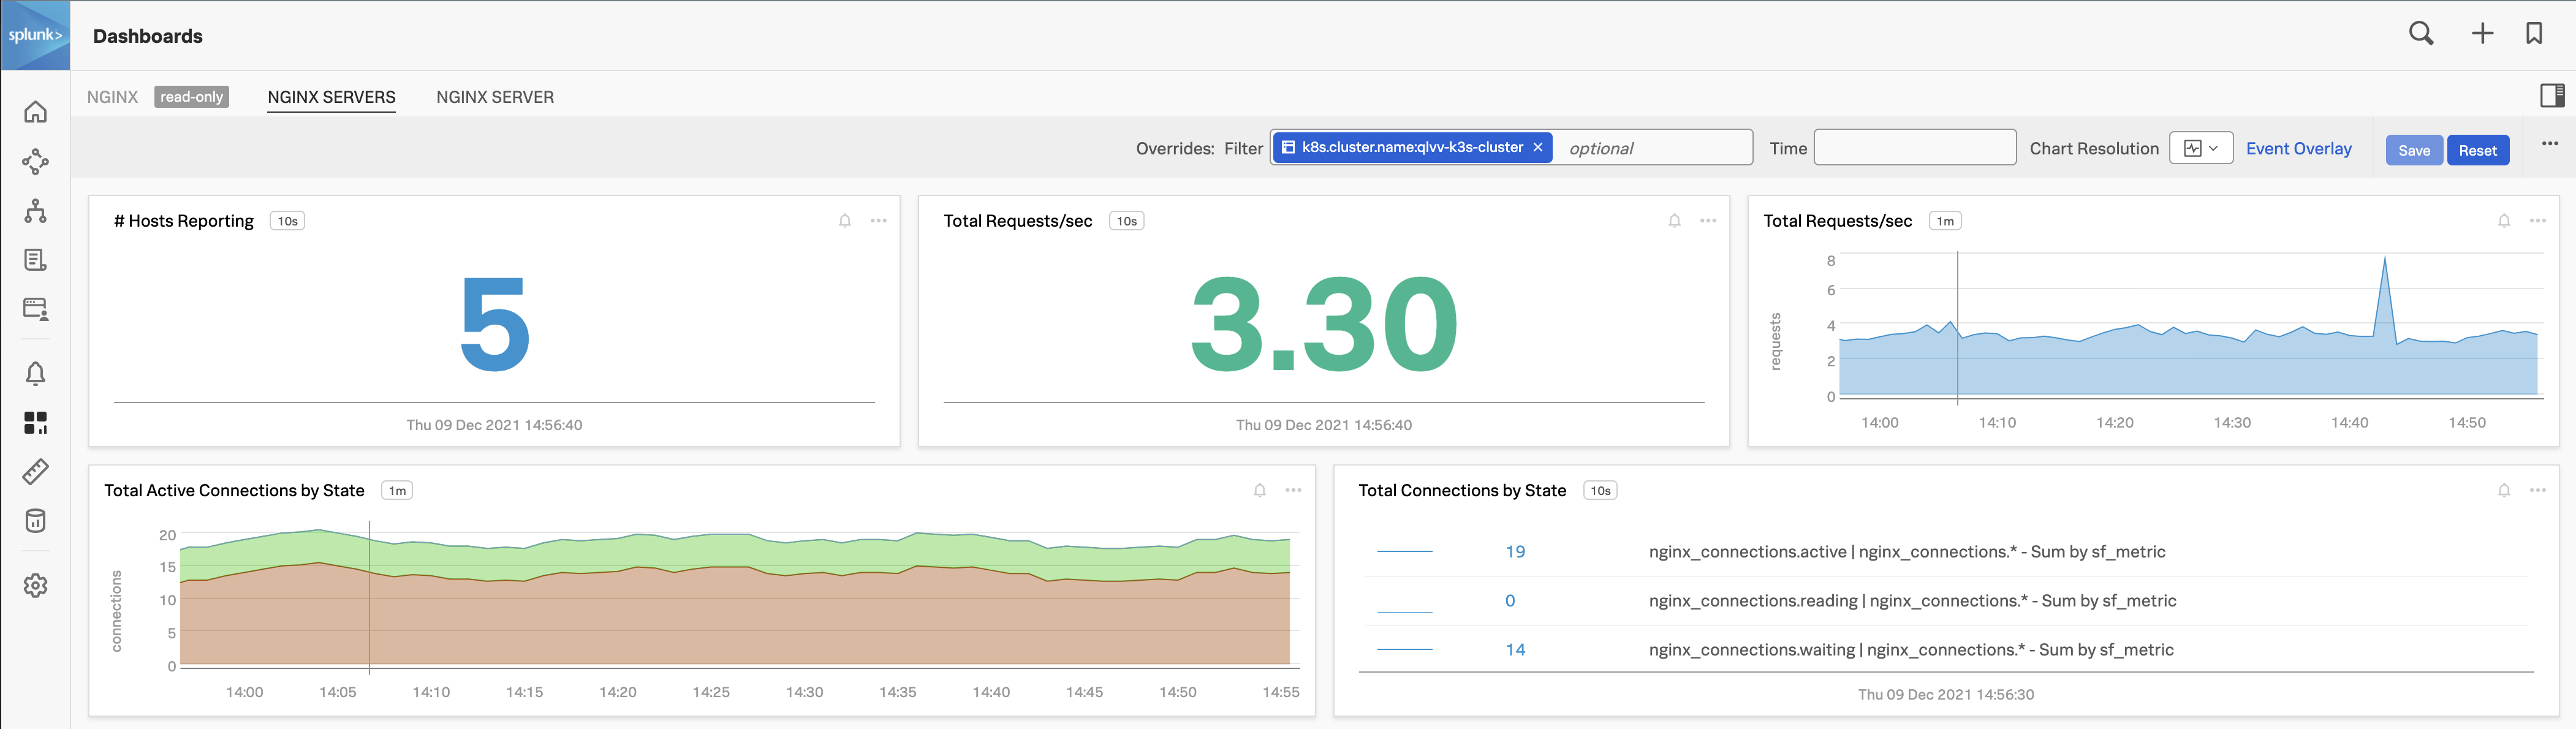
Validate you are seeing those metrics in the UI by selecting Dashboards → Built-in Dashboard Groups → NGINX → NGINX Servers. Using the Overrides filter on k8s.cluster.name:, find the name of your cluster as returned by echo $INSTANCE-k3s-cluster in the terminal.
A ConfigMap is an API object used to store non-confidential data in key-value pairs. Pods can consume ConfigMaps as environment variables, command-line arguments, or configuration files in a volume. A ConfigMap allows you to decouple environment-specific configuration from your container images so that your applications are easily portable. ↩︎