Getting Data In (GDI) with OTel and UF
Deploy Complex Environments and Capture Metrics
Objective: Learn how to efficiently deploy complex infrastructure components such as Kafka and MongoDB to demonstrate metrics collection with Splunk O11y IM integrations
Duration: 15 Minutes
Scenario #
A prospect uses Kafka and MongoDB in their environment. Since there are integrations for these services, you’d like to demonstrate this to the prospect. What is a quick and efficient way to set up a live environment with these services and have metrics collected?
1. Where can I find helm charts? #
- Google “myservice helm chart”
https://artifacthub.io/(Note: Look for charts from trusted organizations, with high star count and frequent updates)
2. Review Apache Kafka packaged by Bitnami #
We will deploy the helm chart with these options enabled:
replicaCount=3metrics.jmx.enabled=truemetrics.kafka.enabled=truedeleteTopicEnable=true
3. Review MongoDB(R) packaged by Bitnami #
We will deploy the helm chart with these options enabled:
version 12.1.31metrics.enabled=trueglobal.namespaceOverride=defaultauth.rootUser=rootauth.rootPassword=splunkauth.enabled=false
4. Install Kafka and MongoDB with helm charts #
helm repo add bitnami https://charts.bitnami.com/bitnamihelm install kafka --set replicaCount=3 --set metrics.jmx.enabled=true --set metrics.kafka.enabled=true --set deleteTopicEnable=true bitnami/kafkahelm install mongodb --set metrics.enabled=true bitnami/mongodb --set global.namespaceOverride=default --set auth.rootUser=root --set auth.rootPassword=splunk --set auth.enabled=false --version 12.1.31Verify the helm chart installation
helm listNAME NAMESPACE REVISION UPDATED STATUS CHART APP VERSION
kafka default 1 2022-11-14 11:21:36.328956822 -0800 PST deployed kafka-19.1.3 3.3.1
mongodb default 1 2022-11-14 11:19:36.507690487 -0800 PST deployed mongodb-12.1.31 5.0.10Verify the helm chart installation
kubectl get podsNAME READY STATUS RESTARTS AGE
kafka-exporter-595778d7b4-99ztt 0/1 ContainerCreating 0 17s
mongodb-b7c968dbd-jxvsj 0/2 Pending 0 6s
kafka-1 0/2 ContainerCreating 0 16s
kafka-2 0/2 ContainerCreating 0 16s
kafka-zookeeper-0 0/1 Pending 0 17s
kafka-0 0/2 Pending 0 17sUse information for each Helm chart and Splunk O11y Data Setup to generate values.yaml for capturing metrics from Kafka and MongoDB.
Note
values.yaml for the different services will be passed to the Splunk Helm Chart at installation time. These will configure the OTEL collector to capture metrics from these services.- References:
4.1 Example kafka.values.yaml #
otelAgent:
config:
    receivers:
    receiver_creator:
        receivers:
        smartagent/kafka:
            rule: type == "pod" && name matches "kafka"
            config:
                    #endpoint: '`endpoint`:5555'
            port: 5555
            type: collectd/kafka
            clusterName: sl-kafka
otelK8sClusterReceiver:
k8sEventsEnabled: true
config:
    receivers:
    kafkametrics:
        brokers: kafka:9092
        protocol_version: 2.0.0
        scrapers:
        - brokers
        - topics
        - consumers
    service:
    pipelines:
        metrics:
        receivers:
                #- prometheus
        - k8s_cluster
        - kafkametrics
4.2 Example mongodb.values.yaml #
otelAgent:
    config:
        receivers:
        receiver_creator:
            receivers:
            smartagent/mongodb:
                rule: type == "pod" && name matches "mongo"
                config:
                type: collectd/mongodb
                host: mongodb.default.svc.cluster.local
                port: 27017
                databases: ["admin", "O11y", "local", "config"]
                sendCollectionMetrics: true
                sendCollectionTopMetrics: true
4.3 Example zookeeper.values.yaml #
otelAgent:
    config:
        receivers:
        receiver_creator:
            receivers:
            smartagent/zookeeper:
                rule: type == "pod" && name matches "kafka-zookeeper"
                config:
                type: collectd/zookeeper
                host: kafka-zookeeper
                port: 2181
5. Install the Splunk OTEL helm chart #
cd /home/splunk/realtime_enrichment/otel_yamls/

helm repo add splunk-otel-collector-chart https://signalfx.github.io/splunk-otel-collector-chart

helm repo updatehelm install --set provider=' ' --set distro=' ' --set splunkObservability.accessToken=$ACCESS_TOKEN --set clusterName=$clusterName --set splunkObservability.realm=$REALM --set otelCollector.enabled='false' --set gateway.enabled='false' --values kafka.values.yaml --values mongodb.values.yaml --values zookeeper.values.yaml --values alwayson.values.yaml --values k3slogs.yaml --generate-name splunk-otel-collector-chart/splunk-otel-collector6. Verify installation #
Verify that the Kafka, MongoDB and Splunk OTEL Collector helm charts are installed, note that names may differ.
helm listNAME NAMESPACE REVISION UPDATED STATUS CHART APP VERSION
kafka default 1 2021-12-07 12:48:47.066421971 -0800 PST deployed kafka-14.4.1 2.8.1
mongodb default 1 2021-12-07 12:49:06.132771625 -0800 PST deployed mongodb-10.29.2 4.4.10
splunk-otel-collector-1638910184 default 1 2021-12-07 12:49:45.694013749 -0800 PST deployed splunk-otel-collector-0.37.1 0.37.1kubectl get podsNAME READY STATUS RESTARTS AGE
kafka-zookeeper-0 1/1 Running 0 18m
kafka-2 2/2 Running 1 18m
mongodb-79cf87987f-gsms8 2/2 Running 0 18m
kafka-1 2/2 Running 1 18m
kafka-exporter-7c65fcd646-dvmtv 1/1 Running 3 18m
kafka-0 2/2 Running 1 18m
splunk-otel-collector-1638910184-agent-27s5c 2/2 Running 0 17m
splunk-otel-collector-1638910184-k8s-cluster-receiver-8587qmh9l 1/1 Running 0 17m7. Verify dashboards #
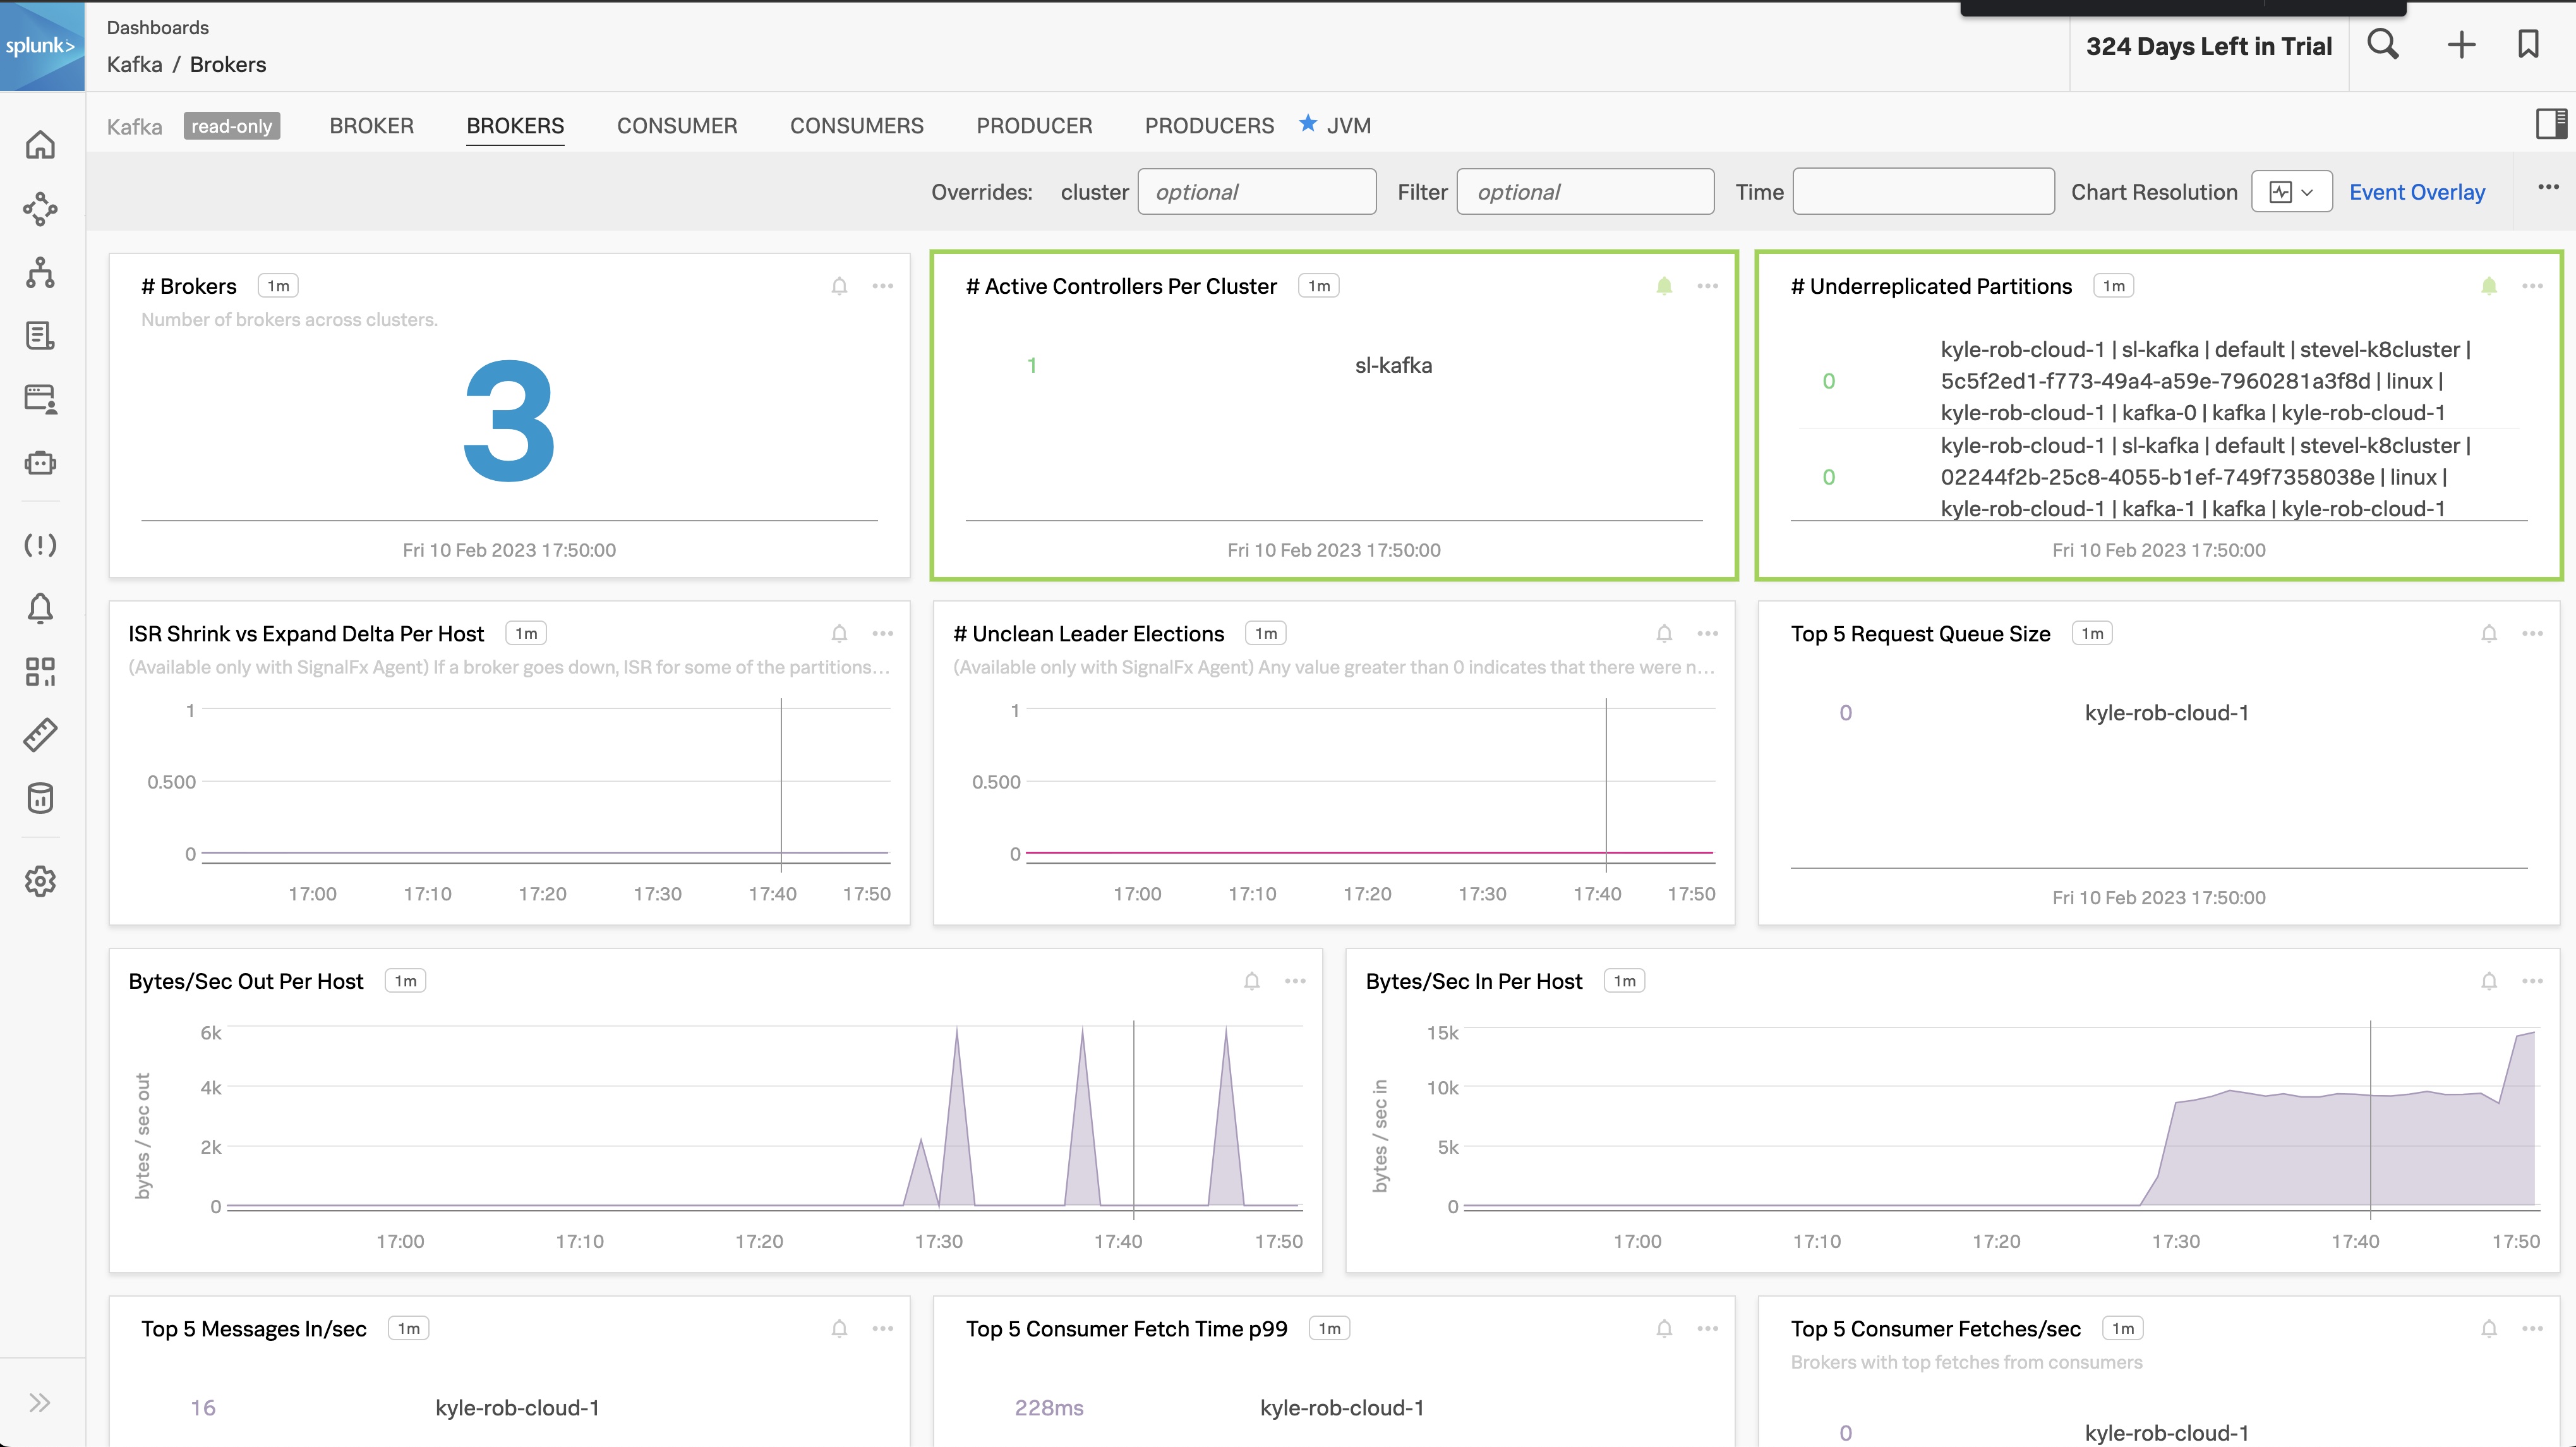
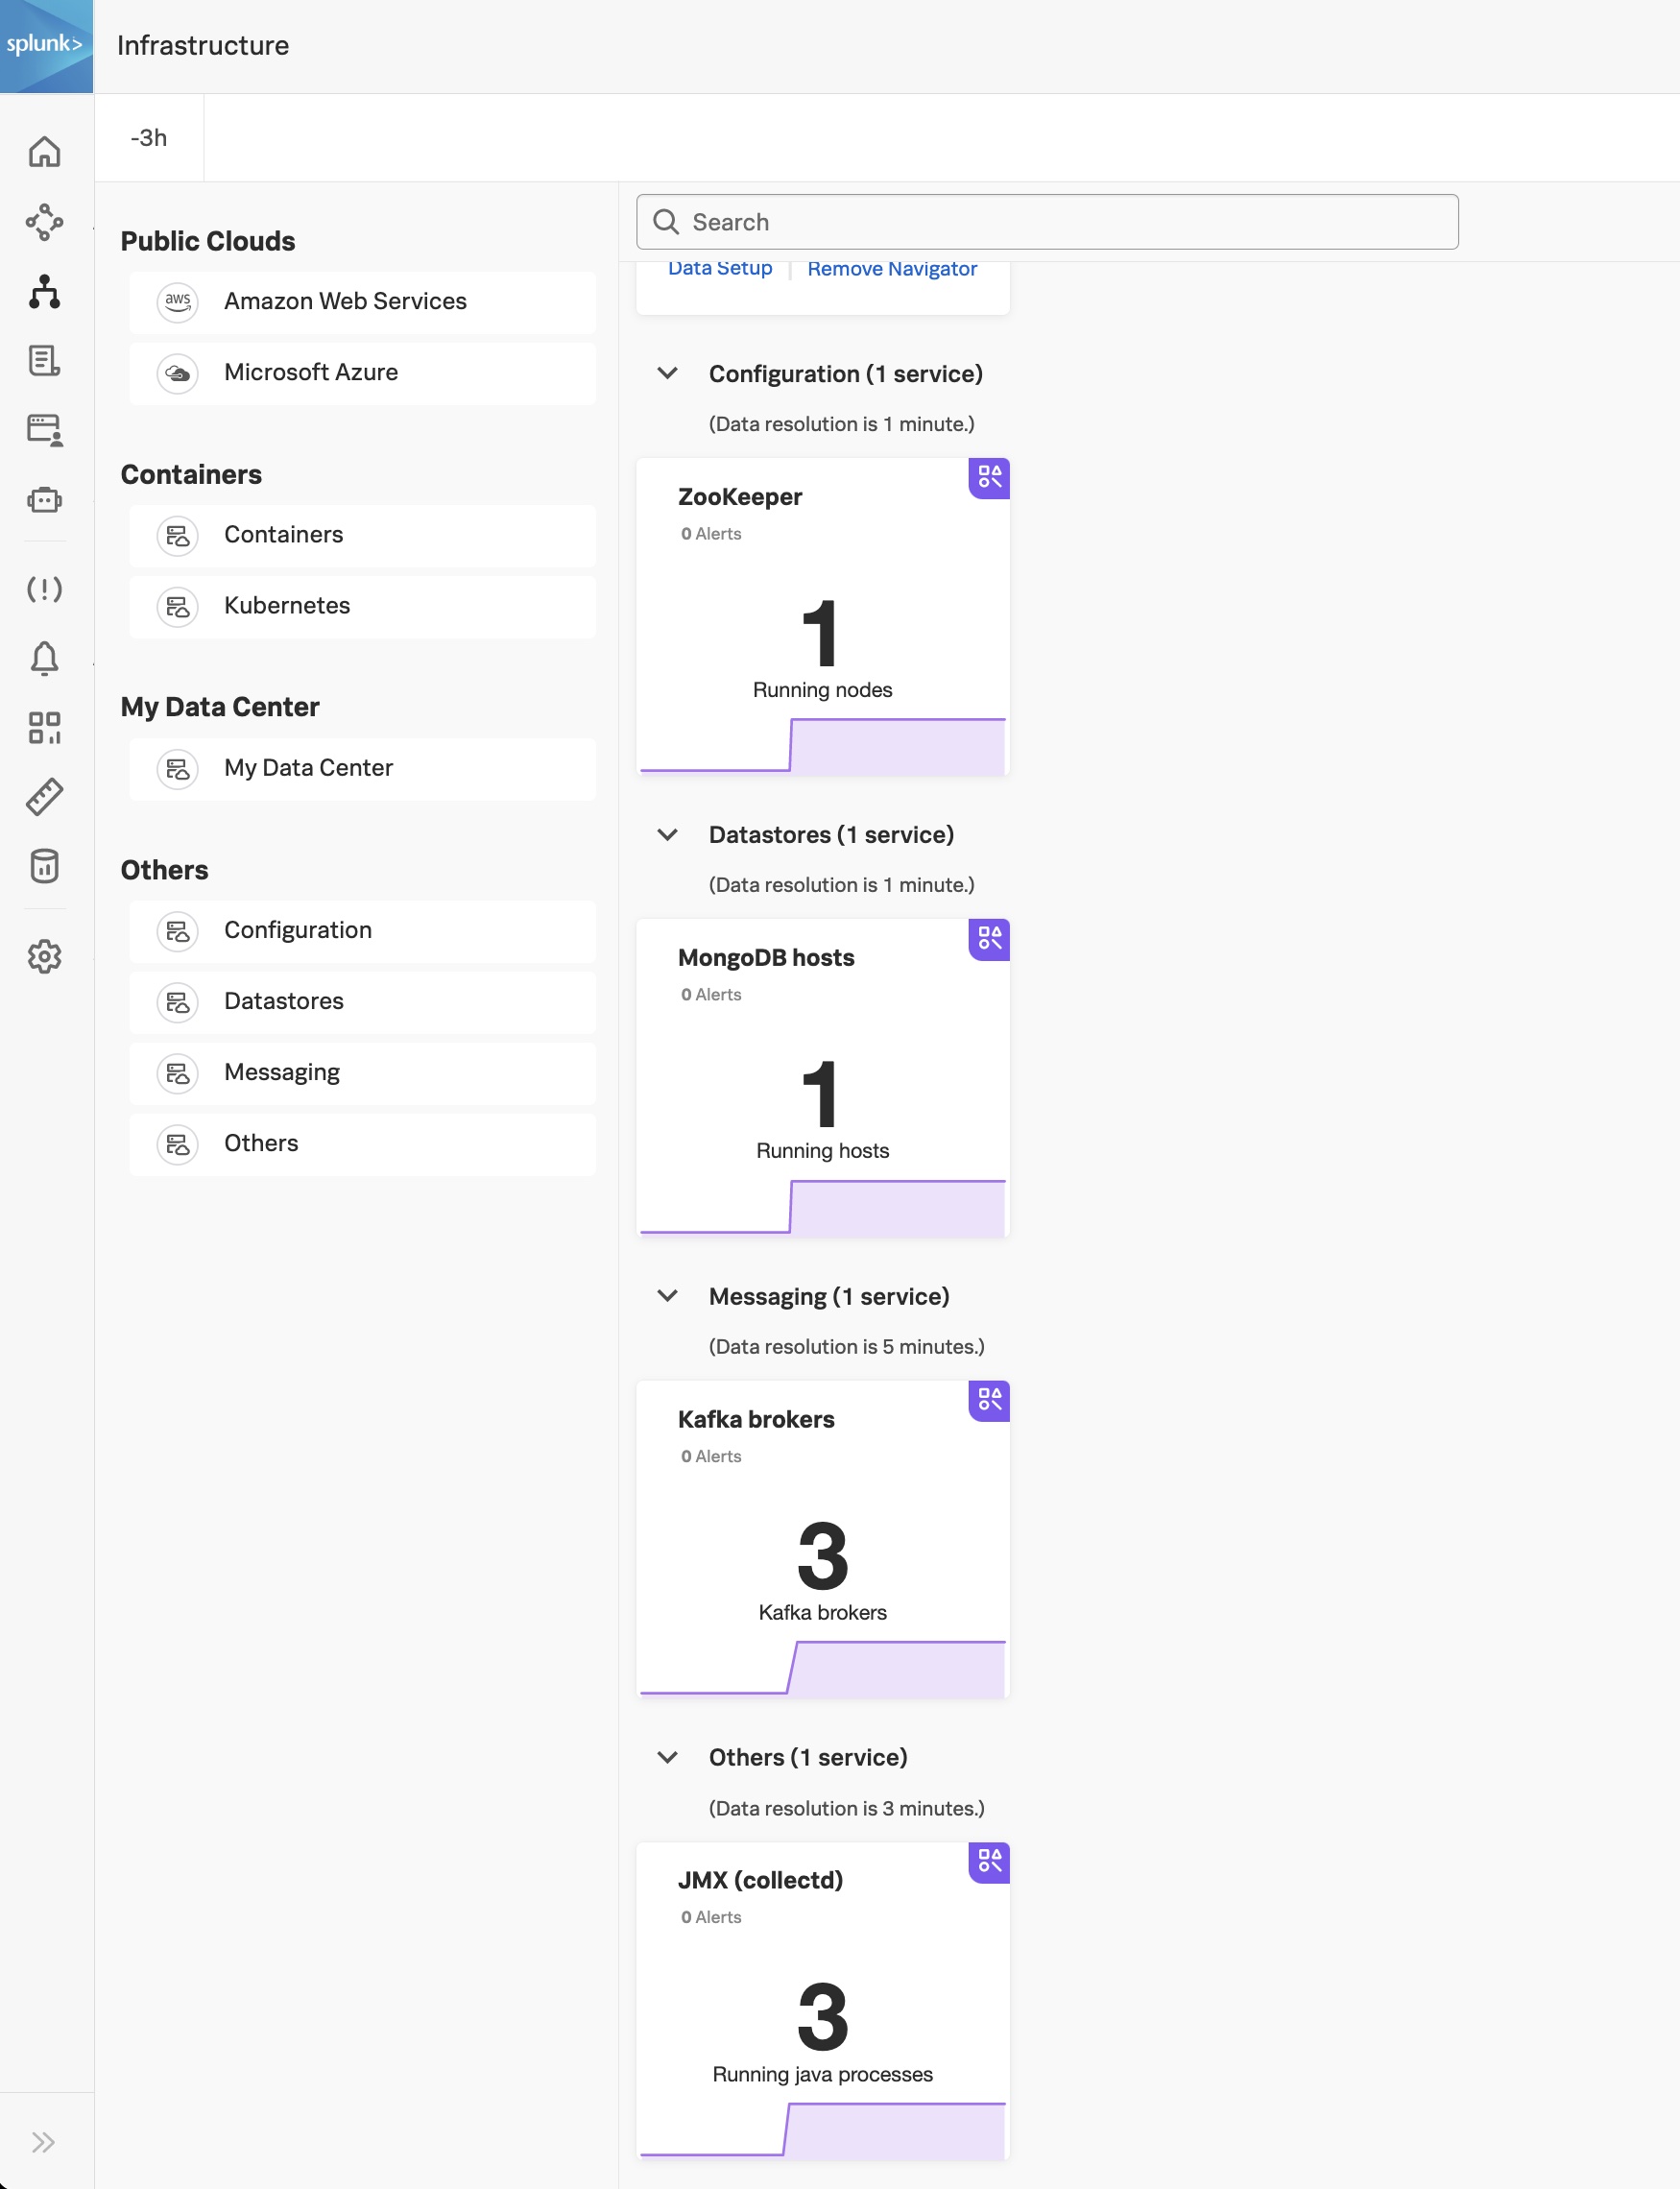
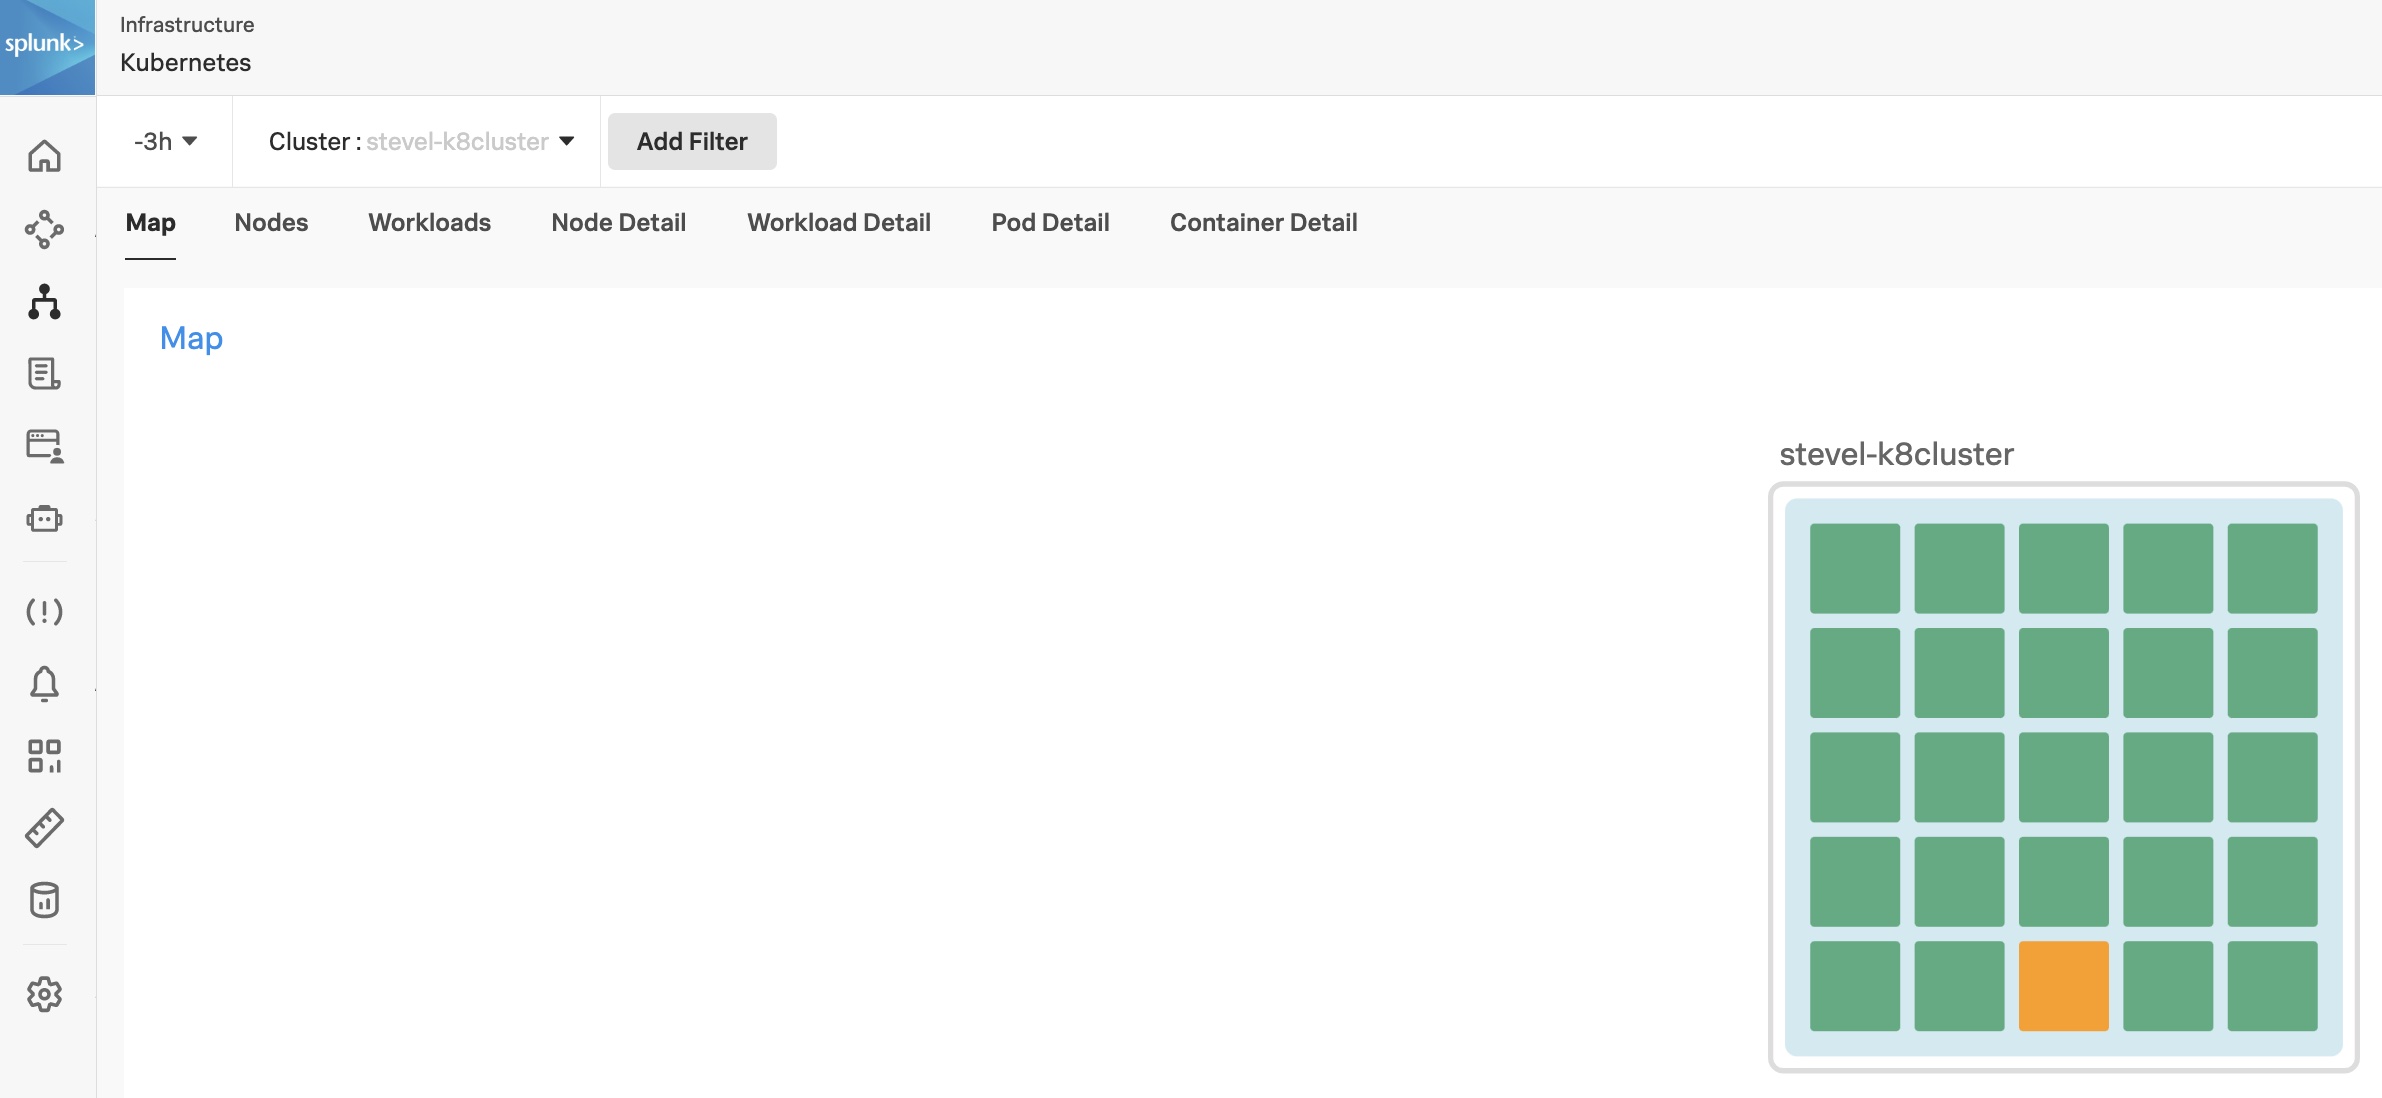
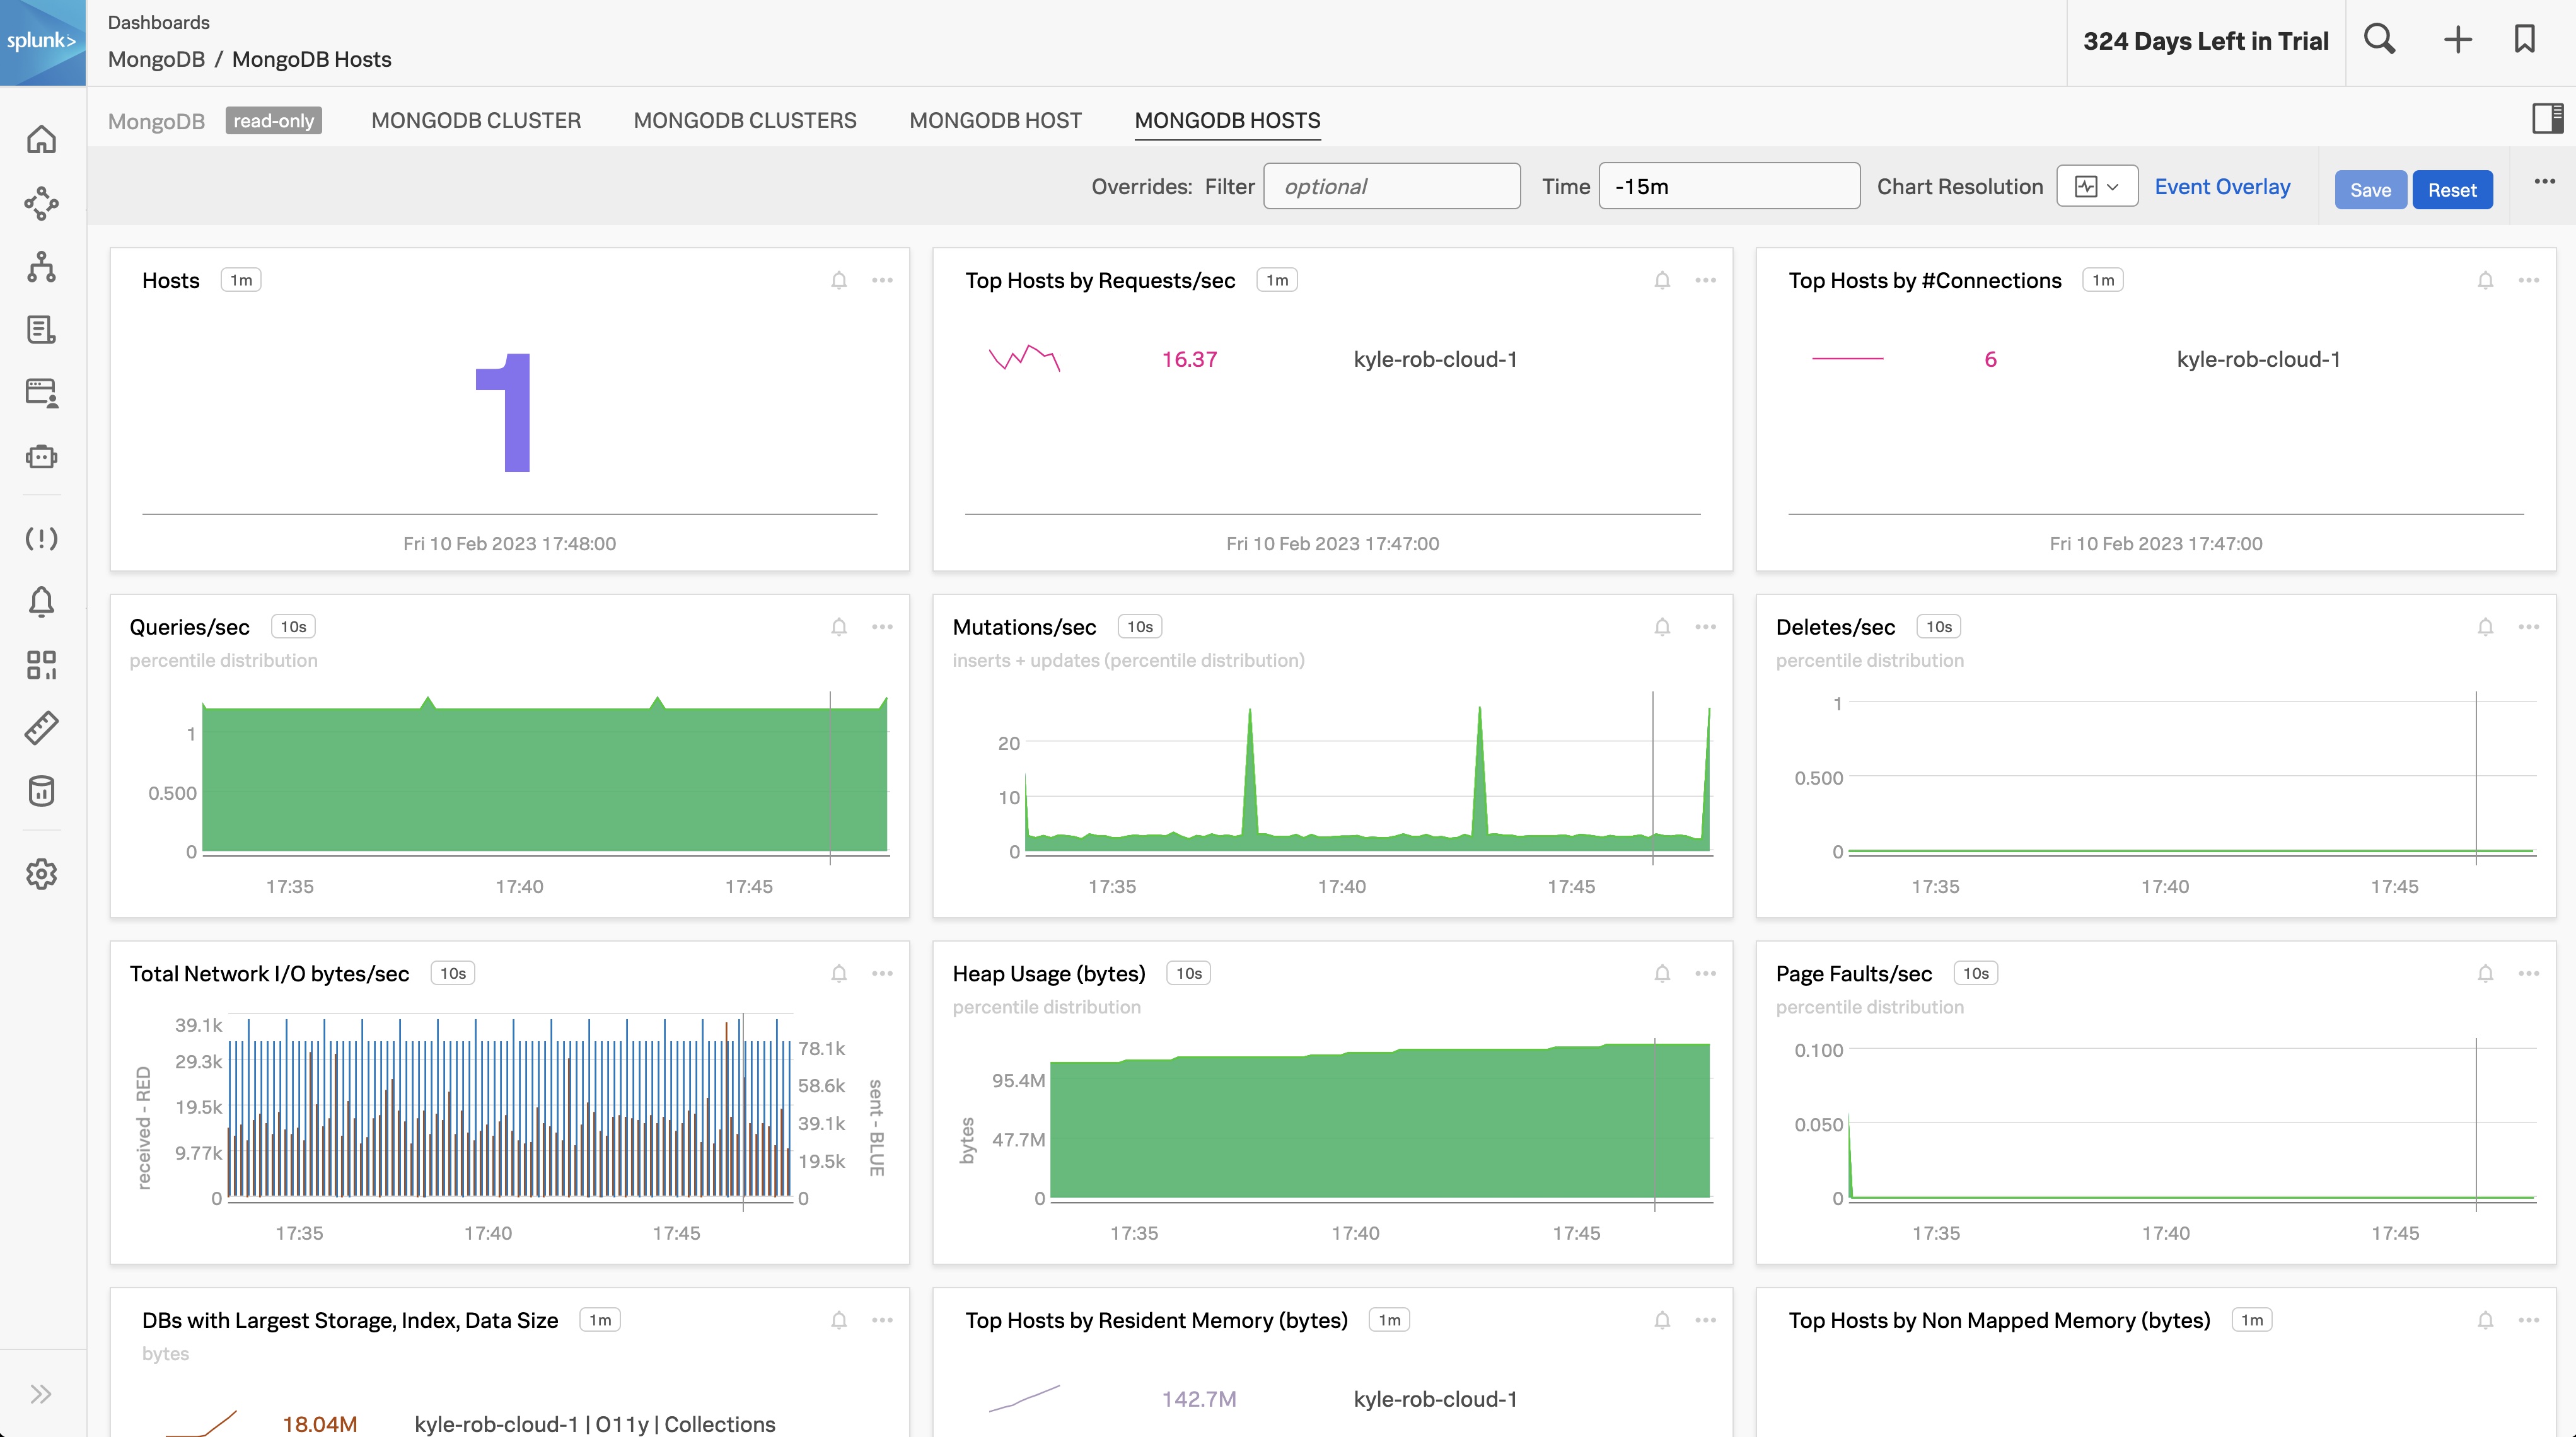
Verify that out of the box dashboards for Kafka, MongoDB and Zookeeper are populated in the Infrastructure Monitor landing page. Drill down into each component to view granular details for each service.
Tip
You can use the filter k8s.cluster.name with your cluster name to find your instance.
- Infrastructure Monitoring Landing page:
- K8 Navigator:
- MongoDB Dashboard:
- Kafka Dashboard: