Splunk Observability Workshops
Splunk Observabilityワークショップへようこそ
Splunk Observability Cloudの監視、分析、対応ツールを使用して、アプリケーションとインフラストラクチャをリアルタイムで把握することができます。
このワークショップでは、メトリクス、トレース、ログを取り込み、監視し、可視化し、分析するためのクラス最高のオブザーバビリティ(可観測性)プラットフォームについて説明します。
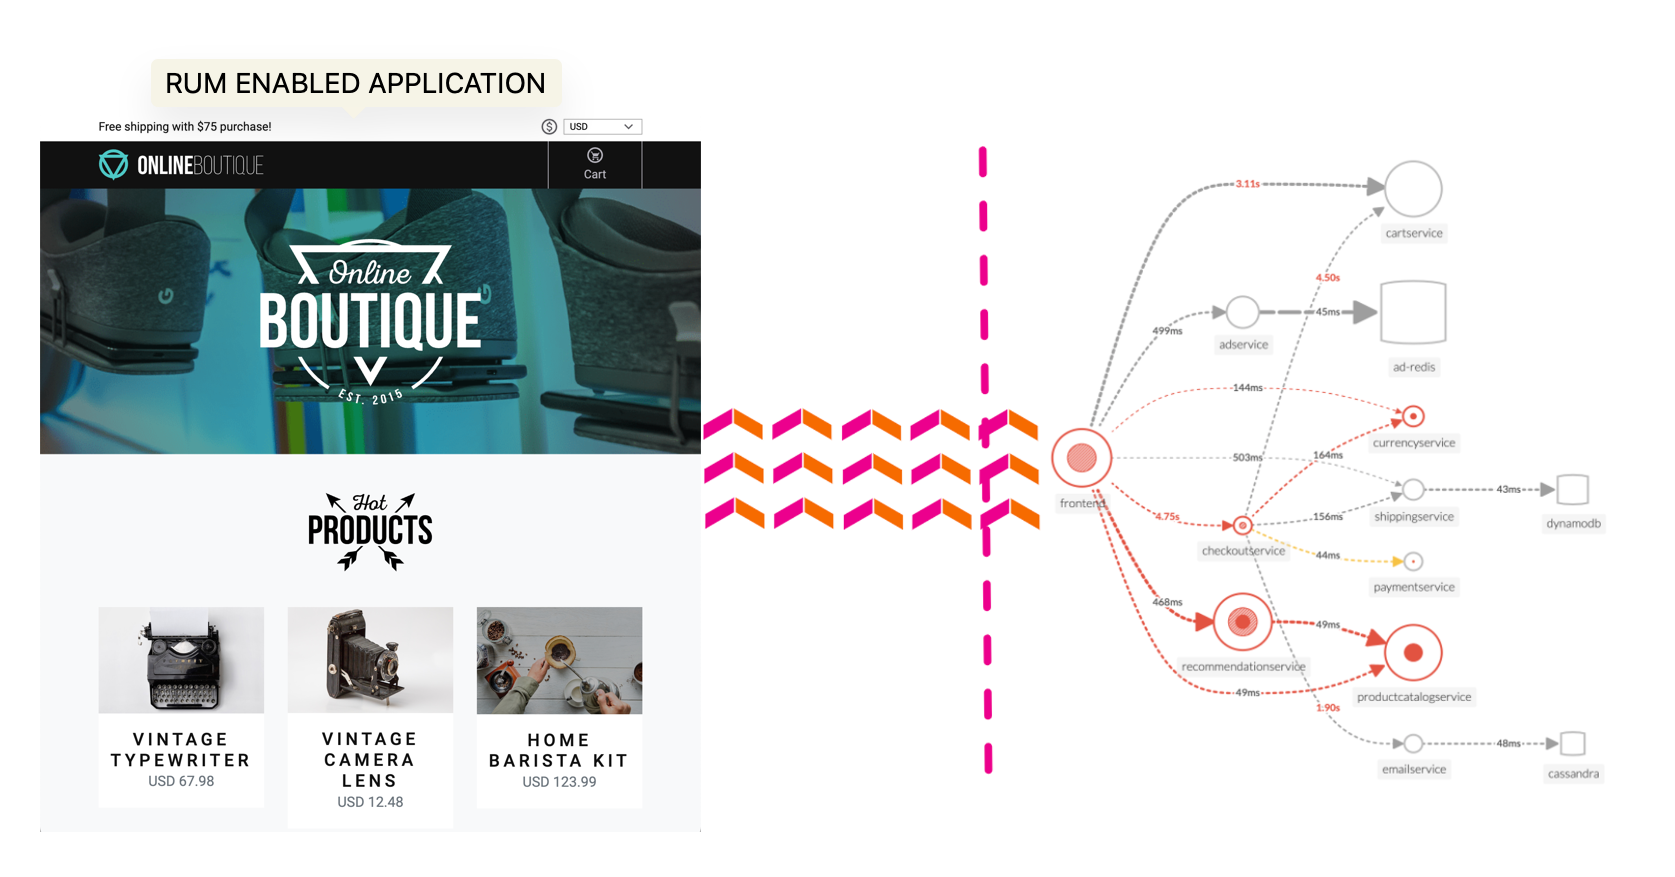
OpenTelemetry
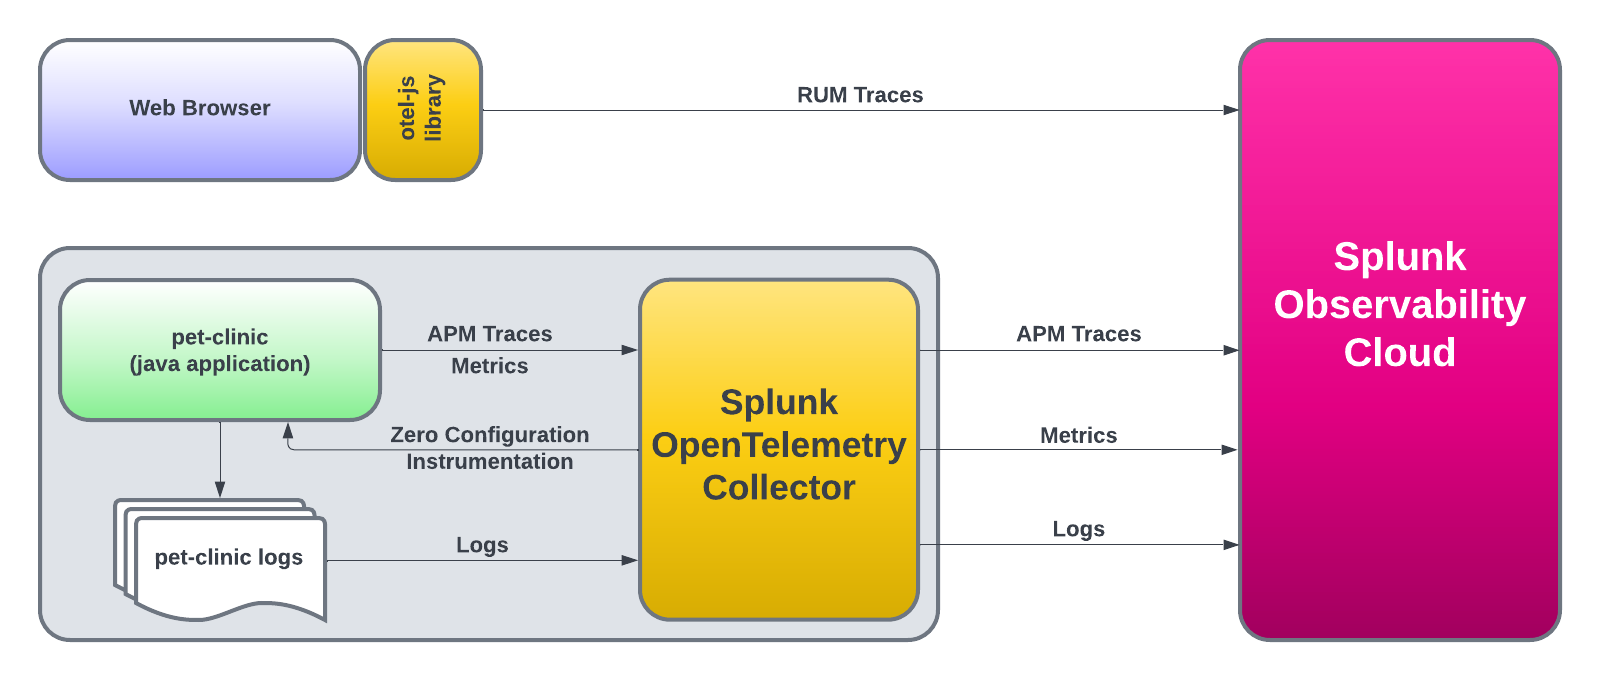
このワークショップでOpenTelemetryをアプリケーションやインフラの分析に役立つテレメトリデータ(メトリクス、トレース、ログ)の計装、生成、収集、エクスポートに使用します。
GitHub
このドキュメントには、issueやpull requestで 貢献 することができます。より良いワークショップにするために、是非ご協力ください。
SplunkのTwitterチャンネルでは、アップデート情報や興味深い読み物を紹介しています。
- 以下は初心者向けワークショップです。
- The following workshops require Ninja skills, wax on, wax off.
- Pet Clinic Java ワークショップ JavaアプリケーションをつかったSplunk Oservabilityのワークショップです OpenTelemetry Collector OpenTelemetry Collectorのコンセプトを学び、Splunk Observability Cloudにデータを送信する方法を理解しましょう。
- よくある質問とその回答 オブザーバビリティ、DevOps、インシデント対応、Splunk On-Callに関連する一般的な質問とその回答を集めました。 ディメンション、プロパティ、タグ ディメンションとプロパティの比較で、どちらかを使うべきかというのはよく議論されます。 OpenTelemetryでのタグ付け 大規模な組織で OpenTelemetry を展開する際には、タグ付けのための標準化された命名規則を定義し、規則が遵守されるようにガバナンスプロセスを確立することが重要です。