service:telemetry:logs:level:<info|warn|error>development:<true|false>encoding:<console|json>disable_caller:<true|false>disable_stacktrace:<true|false>output_paths:[<stdout|stderr>, paths...]error_output_paths:[<stdout|stderr>, paths...]initial_fields:key:valuemetrics:level:<none|basic|normal|detailed># Address binds the promethues endpoint to scrapeaddress:<hostname:port>
service:telemetry:logs:level:<info|warn|error>development:<true|false>encoding:<console|json>disable_caller:<true|false>disable_stacktrace:<true|false>output_paths:[<stdout|stderr>, paths...]error_output_paths:[<stdout|stderr>, paths...]initial_fields:key:valuemetrics:level:<none|basic|normal|detailed># Address binds the promethues endpoint to scrapeaddress:<hostname:port>
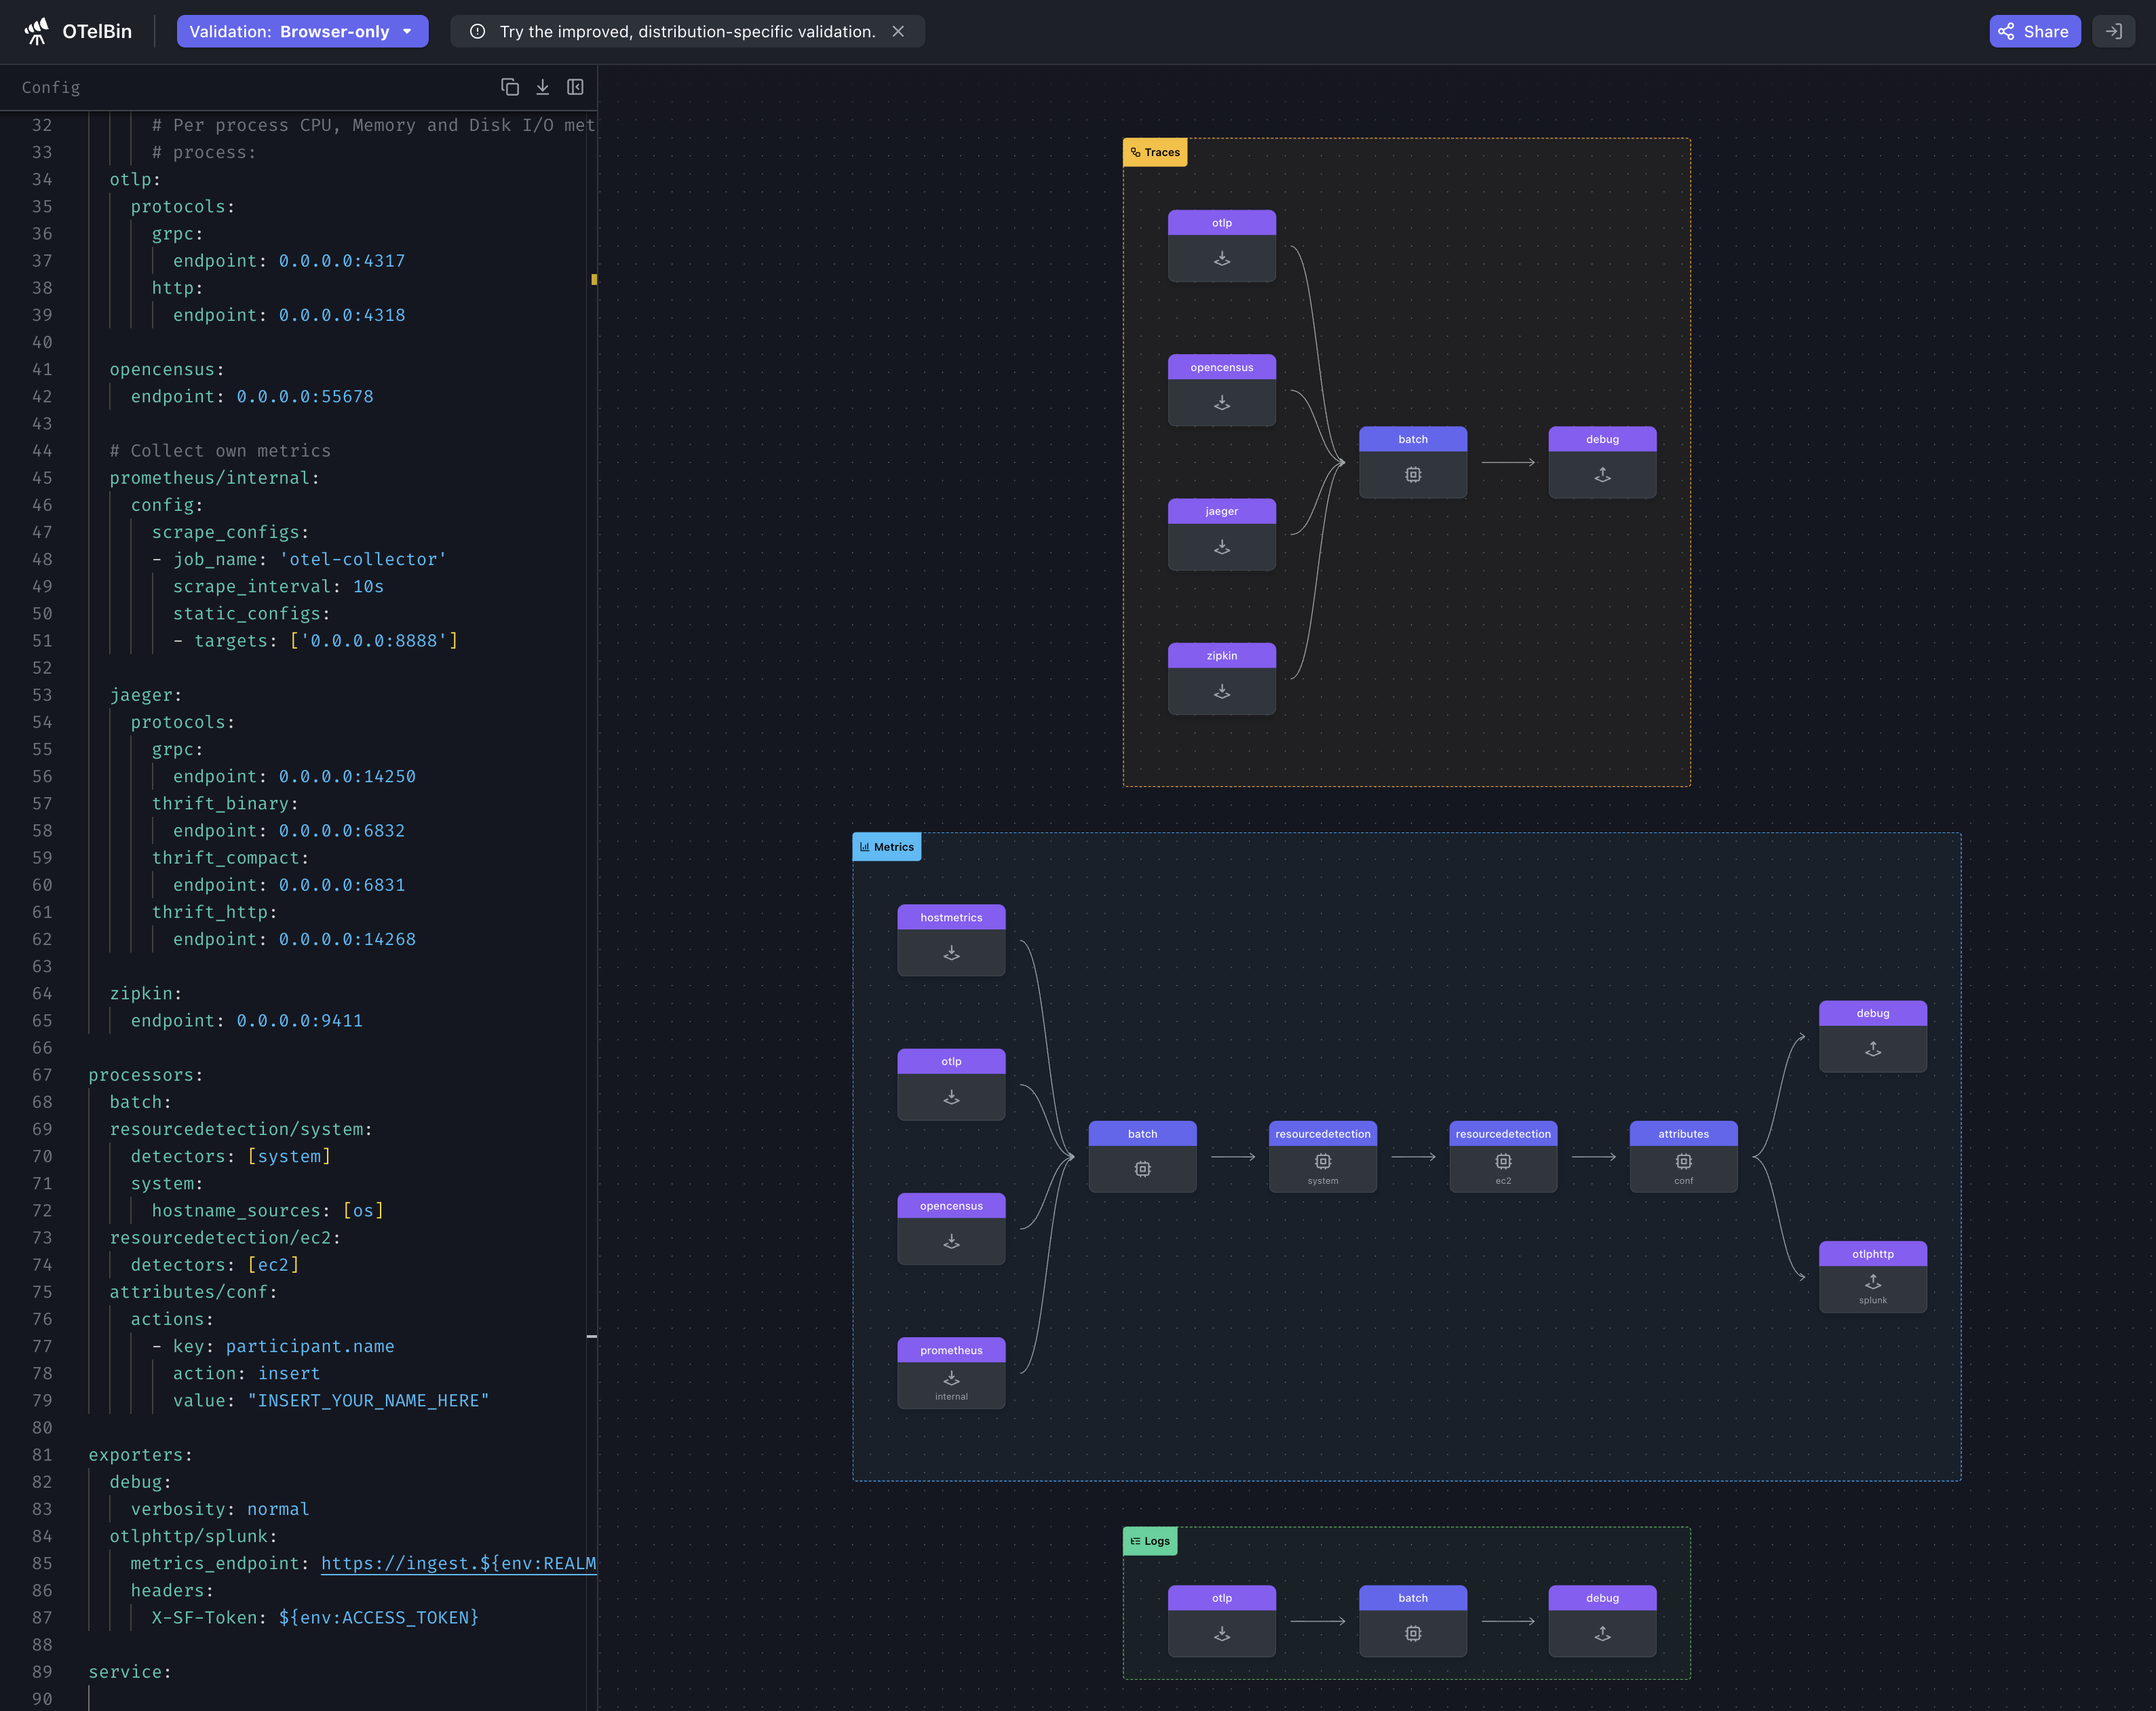
# To limit exposure to denial of service attacks, change the host in endpoints below from 0.0.0.0 to a specific network interface.# See https://github.com/open-telemetry/opentelemetry-collector/blob/main/docs/security-best-practices.md#safeguards-against-denial-of-service-attacksextensions:health_check:endpoint:0.0.0.0:13133pprof:endpoint:0.0.0.0:1777zpages:endpoint:0.0.0.0:55679receivers:hostmetrics:collection_interval:10sscrapers:# CPU utilization metricscpu:# Disk I/O metricsdisk:# File System utilization metricsfilesystem:# Memory utilization metricsmemory:# Network interface I/O metrics & TCP connection metricsnetwork:# CPU load metricsload:# Paging/Swap space utilization and I/O metricspaging:# Process count metricsprocesses:# Per process CPU, Memory and Disk I/O metrics. Disabled by default.# process:otlp:protocols:grpc:endpoint:0.0.0.0:4317http:endpoint:0.0.0.0:4318opencensus:endpoint:0.0.0.0:55678# Collect own metricsprometheus/internal:config:scrape_configs:- job_name:'otel-collector'scrape_interval:10sstatic_configs:- targets:['0.0.0.0:8888']jaeger:protocols:grpc:endpoint:0.0.0.0:14250thrift_binary:endpoint:0.0.0.0:6832thrift_compact:endpoint:0.0.0.0:6831thrift_http:endpoint:0.0.0.0:14268zipkin:endpoint:0.0.0.0:9411processors:batch:resourcedetection/system:detectors:[system]system:hostname_sources:[os]resourcedetection/ec2:detectors:[ec2]attributes/conf:actions:- key:participant.nameaction:insertvalue:"INSERT_YOUR_NAME_HERE"exporters:debug:verbosity:normalotlphttp/splunk:metrics_endpoint:https://ingest.${env:REALM}.signalfx.com/v2/datapoint/otlpheaders:X-SF-Token:${env:ACCESS_TOKEN}service:pipelines:traces:receivers:[otlp, opencensus, jaeger, zipkin]processors:[batch]exporters:[debug]metrics:receivers:[hostmetrics, otlp, opencensus, prometheus/internal]processors:[batch, resourcedetection/system, resourcedetection/ec2, attributes/conf]exporters:[debug, otlphttp/splunk]logs:receivers:[otlp]processors:[batch]exporters:[debug]extensions:[health_check, pprof, zpages]