OpenTelemetry Collector Service
OTLP HTTP Exporter
ワークショップの Exporters セクションで、メトリクスを Splunk Observability Cloud に送信するための otlphttp exporter を設定しました。ここで、metrics パイプラインでこれを有効にする必要があります。
metrics パイプラインの exporters セクションに otlphttp/splunk を含めるように更新します
service:

  pipelines:

    traces:
      receivers: [otlp, opencensus, jaeger, zipkin]
      processors: [batch]
      exporters: [debug]

    metrics:
      receivers: [hostmetrics, otlp, opencensus, prometheus/internal]
      processors: [batch, resourcedetection/system, resourcedetection/ec2, attributes/conf]
      exporters: [debug, otlphttp/splunk]
Ninja: Collector の内部を観察する
Collector は、実行中のコンポーネントからの追加シグナルを含む、自身の動作に関する内部シグナルをキャプチャします。 これは、データフローに関する判断を行うコンポーネントが、その情報をメトリクスまたはトレースとして公開する方法を必要とするためです。
なぜ Collector を監視するのか?
これは「監視者を誰が監視するのか?」という、鶏と卵のような問題ですが、この情報を公開できることは重要です。Collector の歴史において興味深い点は、Go メトリクス SDK が安定版と見なされる前から存在していたため、当面の間、Collector はこの機能を提供するために Prometheus エンドポイントを公開しているということです。
考慮事項
組織内で実行中の各 Collector の内部使用状況を監視すると、大量の新しい Metric Time Series (MTS) が発生する可能性があります。Splunk ディストリビューションでは、これらのメトリクスが厳選されており、予想される増加を予測するのに役立ちます。
Ninja Zone
Collector の内部オブザーバビリティを公開するために、いくつかの追加設定を調整できます
service:
  telemetry:
    logs:
      level: <info|warn|error>
      development: <true|false>
      encoding: <console|json>
      disable_caller: <true|false>
      disable_stacktrace: <true|false>
      output_paths: [<stdout|stderr>, paths...]
      error_output_paths: [<stdout|stderr>, paths...]
      initial_fields:
        key: value
    metrics:
      level: <none|basic|normal|detailed>
      # Address binds the promethues endpoint to scrape
address: <hostname:port>service:
telemetry:
logs:
level: info
encoding: json
disable_stacktrace: true
initial_fields:
instance.name: ${env:INSTANCE}
metrics:
address: localhost:8888参考資料
最終設定
Check-in最終設定を確認する
| |
ヒント
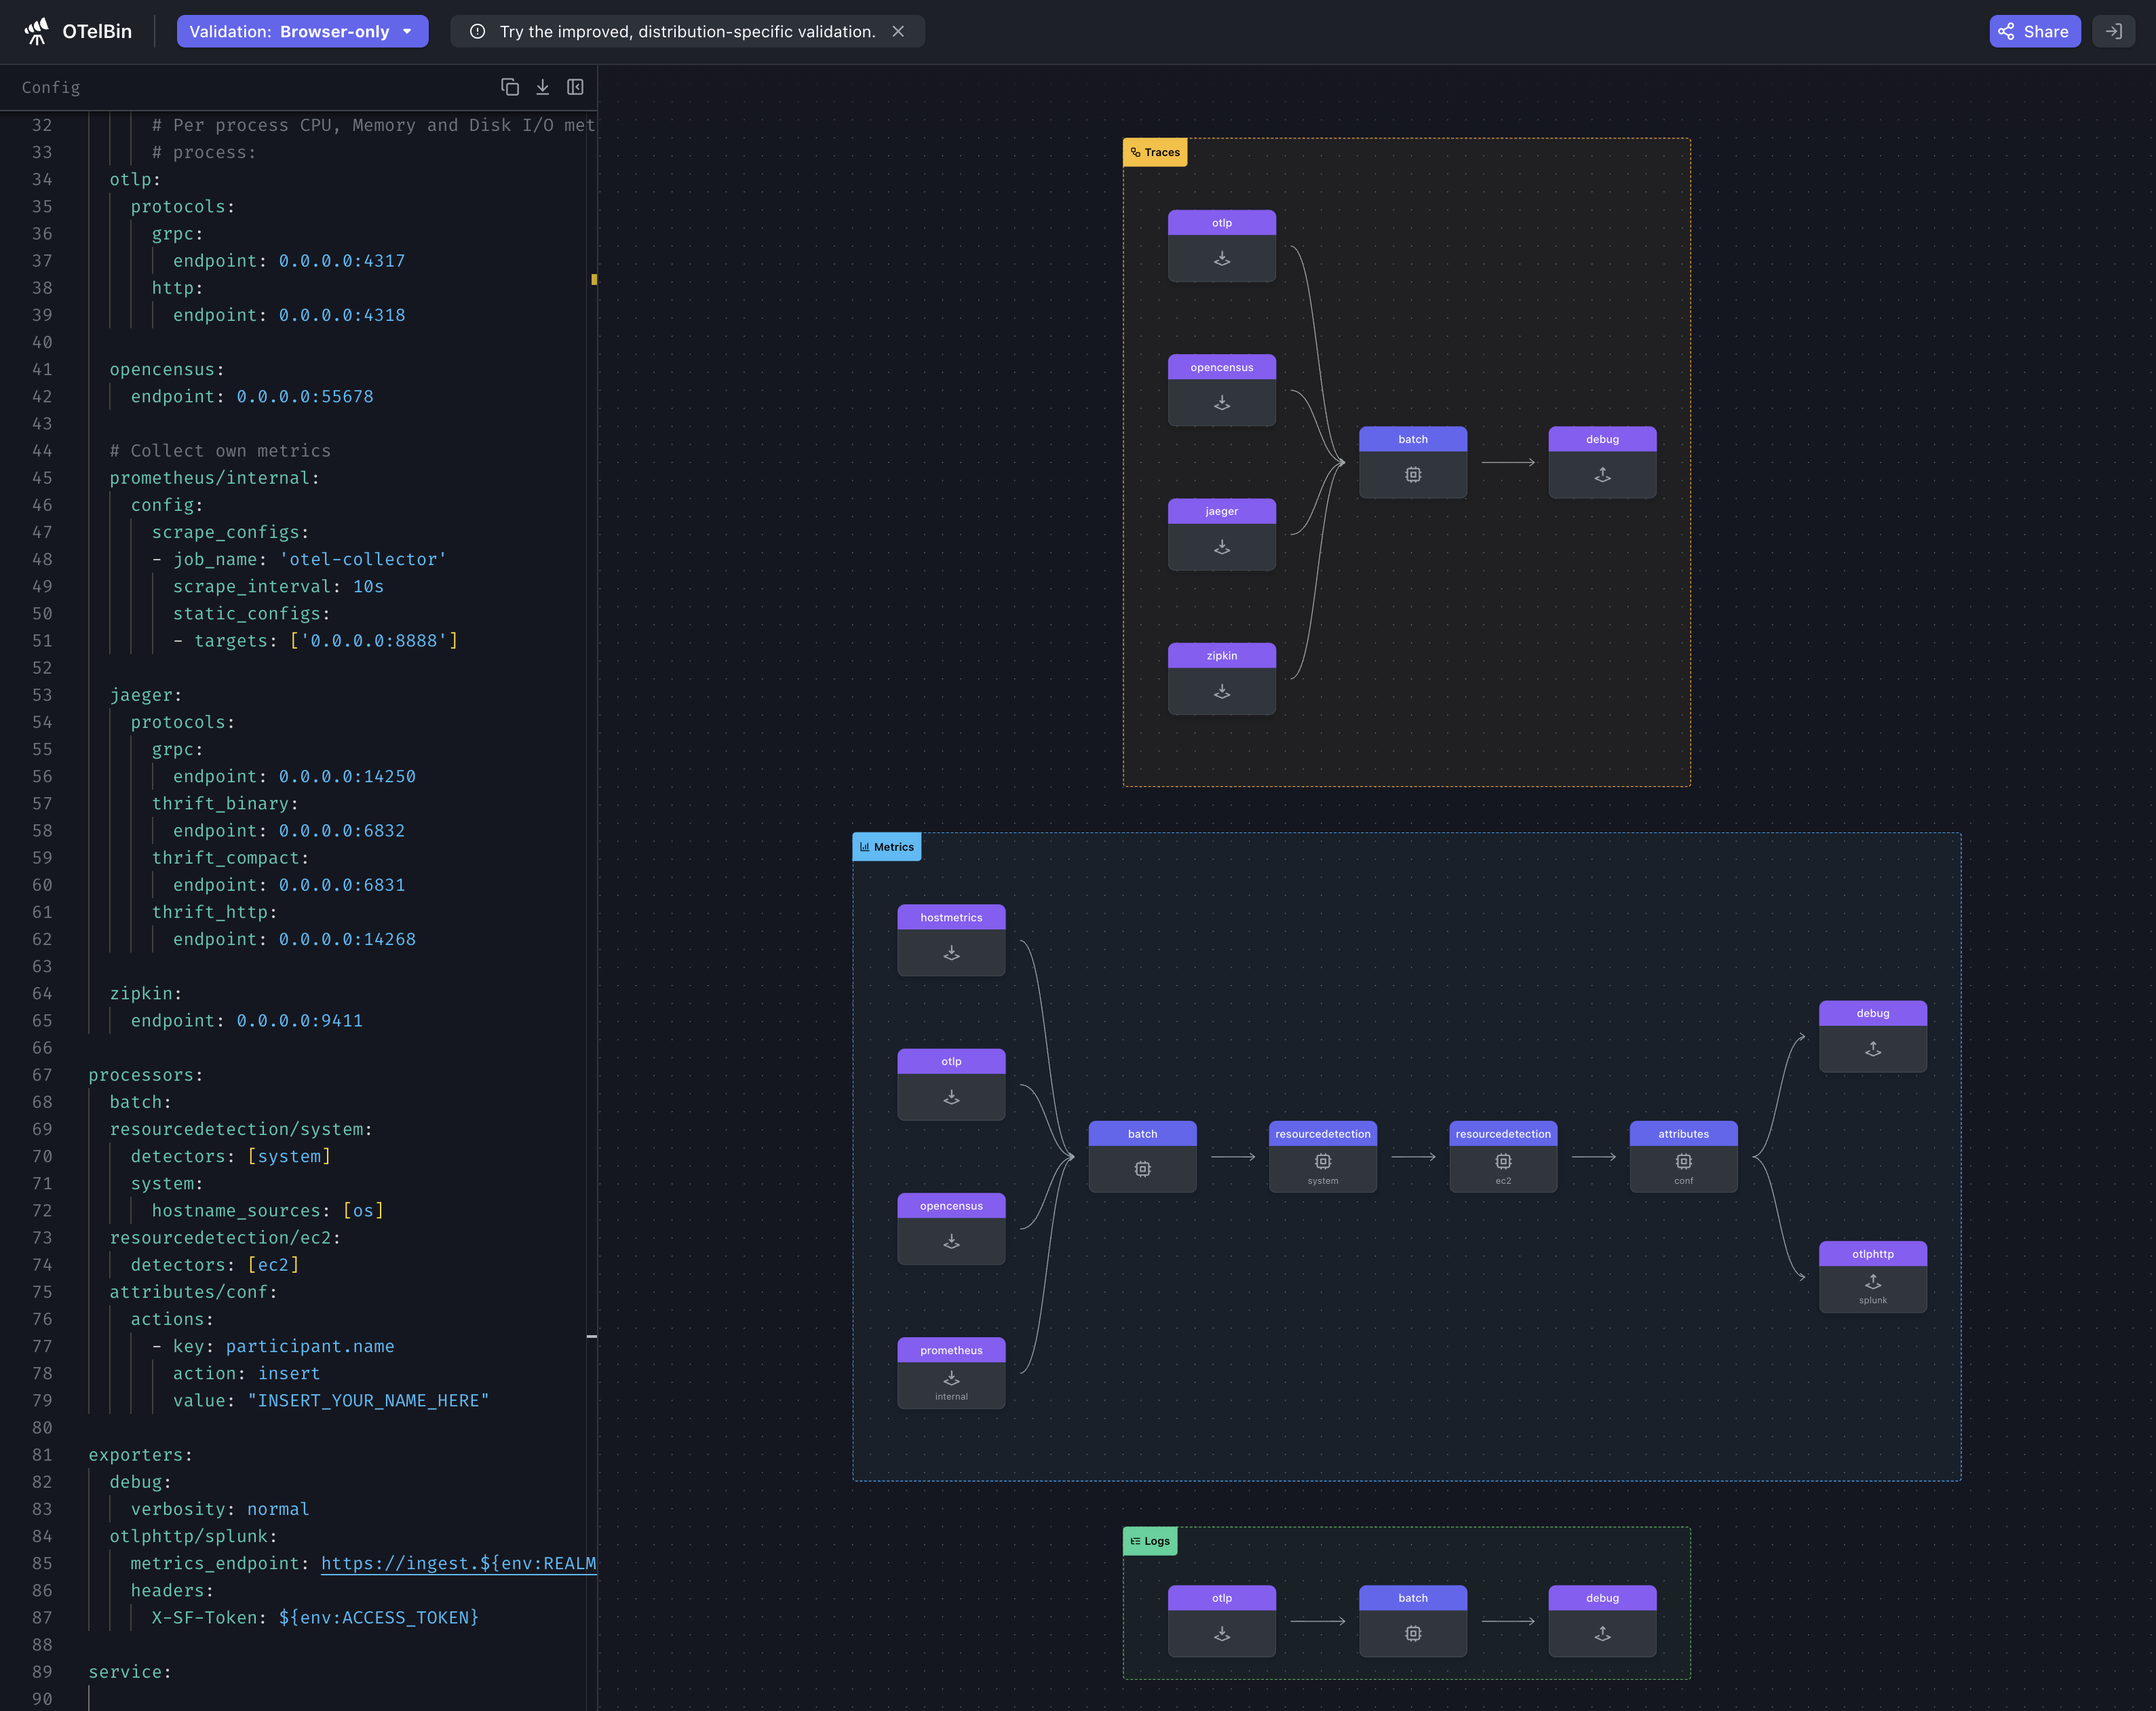
Collector を再起動する前に、設定ファイルを検証することをお勧めします。config.yaml ファイルの内容を otelbin.io に貼り付けることで検証できます。
ScreenshotOTelBin
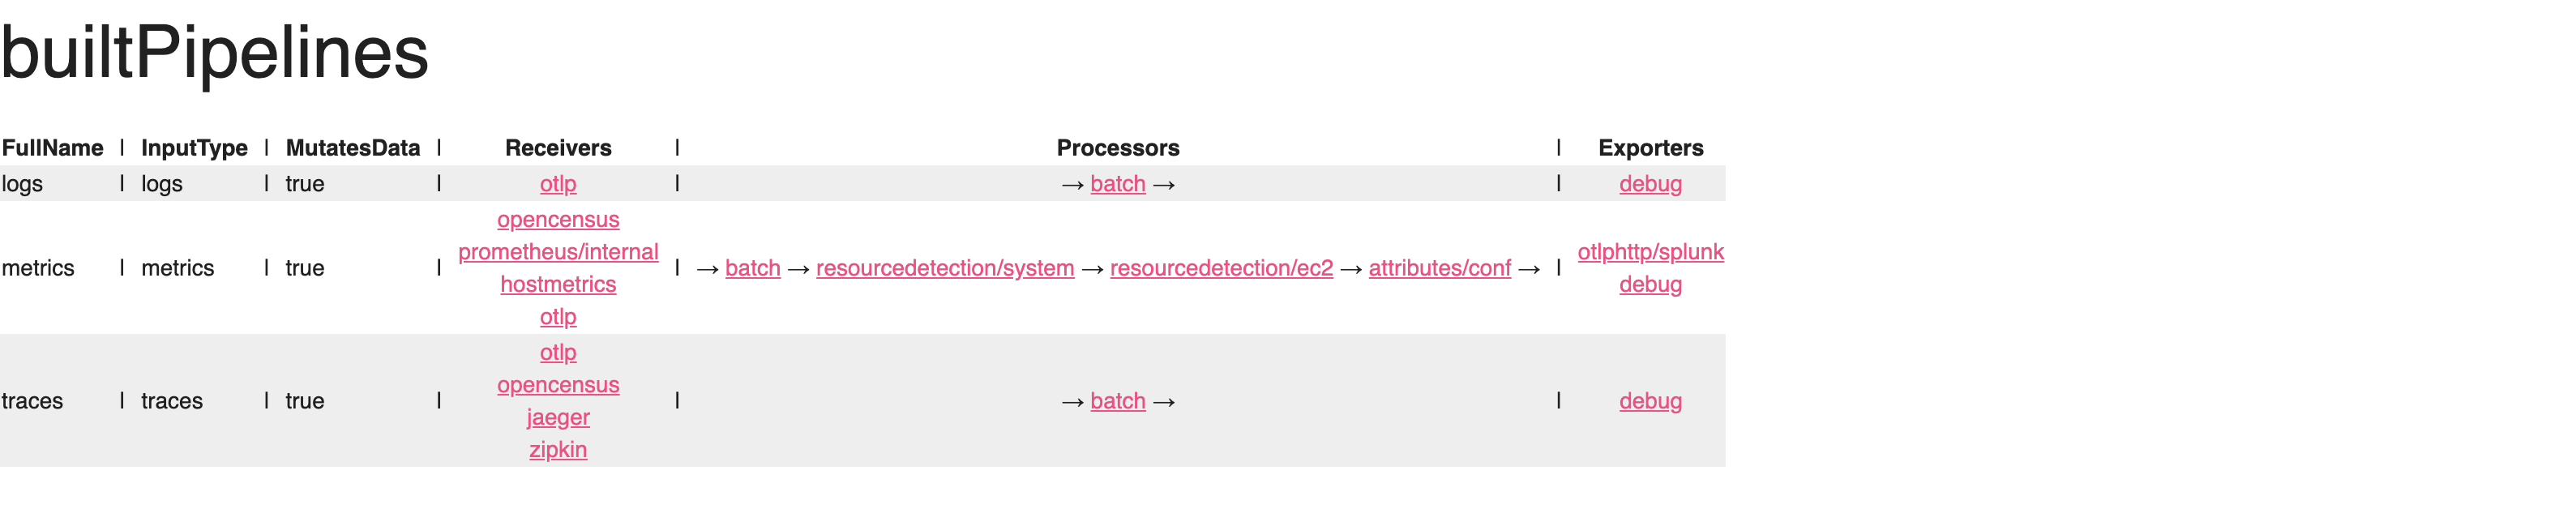
これで動作する設定ができたので、Collector を起動して zPages が何を報告しているか確認しましょう。
otelcol-contrib --config=file:/etc/otelcol-contrib/config.yamlブラウザで zPages を開きます:http://localhost:55679/debug/pipelinez(localhost を自分の環境に合わせて変更してください)。