Pet Clinic Java ワークショップ このワークショップでは、Splunk Observabilityプラットフォームの以下のコンポーネントを構成するための、基本的なステップを体験できます
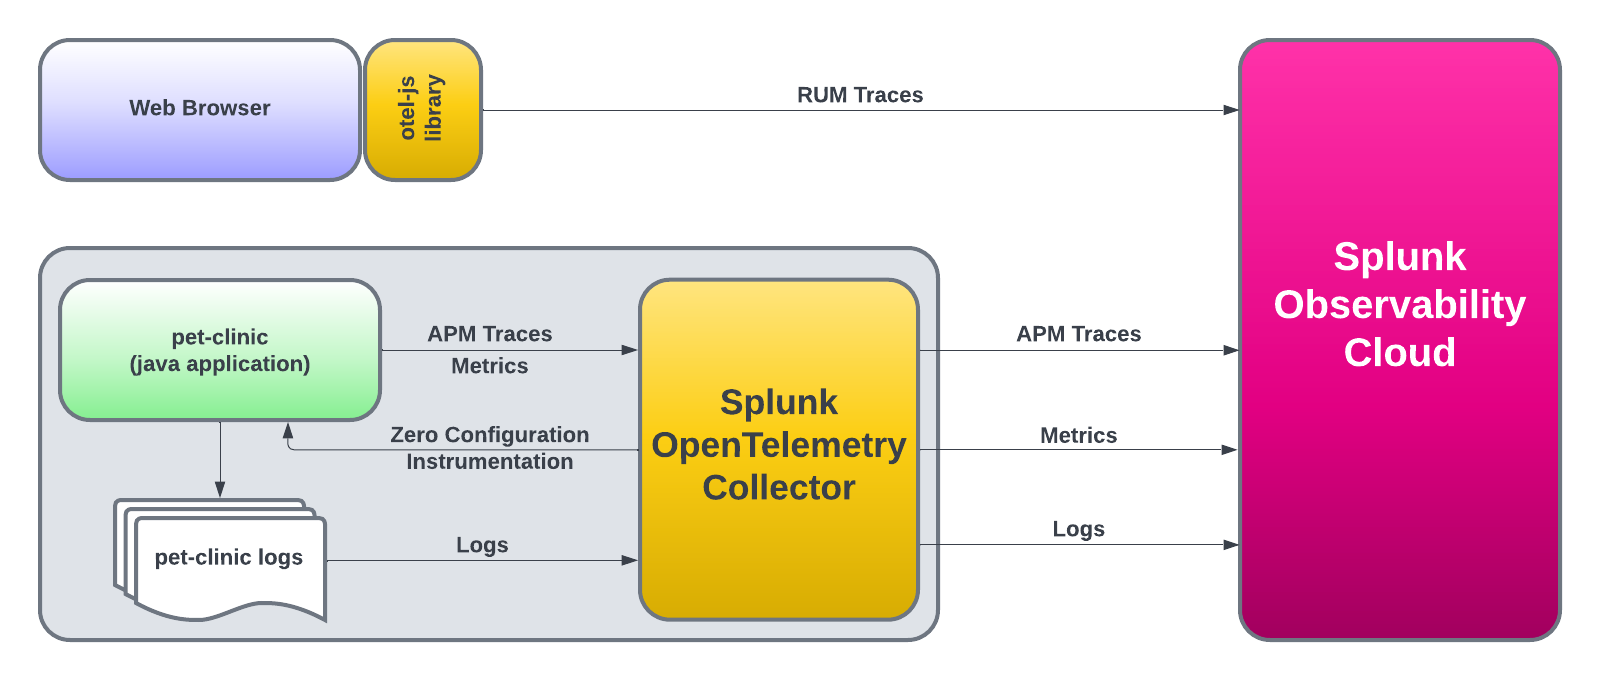
Splunk Infrastructure Monitoring (IM) Splunk APMEndpoint Performance Database Query Performance AlwaysOn Profiling Splunk Real User Monitoring (RUM) Splunk LogObserver ワークショップの中では、Javaのサンプルアプリケーション(Spring Pet Clinic)をクローン(ダウンロード)し、アプリケーションのコンパイル、パッケージ、実行していきます。
アプリケーションを起動すると、OpenTelemetry Javaエージェントを通じて、Splunk APMでメトリクスとトレースが即座に表示されるようになります。
その後、Splunk OpenTelemetry Javascript Libraries (RUM)を使用して、Pet Clinicのエンドユーザーインターフェース(アプリケーションによってレンダリングされるHTMLページ)を計装し、エンドユーザーが実行する個々のクリックとページロードのすべてについて、RUMトレースを生成していきます。
このワークショップは、ホスト/インスタンスが提供されるSplunk実行ワークショップ または 自前のホスト/Multipassインスタンス で行う、自己主導型のワークショップです。
ご自身のシステムには、以下のものがインストールされ、有効になっている必要があります
JDK 17 ポート 8083 が開いていること(インバウンド/アウトバウンド)
Pet Clinic Java ワークショップのサブセクション OpenTelemetry Collectorをインストールする 1. はじめに OpenTelemetry Collectorは、インフラストラクチャーとアプリケーションを計装するためのコアコンポーネントです。 その役割は収集と送信です
インフラストラクチャーのメトリクス(ディスク、CPU、メモリなど) Application Performance Monitoring(APM)のトレース情報 プロファイリングに関するデータ ホストおよびアプリケーションのログ Splunk Observability Cloudでは、インフラストラクチャーとアプリケーションの両方でCollectorのセットアップを案内するウィザードを提供しています。デフォルトでは、ウィザードはコレクターのインストールのみを行うコマンドのみを提供します。
2. 環境変数を設定する すでに Splunk IM ワークショップを終了している場合は、既存の環境変数を利用することができます。そうでない場合は、ACCESS_TOKEN と REALM の環境変数を設定して、OpenTelemetry Collectorのインストールコマンドを実行していきます。
例えば、Realmが us1 の場合、export REALM=us1 と入力し、eu0 の場合は export REALM=eu0 と入力します。
export ACCESS_TOKEN = "<replace_with_O11y-Workshop-ACCESS_TOKEN>" export REALM = "<replace_with_REALM>" 同じVMインスタンスにSplunk IMワークショップのセットアップをしている場合、Otel Collectorをインストールする前にKubernetesで実行中のCollectorを削除していることを確認してください。これは、以下のコマンドを実行することで行うことができます
helm delete splunk-otel-collector 3. OpenTelemetry Collector をインストールする 次に、Collectorをインストールします。インストールスクリプトに渡される追加のパラメータは --deployment-environment です。
curl -sSL https://dl.signalfx.com/splunk-otel-collector.sh > /tmp/splunk-otel-collector.sh && \
$( hostname) -petclinic --realm $REALM -- $ACCESS_TOKEN 。
AWS/EC2インスタンス上でこのワークショップを行う場合、インスタンスのホスト名を公開するためにコレクターにパッチを適用する必要があります
sudo sed -i 's/gcp, ecs, ec2, azure, system/system, gcp, ecs, ec2, azure/g' /etc/otel/collector/agent_config.yaml agent_config.yaml にパッチを適用したあと、Collectorを再起動してください
sudo systemctl restart splunk-otel-collector インストールが完了したら、Splunk Observabilityの Hosts with agent installed ダッシュボードに移動して、Dashboards → Hosts with agent installed からホストのデータを確認してみましょう。
ダッシュボードのフィルタを使用して host.name を選択し、仮想マシンのホスト名を入力または選択します。ホストのデータが表示されたら、APMコンポーネントを使用する準備が整いました。
OpenTelemetry Javaエージェントをインストールする 1. Spring PetClinic アプリケーションを動かす APMをセットアップするためにまず必要なのは…そう、アプリケーションです!この演習では、Spring PetClinicアプリケーションを使用します。これはSpringフレームワーク(Spring Boot)で作られた、非常に人気のあるサンプルJavaアプリケーションです。
まずはPetClinicリポジトリをクローンし、そして、アプリケーションをコンパイル、ビルド、パッケージ、テストしていきます。
git clone https://github.com/spring-projects/spring-petclinic spring-petclinic ディレクトリに移動します:
PetClinicが使用するMySQLデータベースを起動します:
docker run -d -e MYSQL_USER = petclinic -e MYSQL_PASSWORD = petclinic -e MYSQL_ROOT_PASSWORD = root -e MYSQL_DATABASE = petclinic -p 3306:3306 docker.io/biarms/mysql:5.7 そして、Splunk版のOpenTelemetry Java APMエージェントをダウンロードしておきましょう。
curl -L https://github.com/signalfx/splunk-otel-java/releases/latest/download/splunk-otel-javaagent.jar \
次に、mavenコマンドを実行してPetClinicをコンパイル/ビルド/パッケージ化します:
./mvnw package -Dmaven.test.skip= true 実際にアプリをコンパイルする前に、mavenが多くの依存ライブラリをダウンロードするため、初回実行時には数分かかるでしょう。2回目以降の実行はもっと短くなります。
そして、以下のコマンドでアプリケーションを実行することができます:
java -javaagent:./splunk-otel-javaagent.jar \
= 8083 \
= $( hostname) .service \
= deployment.environment= $( hostname) ,version= 0.314 \
= true \
= true \
= true \
= mysqlアプリケーションが動作しているかどうかは、http://<VM_IP_ADDRESS>:8083 にアクセスして確認することができます。
次に、トラフィックを生成し、クリックしまくり、エラーを生成し、ペットを追加するなどしてください。
-Dotel.service.name=$(hostname).service では、アプリケーションの名前を定義しています。サービスマップ上のアプリケーションの名前等に反映されます。-Dotel.resource.attributes=deployment.environment=$(hostname),version=0.314 では、Environmentと、versionを定義しています。deployment.environment=$(hostname) は、Splunk APM UIの上部「Environment」に反映されます。version=0.314 はここでは、アプリケーションのバージョンを示しています。トレースをドリルダウンしたり、サービスマップのBreakdownの機能で分析したり、Tag Spotlightを開くと version 毎のパフォーマンス分析が使えます。-Dsplunk.profiler.enabled=true および splunk.profiler.memory.enabled=true では、CPUとメモリのプロファイリングを有効にしています。Splunk APM UIから、AlwaysOn Profilingを開いてみてください。-Dsplunk.metrics.enabled=true では、メモリやスレッドなどJVMメトリクスの送信を有効にしています。Dashboardsから、APM java servicesを開いてみてください。その後、Splunk APM UIにアクセスして、それぞれのテレメトリーデータを確認してみましょう!
サービスマップやTab Spotlightで、 version などのカスタム属性で分析できるようにするためには、Troubleshooting MetricSetsの設定をあらかじめ追加する必要があります。
左メニューの Settings → APM MetricSets で、設定を管理することができます。 もしお使いのアカウントで分析できなければ、設定を追加してみましょう。
次のセクションではカスタム計装を追加して、OpenTelemetryでは何ができるのか、さらに見ていきます。
マニュアル計装 1. 依存ライブラリを追加する 前のセクション足したような、プロセス全体に渡る属性は便利なのですが、ときにはさらに、リクエストの内容に応じた状況を知りたくなるかもしれません。
心配ありません、OpenTelemetryのAPIを通じてそれらを計装し、データを送り、Splunk Observabilityで分析できるようになります。
最初に、JavaアプリケーションがOpenTelemetryのAPIを使えるように、ライブラリの依存を追加していきます。
もちろん、vimなどのお好みのエディタをお使い頂いても大丈夫です!
アプリケーションが起動中であれば、一旦停止しましょう。ターミナルで Ctrl-c
そして、<dependencies> セクションの中(33行目)に↓を追加してください。
ファイル修正後、 ctrl-OEnterctrl-X
    <dependency>
        <groupId>io.opentelemetry</groupId>
        <artifactId>opentelemetry-api</artifactId>
    </dependency>
念のため、コンパイルできるか確かめてみましょう:
./mvnw package -Dmaven.test.skip=truenanoはLinux環境でよく使われる、シンプルなエディタの一つです。
Alt-U で、アンドゥができます。Macの場合は Esc キーを押したあとに U を押してください!ctrl-_ のあとに数字を入力すると、指定した行数にジャンプします。ctrl-O のあとに Enter で、ファイルを保存します。ctrl-X で、nanoを終了します。もしファイルをどうしようもなく壊してしまって元に戻したい場合は、gitを使って次のようにするとよいでしょう。
これで、JavaのアプリケーションでOpenTelemetryのAPIが使う準備ができました。
2. Javaのコードにマニュアル計装を追加する では、アプリケーションコードをちょっと変更して、リクエストのコンテキストのデータをスパン属性に追加してみましょう。
ここではPet Clinicアプリケーションの中で Find Owners が使われたときに、どのような検索文字列が指定されたのかを調査できるようにしていきます。
検索条件によってパフォーマンスが劣化してしまうケース、よくありませんか?そんなときは OwnerController に計装を追加していきましょう!
nano src/main/java/org/springframework/samples/petclinic/owner/OwnerController.java このコードを 変更するのは2箇所 です。
まず、import jakarta.validation.Valid; の下、37行目付近に↓を足します:
import io.opentelemetry.api.trace.Span ; 次に、 // find owners by last name のコメントがある箇所(おそらく95行目付近にあります)の下に、次のコードを足していきましょう:
Span span = Span . current ();
span . setAttribute ( "lastName" , owner . getLastName ()); このコードで、Last Nameとして指定された検索条件が、スパン属性 lastName としてSplunk Observabilityに伝えるようになりました。
アプリケーションをコンパイルし直ししますが、Javaコードを多少汚してしまったかもしれません。 spring-javaformat:apply を指定しながらコンパイルしてみましょう。
./mvnw spring-javaformat:apply package -Dmaven.test.skip= true アプリケーションを起動します。せっかくなので、バージョンを一つあげて version=0.315 としましょう。
java -javaagent:./splunk-otel-javaagent.jar \
= 8083 \
= $( hostname) .service \
= deployment.environment= $( hostname) ,version= 0.315 \
= true \
= true \
= true \
= mysqlhttp://<VM_IP_ADDRESS>:8083 にアクセスして、オーナー検索をいくつか試してましょう。そしてSplunk APM UIからExploreを開き、アプリケーションのトレースを見ていきます。
マニュアル計装で何ができるか、他の言語でのやり方などは、OpenTelemetryの公式ウェブサイトにある Instrumentation ページをご覧ください。
検証が完了したら、ターミナルで Ctrl-c
次のセクションでは、RUMを使ってブラウザ上のパフォーマンスデータを収集してみましょう。
Real User Monitoring 1. RUMを有効にする Real User Monitoring (RUM)計装のために、Open Telemetry Javascript https://github.com/signalfx/splunk-otel-js-web スニペットをページ内に追加します。再度ウィザードを使用します Data Management → Add Integrationボタン → Monitor user experience(画面上部タブ) → Browser Instrumentation を開きます。
ドロップダウンから設定済みの RUM ACCESS TOKEN を選択し、Next をクリックします。以下の構文で App name とEnvironment を入力します
次に、ワークショップのRUMトークンを選択し、 App nameとEnvironmentを定義します。ウィザードでは、ページ上部の <head> セクションに配置する必要のあるHTMLコードの断片が表示されます。この例では、次のように記述していますが、ウィザードでは先程入力した値が反映されてるはずです。
Application Name: <hostname>-petclinic-service Environment: <hostname>-petclinic-env ウィザードで編集済みコードスニペットをコピーするか、以下のスニペットをコピーして適宜編集してください。ただし
[hostname]-petclinic-service - [hostname] をお使いのホスト名に書き換えてください[hostname]-petclinic-env - [hostname] をお使いのホスト名に書き換えてください < script src = "https://cdn.signalfx.com/o11y-gdi-rum/latest/splunk-otel-web.js" crossorigin = "anonymous" ></ script >
< script >
SplunkRum . init ({
beaconUrl : "https://rum-ingest.<REALM>.signalfx.com/v1/rum" ,
rumAuth : "<RUM_ACCESS_TOKEN>" ,
app : "<hostname>.service" ,
environment : "<hostname>"
});
</ script > Spring PetClinicアプリケーションでは、1つのHTMLページを「レイアウト」ページとして使用し、アプリケーションのすべてのページで再利用しています。これは、Splunk RUM計装ライブラリを挿入するのに最適な場所であり、すべてのページで自動的に読み込まれます。
では、レイアウトページを編集してみましょう
nano src/main/resources/templates/fragments/layout.html そして、上で生成したスニップをページの <head> セクションに挿入してみましょう。さて、アプリケーションを再構築して、再び実行する必要があります。
2. PetClinicを再ビルドする mavenコマンドを実行して、PetClinicをコンパイル/ビルド/パッケージ化します
./mvnw package -Dmaven.test.skip= true そして、アプリケーションを動かしてみましょう。バージョンを version=0.316 とするのをお忘れなく。
java -javaagent:./splunk-otel-javaagent.jar \
= 8083 \
= $( hostname) .service \
= deployment.environment= $( hostname) ,version= 0.316 \
= true \
= true \
= true \
= mysqlここまできて version を毎回変えるためにコマンドラインを修正するのは大変だと思うことでしょう。実際、修正が漏れた人もいるかもしれません。
本番環境では、環境変数でアプリケーションバージョンを与えたり、コンテナイメージの作成時にビルドIDを与えたりすることになるはずです。
次に、より多くのトラフィックを生成するために、アプリケーションに再度アクセスしてみましょう。 http://<VM_IP_ADDRESS>:8083 にアクセスすると、今度はRUMトレースが報告されるはずです。
RUMにアクセスして、トレースとメトリクスのいくつかを見てみましょう。左のメニューから RUM を選ぶと、Spring Pet Clinicでのユーザー(あなたです!)が体験したパフォーマンスが表示されます。
Log Observer このセクションでは、Spring PetClinicアプリケーションをファイルシステムのファイルにログを書き込むように設定し、
Splunk OpenTelemetry Collectorがそのログファイルを読み取り(tail)、Splunk Observability Platformに情報を報告するように設定していきます。
1. FluentDの設定 Splunk OpenTelemetry Collectorを、Spring PetClinicのログファイルをtailし
Splunk Observability Cloudエンドポイントにデータを報告するように設定する必要があります。
Splunk OpenTelemetry Collectorは、FluentDを使用してログの取得/報告を行い、
Spring PetClinicのログを報告するための適切な設定を行うには、
デフォルトディレクトリ(/etc/otel/collector/fluentd/conf.d/)にFluentDの設定ファイルを追加するだけです。
以下は、サンプルのFluentD設定ファイル petclinic.conf を新たに作成し、
sudo nano /etc/otel/collector/fluentd/conf.d/petclinic.conf ファイル /tmp/spring-petclinic.log を読み取るよう設定を記述します。
<source>
  @type tail
  @label @SPLUNK
  tag petclinic.app
  path /tmp/spring-petclinic.log
  pos_file /tmp/spring-petclinic.pos_file
  read_from_head false
  <parse>
    @type none
  </parse>
</source>
このとき、ファイル petclinic.conf のアクセス権と所有権を変更する必要があります。
sudo chown td-agent:td-agent /etc/otel/collector/fluentd/conf.d/petclinic.conf
sudo chmod 755 /etc/otel/collector/fluentd/conf.d/petclinic.conf
ファイルが作成されたら、FluentDプロセスを再起動しましょう。
sudo systemctl restart td-agent 3. Logbackの設定 Spring Pet Clinicアプリケーションは、いくつかのJavaログライブラリを使用することができます。
このシナリオでは、logbackを使ってみましょう。
リソースフォルダに logback.xml という名前のファイルを作成して…
nano src/main/resources/logback.xml 以下の設定を保存しましょう:
<?xml version="1.0" encoding="UTF-8"?>
<!DOCTYPE xml>
<configuration scan= "true" scanPeriod= "30 seconds" >
<contextListener class= "ch.qos.logback.classic.jul.LevelChangePropagator" >
<resetJUL> true</resetJUL>
</contextListener>
<logger name= "org.springframework.samples.petclinic" level= "debug" />
<appender name= "file" class= "ch.qos.logback.core.rolling.RollingFileAppender" >
<file> /tmp/spring-petclinic.log</file>
<rollingPolicy class= "ch.qos.logback.core.rolling.TimeBasedRollingPolicy" >
<fileNamePattern> springLogFile.%d{yyyy-MM-dd}.log</fileNamePattern>
<maxHistory> 5</maxHistory>
<totalSizeCap> 1GB</totalSizeCap>
</rollingPolicy>
<encoder>
<pattern>
%d{yyyy-MM-dd HH:mm:ss} - %logger{36} - %msg trace_id=%X{trace_id} span_id=%X{span_id} trace_flags=%X{trace_flags} service.name=%property{otel.resource.service.name}, deployment.environment=%property{otel.resource.deployment.environment} %n
</pattern>
</encoder>
</appender>
<root level= "debug" >
<appender-ref ref= "file" />
</root>
</configuration> その後、アプリケーションを再構築して再度実行していきます。
./mvnw package -Dmaven.test.skip= true java -javaagent:./splunk-otel-javaagent.jar \
= 8083 \
= $( hostname) .service \
= deployment.environment= $( hostname) ,version= 0.317 \
= true \
= true \
= true \
= mysqlこれまで通り、アプリケーション http://<VM_IP_ADDRESS>:8083 にアクセスしてトラフィックを生成すると、ログメッセージが報告されるようになります。
左側のLog Observerアイコンをクリックして、ホストとSpring PetClinicアプリケーションからのログメッセージのみを選択するためのフィルタを追加できます。
Add Filter → Field → host.name → <あなたのホスト名> Add Filter → Field → service.name → <あなたのホスト名>.service 4. まとめ これでワークショップは終了です。
これまでに、Splunk Observability Cloudにメトリクス、トレース、ログ、データベースクエリのパフォーマンス、コードプロファイリングが報告されるようになりました。
おめでとうございます!
OpenTelemetryでクラウドネイティブ環境のオブザーバビリティを実現する 概要 OpenTelemetryを使い始める場合は、バックエンドに直接データを送ることから始めるかもしれません。最初のステップとしてはよいですが、OpenTelemetry Collectorをオブザーバビリティのアーキテクチャとして使用するのは多くの利点があり、本番環境ではCollectorを使ったデプロイを推奨しています。
このワークショップでは、OpenTelemetry Collectorを使用することに焦点を当て、Splunk Observability Cloudで使用するためのレシーバー、プロセッサー、エクスポーターを定義し、実際にテレメトリデータを送信するためのパイプラインを設定することで、環境に合わせてCollectorを活用を学びます。また、分散プラットフォームのビジネスニーズに対応するための、カスタムコンポーネントを追加できるようになるまでの道のりを進むことになります。
Ninja セクション ワークショップの途中には、展開できる Ninjaセクション
OpenTelemetryプロジェクトは頻繁に開発されているため、Ninjaセクションの内容が古くなる可能性があることに注意してください。コンテンツが古い場合には更新のリクエストを出すこともできますので、必要なものを見つけた場合はお知らせください。
Ninja: をテストして!このワークショップを完了すると、正式に OpenTelemetry Collector ニンジャになります!
対象者 このワークショップは、OpenTelemetry Collectorのアーキテクチャとデプロイメントについてさらに学びたいと考えている開発者やシステム管理者を対象としています。
前提条件 データ収集に関する基本的な理解 コマンドラインとvim/viの経験 Ubuntu 20.04 LTSまたは22.04 LTSが稼働するインスタンス/ホスト/VM最小要件はAWS/EC2 t2.micro(1 CPU、1GB RAM、8GBストレージ) 学習目標 このセッションの終わりまでに、参加者は以下を行うことができるようになります
OpenTelemetryのコンポーネントを理解する レシーバー、プロセッサー、エクスポーターを使用してデータを収集・分析する OpenTelemetryを使用する利点を特定する 自分たちのビジネスニーズに対応するカスタムコンポーネントを構築する OpenTelemetry のアーキテクチャー
%%{
  init:{
    "theme":"base",
    "themeVariables": {
      "primaryColor": "#ffffff",
      "clusterBkg": "#eff2fb",
      "defaultLinkColor": "#333333"
    }
  }
}%%

flowchart LR;
    subgraph Receivers
    A[OTLP]--> M(Receivers)
    B[JAEGER]--> M(Receivers)
    C[Prometheus]--> M(Receivers)
    end
    subgraph Processors
    M(Receivers) --> H(Filters, Attributes, etc)
    E(Extensions)
    end
    subgraph Exporters
    H(Filters, Attributes, etc) --> S(OTLP)
    H(Filters, Attributes, etc) --> T(JAEGER)
    H(Filters, Attributes, etc) --> U(Prometheus)
    end
OpenTelemetry Collectorのサブセクション OpenTelemetry Collector Contrib をインストールする OpenTelemetry Collector の Contrib ディストリビューションをダウンロードする OpenTelemetry Collectorのインストールのために、まずはダウンロードするのが最初のステップです。このラボでは、 wget コマンドを使ってOpenTelemetryのGitHubリポジトリから .deb パッケージをダウンロードしていきます。
OpenTelemetry Collector Contrib releases page
から、ご利用のプラットフォーム用の .deb パッケージを入手してください。
wget https://github.com/open-telemetry/opentelemetry-collector-releases/releases/download/v0.80.0/otelcol-contrib_0.80.0_linux_amd64.deb OpenTelemetry Collector の Contrib ディストリビューションをインストールする dpkg を使って、 .deb パッケージをインストールします。下記の dpkg Output のようになれば、インストールは成功です!
sudo dpkg -i otelcol-contrib_0.80.0_linux_amd64.deb Selecting previously unselected package otelcol-contrib.
(Reading database ... 64218 files and directories currently installed.)
Preparing to unpack otelcol-contrib_0.75.0_linux_amd64.deb ...
Unpacking otelcol-contrib (0.75.0) ...
Setting up otelcol-contrib (0.75.0) ...
Created symlink /etc/systemd/system/multi-user.target.wants/otelcol-contrib.service → /lib/systemd/system/otelcol-contrib.service. 1. インストールのサブセクション OpenTelemetry Collector Contribをインストールする Collector が動作していることを確認する これで、Collectorが動いているはずです。root権限で systemctl コマンドを使って、それを確かめてみましょう。
sudo systemctl status otelcol-contrib ● otelcol-contrib.service - OpenTelemetry Collector Contrib
Loaded: loaded (/lib/systemd/system/otelcol-contrib.service; enabled; vendor preset: enabled)
Active: active (running) since Tue 2023-05-16 08:23:23 UTC; 25s ago
Main PID: 1415 (otelcol-contrib)
Tasks: 5 (limit: 1141)
Memory: 22.2M
CPU: 125ms
CGroup: /system.slice/otelcol-contrib.service
└─1415 /usr/bin/otelcol-contrib --config=/etc/otelcol-contrib/config.yaml
May 16 08:23:39 ip-10-0-9-125 otelcol-contrib[1415]: NumberDataPoints #0
May 16 08:23:39 ip-10-0-9-125 otelcol-contrib[1415]: Data point attributes:
May 16 08:23:39 ip-10-0-9-125 otelcol-contrib[1415]: -> exporter: Str(logging)
May 16 08:23:39 ip-10-0-9-125 otelcol-contrib[1415]: -> service_instance_id: Str(df8a57f4-abdc-46b9-a847-acd62db1001f)
May 16 08:23:39 ip-10-0-9-125 otelcol-contrib[1415]: -> service_name: Str(otelcol-contrib)
May 16 08:23:39 ip-10-0-9-125 otelcol-contrib[1415]: -> service_version: Str(0.75.0)
May 16 08:23:39 ip-10-0-9-125 otelcol-contrib[1415]: StartTimestamp: 2023-05-16 08:23:39.006 +0000 UTC
May 16 08:23:39 ip-10-0-9-125 otelcol-contrib[1415]: Timestamp: 2023-05-16 08:23:39.006 +0000 UTC
May 16 08:23:39 ip-10-0-9-125 otelcol-contrib[1415]: Value: 0.000000
May 16 08:23:39 ip-10-0-9-125 otelcol-contrib[1415]: {"kind": "exporter", "data_type": "metrics", "name": "logging"} systemctl status コマンドの表示を中止するときは q キーを押してください。
サービスを停止するときは、 stop コマンドを使います。
sudo systemctl stop otelcol-contrib 更新した設定ファイルを読み込ませるときは、 restart コマンドでサービスの再起動をしましょう。
sudo systemctl restart otelcol-contrib Ninja: Open Telemetry Collector Builder (ocb) を使って、独自のコレクターを作るこのパートでは、お使いのシステムに以下のものがインストールされている必要があります
なぜ独自のコレクターをビルドするの? コレクターのデフォルトのディストリビューション(coreおよびcontrib)は、含まれれるコンポーネントが少なすぎたり、もしくは多すぎたりします。
本番環境でcontribコレクターを実行することはできますが、インストールされているコンポーネントの量が多く、デプロイに必要ではないものも含まれるため、一般的には推奨されません。
独自のコレクターをビルドする利点は? 独自のコレクターバイナリー(通常は「ディストリビューション」と呼ばれる)を作成することで、必要なものだけをビルドすることができます。
メリットは次のとおりです:
バイナリーのサイズが小さい 一般的なGoの脆弱性スキャナーを利用できる 組織独自のコンポーネントを組み込むことができる カスタムコレクターをビルドするときの注意事項は? さて、これはNinjaゾーンの人たちにあえて言うことではないかもしれませんが:
Goの開発経験を、必須ではないが、推奨される Splunkの サポートがない ディストリビューションのライフサイクルを管理しなければならない プロジェクトは安定性に向けて進んでいますが、行われた変更がワークフローを壊す可能性があることに注意してください。Splunkチームは、より高い安定性とサポートを提供し、デプロイメントニーズに対応するためのキュレーションされた経験を提供しています。
Ninja ゾーン 必要なツールをすべてインストールしたら、以下のディレクトリ構造に従い、 otelcol-builder.yaml という新しいファイルを作成します:
.
└── otelcol-builder.yaml
ファイルを作成したら、インストールするコンポーネントのリストと追加のメタデータを追加する必要があります。
この例では、導入設定に必要なコンポーネントのみをインストールするためのビルダーマニフェストを作成します:
dist :
name : otelcol-ninja
description : A custom build of the Open Telemetry Collector
output_path : ./dist
extensions :
gomod : go.opentelemetry.io/collector/extension/ballastextension v0.80.0
gomod : go.opentelemetry.io/collector/extension/zpagesextension v0.80.0
gomod : github.com/open-telemetry/opentelemetry-collector-contrib/extension/httpforwarder v0.80.0
gomod : github.com/open-telemetry/opentelemetry-collector-contrib/extension/healthcheckextension v0.80.0
exporters :
gomod : go.opentelemetry.io/collector/exporter/loggingexporter v0.80.0
gomod : go.opentelemetry.io/collector/exporter/otlpexporter v0.80.0
gomod : github.com/open-telemetry/opentelemetry-collector-contrib/exporter/splunkhecexporter v0.80.0
gomod : github.com/open-telemetry/opentelemetry-collector-contrib/exporter/signalfxexporter v0.80.0
processors :
gomod : go.opentelemetry.io/collector/processor/batchprocessor v0.80.0
gomod : go.opentelemetry.io/collector/processor/memorylimiterprocessor v0.80.0
receivers :
gomod : go.opentelemetry.io/collector/receiver/otlpreceiver v0.80.0
gomod : github.com/open-telemetry/opentelemetry-collector-contrib/receiver/hostmetricsreceiver v0.80.0
gomod : github.com/open-telemetry/opentelemetry-collector-contrib/receiver/jaegerreceiver v0.80.0
gomod : github.com/open-telemetry/opentelemetry-collector-contrib/receiver/prometheusreceiver v0.80.0
gomod : github.com/open-telemetry/opentelemetry-collector-contrib/receiver/zipkinreceiver v0.80.0 ocb のためのyamlファイルを作成して更新したら、 次のコマンドを実行します:
ocb --config= otelcol-builder.yaml すると、次のようなディレクトリ構造が作成されます:
├── dist
│   ├── components.go
│   ├── components_test.go
│   ├── go.mod
│   ├── go.sum
│   ├── main.go
│   ├── main_others.go
│   ├── main_windows.go
│   └── otelcol-ninja
└── otelcol-builder.yaml
最後に、 ./dist/otelcol-ninja を実行すれば、独自ビルドのCollectorが動作することがわかります。このコマンドを実行する前に、 otelcol-contrib サービスが停止していることを確認してください。
./dist/otelcol-ninja --config= file:/etc/otelcol-contrib/config.yaml この設定ファイルで記述されているコンポーネントは、ビルドに含まれていないかもしれません。エラーの内容を含めて、何が起こるかを見てみましょう 。
リファレンス https://opentelemetry.io/docs/collector/custom-collector/ デフォルト設定 OpenTelemetry CollectorはYAMLファイルを使って設定をしていきます。これらのファイルには、必要に応じて変更できるデフォルト設定が含まれています。提供されているデフォルト設定を見てみましょう:
cat /etc/otelcol-contrib/config.yaml 1
2
3
4
5
6
7
8
9
10
11
12
13
14
15
16
17
18
19
20
21
22
23
24
25
26
27
28
29
30
31
32
33
34
35
36
37
38
39
40
41
42
43
44
45
46
47
48
49
50
51
52
53
54
55
extensions :
health_check :
pprof :
endpoint : 0.0.0.0 : 1777
zpages :
endpoint : 0.0.0.0 : 55679
receivers :
otlp :
protocols :
grpc :
http :
opencensus :
# Collect own metrics
prometheus :
config :
scrape_configs :
- job_name : 'otel-collector'
scrape_interval : 10s
static_configs :
- targets : [ '0.0.0.0:8888' ]
jaeger :
protocols :
grpc :
thrift_binary :
thrift_compact :
thrift_http :
zipkin :
processors :
batch :
exporters :
logging :
verbosity : detailed
service :
pipelines :
traces :
receivers : [ otlp, opencensus, jaeger, zipkin]
processors : [ batch]
exporters : [ logging]
metrics :
receivers : [ otlp, opencensus, prometheus]
processors : [ batch]
exporters : [ logging]
extensions : [ health_check, pprof, zpages]
おめでとうございます!OpenTelemetry Collectorのダウンロードとインストールに成功しました。あなたはOTel Ninjaになる準備ができました。しかしまずは、設定ファイルとOpenTelemetry Collectorの異なるディストリビューションについて見ていきましょう。
Splunkは、自社で完全にサポートされたOpenTelemetry Collectorのディストリビューションを提供しています。このディストリビューションは、Splunk GitHub Repository からインストールするか、Splunk Observability Cloudのウィザードを使用して、簡単なインストールスクリプトを作成し、コピー&ペーストすることで利用できます。このディストリビューションには、OpenTelemetry Collector Contribディストリビューションにはない追加機能や強化が含まれています。
SplunkのOpenTelemetry Collectorディストリビューションは本番環境でテスト済みであり、多くの顧客が本番環境で使用しています。 このディストリビューションを使用する顧客は、公式のSplunkサポートから、SLAの範囲内で直接支援を受けることができます。 メトリクスとトレース収集のコア構成体験に将来的な破壊的変更がないことを心配せずに、SplunkのOpenTelemetry Collectorディストリビューションを使用または移行することができます(OpenTelemetryログ収集の設定はベータ版です)。Collector自身のメトリクスに破壊的変更がある可能性はあります。 このセクションでは、ホストメトリクスをSplunk Observability Cloudに送信するために、設定ファイルの各セクションを詳しく見ていき、変更する方法について説明します。
OpenTelemetry Collector エクステンション さて、OpenTelemetry Collectorはインストールできました。次はOpenTelemetry Collectorのエクステンション(拡張機能)を見てみましょう。エクステンションはオプションで、主にテレメトリーデータの処理を伴わないタスクで使用できます。例としては、ヘルスモニタリング、サービスディスカバリ、データ転送などがあります。
%%{
  init:{
    "theme": "base",
    "themeVariables": {
      "primaryColor": "#ffffff",
      "clusterBkg": "#eff2fb",
      "defaultLinkColor": "#333333"
    }
  }
}%%

flowchart LR;
    style E fill:#e20082,stroke:#333,stroke-width:4px,color:#fff
    subgraph Receivers
    A[OTLP]--> M(Receivers)
    B[JAEGER]--> M(Receivers)
    C[Prometheus]--> M(Receivers)
    end
    subgraph Processors
    M(Receivers) --> H(Filters, Attributes, etc)
    E(Extensions)
    end
    subgraph Exporters
    H(Filters, Attributes, etc) --> S(OTLP)
    H(Filters, Attributes, etc) --> T(JAEGER)
    H(Filters, Attributes, etc) --> U(Prometheus)
    end
2. エクステンションのサブセクション OpenTelemetry Collector エクステンション Health Check エクステンション 他のコンポーネントと同様に、エクステンションは config.yaml ファイルで設定できます。ここでは実際に config.yaml ファイルを編集して、エクステンションを設定していきましょう。デフォルトの config.yaml では、すでに pprof エクステンションと zpages エクステンションが設定されていることを確認してみてください。このワークショップでは、設定ファイルをアップデートして health_check エクステンションを追加し、ポートを解放し、外部ネットワークからコレクターのヘルスチェックにアクセスできるようにしていきます。
sudo vi /etc/otelcol-contrib/config.yaml
Extensions Configuration extensions :
health_check :
endpoint : 0.0.0.0 : 13133 コレクターを起動します:
sudo systemctl restart otelcol-contrib このエクステンションはHTTPのURLを公開し、OpenTelemetry Collectorの稼働状況をチェックするプローブを提供します。このエクステンションはKubernetes環境でのLiveness/Readinessプローブとしても使われています。 curl コマンドの使い方は、curl man page を参照してください。
次のコマンドを実行します:
curl Command
curl Output curl http://localhost:13133 {"status":"Server available","upSince":"2023-04-27T10:11:22.153295874+01:00","uptime":"16m24.684476004s"} OpenTelemetry Collector エクステンション Performance Profiler このワークショップでは詳しく紹介はしません 。
OpenTelemetry Collector エクステンション zPages エクステンション zPages
Ninja: storageエクステンションでデータの耐久性を向上させるこれをこなうには、ディストリビューションに file_storage エクステンションモジュールがインストールされていることを確認する必要があります。確認するには、otelcol-contrib components コマンドを実行します:
Command
Truncated Output
Full Output otelcol-contrib components # ... truncated for clarity
extensions :
- file_storage buildinfo :
command : otelcol-contrib
description : OpenTelemetry Collector Contrib
version : 0.80.0
receivers :
- prometheus_simple
- apache
- influxdb
- purefa
- purefb
- receiver_creator
- mongodbatlas
- vcenter
- snmp
- expvar
- jmx
- kafka
- skywalking
- udplog
- carbon
- kafkametrics
- memcached
- prometheus
- windowseventlog
- zookeeper
- otlp
- awsecscontainermetrics
- iis
- mysql
- nsxt
- aerospike
- elasticsearch
- httpcheck
- k8sobjects
- mongodb
- hostmetrics
- signalfx
- statsd
- awsxray
- cloudfoundry
- collectd
- couchdb
- kubeletstats
- jaeger
- journald
- riak
- splunk_hec
- active_directory_ds
- awscloudwatch
- sqlquery
- windowsperfcounters
- flinkmetrics
- googlecloudpubsub
- podman_stats
- wavefront
- k8s_events
- postgresql
- rabbitmq
- sapm
- sqlserver
- redis
- solace
- tcplog
- awscontainerinsightreceiver
- awsfirehose
- bigip
- filelog
- googlecloudspanner
- cloudflare
- docker_stats
- k8s_cluster
- pulsar
- zipkin
- nginx
- opencensus
- azureeventhub
- datadog
- fluentforward
- otlpjsonfile
- syslog
processors :
- resource
- batch
- cumulativetodelta
- groupbyattrs
- groupbytrace
- k8sattributes
- experimental_metricsgeneration
- metricstransform
- routing
- attributes
- datadog
- deltatorate
- spanmetrics
- span
- memory_limiter
- redaction
- resourcedetection
- servicegraph
- transform
- filter
- probabilistic_sampler
- tail_sampling
exporters :
- otlp
- carbon
- datadog
- f5cloud
- kafka
- mezmo
- skywalking
- awsxray
- dynatrace
- loki
- prometheus
- logging
- azuredataexplorer
- azuremonitor
- instana
- jaeger
- loadbalancing
- sentry
- splunk_hec
- tanzuobservability
- zipkin
- alibabacloud_logservice
- clickhouse
- file
- googlecloud
- prometheusremotewrite
- awscloudwatchlogs
- googlecloudpubsub
- jaeger_thrift
- logzio
- sapm
- sumologic
- otlphttp
- googlemanagedprometheus
- opencensus
- awskinesis
- coralogix
- influxdb
- logicmonitor
- signalfx
- tencentcloud_logservice
- awsemf
- elasticsearch
- pulsar
extensions :
- zpages
- bearertokenauth
- oidc
- host_observer
- sigv4auth
- file_storage
- memory_ballast
- health_check
- oauth2client
- awsproxy
- http_forwarder
- jaegerremotesampling
- k8s_observer
- pprof
- asapclient
- basicauth
- headers_setter このエクステンションは、エクスポーターが設定されたエンドポイントにデータを送信できない事象が発生したときに、データをディスクにキューイングする機能をエクスポーターに提供します。
このエクステンションを設定するには、以下の情報を含むように設定を更新する必要があります。まず、 /tmp/otel-dataディレクトリを作成し、読み取り/書き込み権限を与えてください
extensions :
...
file_storage :
directory : /tmp/otel-data
timeout : 10s
compaction :
directory : /tmp/otel-data
on_start : true
on_rebound : true
rebound_needed_threshold_mib : 5
rebound_trigger_threshold_mib : 3
# ... truncated for clarity
service :
extensions : [ health_check, pprof, zpages, file_storage] なぜキューデータをディスクに書くの? コレクターはネットワークの不調(および、コレクターの再起動)を乗り切って、アップストリームプロバイダーに確実にデータを送信できるようになります。
キューデータをディスクに書く時の注意事項は? ディスクの性能により、データスループットの性能に影響を与える可能性があります
参照 https://community.splunk.com/t5/Community-Blog/Data-Persistence-in-the-OpenTelemetry-Collector/ba-p/624583 https://github.com/open-telemetry/opentelemetry-collector-contrib/tree/main/extension/storage/filestorage 設定を確認しましょう さて、エクステンションについて説明したので、設定の変更箇所を確認していきましょう。
Check-in 設定ファイルを確認してください 1
2
3
4
5
6
7
8
9
10
11
12
13
14
15
16
17
18
19
20
21
22
23
24
25
26
27
28
29
30
31
32
33
34
35
36
37
38
39
40
41
42
43
44
45
46
47
48
49
50
51
52
53
54
55
56
extensions :
health_check :
endpoint : 0.0.0.0 : 13133
pprof :
endpoint : 0.0.0.0 : 1777
zpages :
endpoint : 0.0.0.0 : 55679
receivers :
otlp :
protocols :
grpc :
http :
opencensus :
# Collect own metrics
prometheus :
config :
scrape_configs :
- job_name : 'otel-collector'
scrape_interval : 10s
static_configs :
- targets : [ '0.0.0.0:8888' ]
jaeger :
protocols :
grpc :
thrift_binary :
thrift_compact :
thrift_http :
zipkin :
processors :
batch :
exporters :
logging :
verbosity : detailed
service :
pipelines :
traces :
receivers : [ otlp, opencensus, jaeger, zipkin]
processors : [ batch]
exporters : [ logging]
metrics :
receivers : [ otlp, opencensus, prometheus]
processors : [ batch]
exporters : [ logging]
extensions : [ health_check, pprof, zpages]
さて、エクステンションについて復習したところで、ワークショップのデータパイプラインの部分に飛び込んでみましょう。パイプラインとは、コレクター内でデータがたどる経路を定義するもので、レシーバーから始まり、追加の処理や変更をし、最終的にエクスポーターを経由してコレクターを出ます。
OpenTelemetry Collectorのデータパイプラインは、レシーバー、プロセッサー、エクスポーターで構成されています。まずは、レシーバーから見ていきましょう。
OpenTelemetry Collector レシーバー レシーバーワークショップへようこそ!OpenTelemetry Collectorのデータパイプラインのスタート地点です。さあ、始めましょう。
レシーバーはデータをCollectorに取り込む方法で、プッシュベースとプルベースのものがあります。レシーバーは1つ以上のデータソースをサポートします。一般的に、レシーバーは指定されたフォーマットでデータを受け入れ、内部フォーマットに変換し、該当するパイプラインで定義されたプロセッサやエクスポータにデータを渡します。
プッシュまたはプルベースのレシーバは、データをCollectorに取り込む方法です。レシーバは1つまたは複数のデータソースをサポートします。通常、レシーバは指定されたフォーマットでデータを受け入れ、内部フォーマットに変換し、該当するパイプラインで定義されたプロセッサーやエクスポーターにデータを渡します。
%%{
  init:{
    "theme":"base",
    "themeVariables": {
      "primaryColor": "#ffffff",
      "clusterBkg": "#eff2fb",
      "defaultLinkColor": "#333333"
    }
  }
}%%

flowchart LR;
    style M fill:#e20082,stroke:#333,stroke-width:4px,color:#fff
    subgraph Receivers
    A[OTLP]--> M(Receivers)
    B[JAEGER]--> M(Receivers)
    C[Prometheus]--> M(Receivers)
    end
    subgraph Processors
    M(Receivers) --> H(Filters, Attributes, etc)
    E(Extensions)
    end
    subgraph Exporters
    H(Filters, Attributes, etc) --> S(OTLP)
    H(Filters, Attributes, etc) --> T(JAEGER)
    H(Filters, Attributes, etc) --> U(Prometheus)
    end
3. レシーバーのサブセクション OpenTelemetry Collector レシーバー Host Metrics レシーバー Host Metrics レシーバー
etc/otel-contrib/config.yaml ファイルを更新して、hostmetrics レシーバーを設定してみましょう。以下のYAMLを receivers セクションの下に挿入します。
sudo vi /etc/otelcol-contrib/config.yaml vi/vimの操作に慣れていない場合は、nano もお試しいただくと良いかもしれません。nanoはLinux環境でよく使われる、シンプルなエディタの一つです。
sudo nano /etc/otelcol-contrib/config.yaml Alt-U で、アンドゥができます。Macの場合は Esc キーを押したあとに U を押してください!ctrl-_ のあとに数字を入力すると、指定した行数にジャンプします。ctrl-O のあとに Enter で、ファイルを保存します。ctrl-X で、nanoを終了します。
Host Metrics Receiver Configuration receivers :
hostmetrics :
collection_interval : 10s
scrapers :
# CPU utilization metrics
cpu :
# Disk I/O metrics
disk :
# File System utilization metrics
filesystem :
# Memory utilization metrics
memory :
# Network interface I/O metrics & TCP connection metrics
network :
# CPU load metrics
load :
# Paging/Swap space utilization and I/O metrics
paging :
# Process count metrics
processes :
# Per process CPU, Memory and Disk I/O metrics. Disabled by default.
# process: OpenTelemetry Collector レシーバー Prometheus レシーバー Prometheus のレシーバーも、もちろんあります。Prometheus はOpenTelemetry Collectorで使われているオープンソースのツールキットです。このレシーバーは、OpenTelemetry Collector自身からメトリクスをスクレイピングするためにも使われます。これらのメトリクスは、コレクタの健全性をモニタリングするために使用できる。
ここでは、prometheus レシーバーを変更して、コレクター自身からメトリクスを収集できるようにしてみます。レシーバーの名前を prometheus から prometheus/internal に変更して、レシーバーが何をしているのかをより明確しましょう。設定ファイルを以下のように更新します
Prometheus Receiver Configuration prometheus/internal :
config :
scrape_configs :
- job_name : 'otel-collector'
scrape_interval : 10s
static_configs :
- targets : [ '0.0.0.0:8888' ] 上記の設定では、OpenTelemetry Collector自身が公開しているPrometheusエンドポイントをスクレイピングしています。どのような情報が得られるか、curl コマンドで試すことができます:
curl http://localhost:8888/metrics レシーバー、プロセッサー、エクスポーター、パイプラインなどのコンポーネントは、 otlp や otlp/2 のように、 type[/name] 形式に従った識別子によって定義されます。識別子が一意である限り、与えられたタイプのコンポーネントを複数回定義することができるようになります。
ここでは prometheus/internal という識別子でこのコンポーネントを特定できるようにしたので、別の prometheus レシーバーを追加して、監視対象インスタンスのPrometheusエンドポイントをスクレイピングさせることもできます。
ダッシュボード例 - Prometheus メトリクス このスクリーンショットは、 prometheus/internal レシーバーがOpenTelemetry Collectorから収集したメトリクスの、spmeのダッシュボードの例です。ここではスパン・メトリクス・ログの、それぞれの受信および送信の様子を見ることができます。
このダッシュボードはSplunk Observability Cloudにある組み込みダッシュボードで、Splunk OpenTelemetry Collectorのインストールの状況を簡単にモニタリングできます。
OpenTelemetry Collector レシーバー その他のレシーバー デフォルトの設定には、他のレシーバーがあることに気づくはずです。 otlp opencensus jaeger zipkin
Ninja: レシーバーを動的に生成するdockerコンテナ、kubernetesポッド、sshセッションのような短時間のタスクを観測するために、receiver creator レシーバーと observer エクステンションを使って、対象のサービスが起動するタイミングで新しいレシーバーを作成することができます。
何が必要なの? receiver creatorとそれに関連するobserverエクステンションの使用を開始するには、collector build manifestに追加する必要があります。
詳細は installation を参照してください。
注意事項はある? 短命なタスクの中には、username や password のような追加設定を必要とするものがあります。それらの値は環境変数 を参照したり、 ${file:./path/to/database/password} のようなスキーム展開構文を使うこともできます。
組織における機密情報の取り扱い規定に従って、どのような方法を取るかを検討してください。
Ninja ゾーン このNinjaゾーンに必要なものは2つだけです:
builder manifestに、 receiver creatorレシーバーとobserverエクステンションを追加する 検出されたエンドポイントを検出するように、設定を作成する 次のようにすると、設定をテンプレート化できます:
receiver_creator :
watch_observers : [ host_observer]
receivers :
redis :
rule : type == "port" && port == 6379
config :
password : ${env:HOST_REDIS_PASSWORD} 他の例は receiver creator’s examples にあります。
設定を確認しましょう これで、レシーバーをカバーできました。ここで、設定のの変更内容をチェックしてみましょう。
Check-in 設定をレビューしてください 1
2
3
4
5
6
7
8
9
10
11
12
13
14
15
16
17
18
19
20
21
22
23
24
25
26
27
28
29
30
31
32
33
34
35
36
37
38
39
40
41
42
43
44
45
46
47
48
49
50
51
52
53
54
55
56
57
58
59
60
61
62
63
64
65
66
67
68
69
70
71
72
73
74
75
76
77
extensions :
health_check :
endpoint : 0.0.0.0 : 13133
pprof :
endpoint : 0.0.0.0 : 1777
zpages :
endpoint : 0.0.0.0 : 55679
receivers :
hostmetrics :
collection_interval : 10s
scrapers :
# CPU utilization metrics
cpu :
# Disk I/O metrics
disk :
# File System utilization metrics
filesystem :
# Memory utilization metrics
memory :
# Network interface I/O metrics & TCP connection metrics
network :
# CPU load metrics
load :
# Paging/Swap space utilization and I/O metrics
paging :
# Process count metrics
processes :
# Per process CPU, Memory and Disk I/O metrics. Disabled by default.
# process:
otlp :
protocols :
grpc :
http :
opencensus :
# Collect own metrics
prometheus/internal :
config :
scrape_configs :
- job_name : 'otel-collector'
scrape_interval : 10s
static_configs :
- targets : [ '0.0.0.0:8888' ]
jaeger :
protocols :
grpc :
thrift_binary :
thrift_compact :
thrift_http :
zipkin :
processors :
batch :
exporters :
logging :
verbosity : detailed
service :
pipelines :
traces :
receivers : [ otlp, opencensus, jaeger, zipkin]
processors : [ batch]
exporters : [ logging]
metrics :
receivers : [ otlp, opencensus, prometheus/internal]
processors : [ batch]
exporters : [ logging]
extensions : [ health_check, pprof, zpages]
これで、レシーバーを通してOpenTelemetry Collectorにデータがどのように取り込まれるかを確認しました。次に、コレクターが受信したデータをどのように処理するかを見てみましょう。
ここではコレクターを再起動しないでください ! /etc/otelcol-contrib/config.yaml の変更はまだ完了していません。
OpenTelemetry Collector プロセッサー プロセッサー 多数のプロセッサー が含まれています。
%%{
  init:{
    "theme":"base",
    "themeVariables": {
      "primaryColor": "#ffffff",
      "clusterBkg": "#eff2fb",
      "defaultLinkColor": "#333333"
    }
  }
}%%

flowchart LR;
    style Processors fill:#e20082,stroke:#333,stroke-width:4px,color:#fff
    subgraph Receivers
    A[OTLP]--> M(Receivers)
    B[JAEGER]--> M(Receivers)
    C[Prometheus]--> M(Receivers)
    end
    subgraph Processors
    M(Receivers) --> H(Filters, Attributes, etc)
    E(Extensions)
    end
    subgraph Exporters
    H(Filters, Attributes, etc) --> S(OTLP)
    H(Filters, Attributes, etc) --> T(JAEGER)
    H(Filters, Attributes, etc) --> U(Prometheus)
    end
4. プロセッサーのサブセクション OpenTelemetry Collector プロセッサー Batch プロセッサー デフォルトでは、batch プロセッサーだけが有効になっています。このプロセッサーは、データをエクスポートする前にバッチ処理して、エクスポーターへのネットワーク・コールの回数を減らすために使われます。このワークショップではデフォルトの設定を使用します
send_batch_size (デフォルト = 8192): タイムアウトに関係なく、バッチを送信するスパン、メトリクスデータポイント、またはログレコードの数。パイプラインの次のコンポーネントに送信されるバッチサイズを制限する場合には、 send_batch_max_size を使います。timeout (デフォルト = 200ms): サイズに関係なく、バッチが送信されるまでの時間。ゼロに設定すると、send_batch_size の設定を無視して send_batch_max_size だけが適用され、データは直ちに送信されます。send_batch_max_size (デフォルト = 0): バッチサイズの上限。0 を設定すると、バッチサイズの上限がないことして扱われます。この設定は、大きなバッチが小さなユニットに分割されることを保証します。send_batch_size 以上でなければななりません。OpenTelemetry Collector プロセッサー Resource Detection プロセッサー resourcedetection プロセッサーは、ホストからリソース情報を検出して、テレメトリーデータ内のリソース値をこの情報で追加または上書きすることができます。
デフォルトでは、可能であればホスト名をFQDNに設定し、そうでなければOSが提供するホスト名になります。このロジックは hostname_sources オプションを使って変更できます。FQDNを取得せず、OSが提供するホスト名を使用するには、hostname_sources を os に設定します。
System Resource Detection Processor Configuration processors :
batch :
resourcedetection/system :
detectors : [ system]
system :
hostname_sources : [ os] If the workshop instance is running on an AWS/EC2 instance we can gather the following tags from the EC2 metadata API (this is not available on other platforms).
ワークショップのインスタンスがAWS/EC2インスタンスで実行されている場合、EC2のメタデータAPIから以下のタグを収集します(これは他のプラットフォームでは利用できないものもあります)。
cloud.provider ("aws")cloud.platform ("aws_ec2")cloud.account.idcloud.regioncloud.availability_zonehost.idhost.image.idhost.namehost.typeこれらのタグをメトリクスに追加するために、別のプロセッサーとして定義してみましょう。
EC2 Resource Detection Processor Configuration processors :
batch :
resourcedetection/system :
detectors : [ system]
system :
hostname_sources : [ os]
resourcedetection/ec2 :
detectors : [ ec2] OpenTelemetry Collector プロセッサー Attributes プロセッサー attributeプロセッサーを使うと、スパン、ログ、またはメトリクスの属性を変更できます。また、このプロセッサーは、入力データをフィルタリングし、マッチさせ、指定されたアクションに含めるべきか、除外すべきかを決定する機能もサポートしています。
アクションを設定するには、指定された順序で実行されるアクションのリストを記述します。サポートされるアクションは以下の通りです
insert: その属性がない場合に、新しい属性値を挿入します。update: その属性がある場合に、その属性値を更新します。upsert: insertまたはupdateを実行します。属性がない場合には新しい属性値を挿入し、属性がある場合にはその値を更新します。delete: 入力データから属性値を削除します。hash: 属性値をハッシュ化 (SHA1) します。extract: 入力キーの値を正規表現ルールを使って抽出し、対象キーの値を更新します。対象キーがすでに存在する場合は、その値は上書きされます。次の例のように、attributeプロセッサーを使って、キーは participant.name、あたいはあなたの名前(例: marge_simpson)という新しい属性を追加してみましょう。
INSERT_YOUR_NAME_HERE の箇所は、自分の名前に置き換えてください。また、自分の名前に スペースを使わない ようにしてください。
このワークショップの後半では、この属性を使用してSplunk Observability Cloudでメトリクスをフィルタリングします。
Attributes Processor Configuration processors :
batch :
resourcedetection/system :
detectors : [ system]
system :
hostname_sources : [ os]
resourcedetection/ec2 :
detectors : [ ec2]
attributes/conf :
actions :
- key : participant.name
action : insert
value : "INSERT_YOUR_NAME_HERE" Ninja: コネクターを使って内部への洞察を加速する最近追加されたものの一つとして、connector というコンセプトがあります。これを使うと、あるパイプラインの出力を別のパイプラインの入力に結合できるようになります。
利用シーンとして、送信するデータポイントの量、エラーステータスを含むログの数をメトリクスをとして出力するサービスがあります。他には、あるデプロイ環境から送信されるデータ量のメトリクスを生成するサービスがあります。このような場合に、countコネクターですぐに対応できます。
プロセッサーではなくコネクターなのはなぜ? プロセッサーは、処理したデータを次に渡すものであり、追加の情報を出力することはできません。コネクターはレシーバーで受け取ったデータを出力せずに、私たちが求める洞察を作り出す機会を提供します。
たとえば、countコネクターを使うと、環境変数 deployment を持たないログ、メトリクス、トレースの数をカウントすることができます。
また、非常にシンプルな例として、deployment 別にデータ使用量を分解して出力することもできます。
コネクターの注意事項 コネクターは、あるパイプラインからエクスポートされ、別のパイプラインでレシーバーで定義されたデータのみを受け入れます。コレクターをどう構築してどう利用するか、設定を検討する必要があります。
参照 https://opentelemetry.io/docs/collector/configuration/#connectors https://github.com/open-telemetry/opentelemetry-collector-contrib/tree/main/connector/countconnector 設定を確認しましょう これで、プロセッサーがカバーできました。ここで、設定のの変更内容をチェックしてみましょう。
Check-in 設定をレビューしてください 1
2
3
4
5
6
7
8
9
10
11
12
13
14
15
16
17
18
19
20
21
22
23
24
25
26
27
28
29
30
31
32
33
34
35
36
37
38
39
40
41
42
43
44
45
46
47
48
49
50
51
52
53
54
55
56
57
58
59
60
61
62
63
64
65
66
67
68
69
70
71
72
73
74
75
76
77
78
79
80
81
82
83
84
85
86
87
88
extensions :
health_check :
endpoint : 0.0.0.0 : 13133
pprof :
endpoint : 0.0.0.0 : 1777
zpages :
endpoint : 0.0.0.0 : 55679
receivers :
hostmetrics :
collection_interval : 10s
scrapers :
# CPU utilization metrics
cpu :
# Disk I/O metrics
disk :
# File System utilization metrics
filesystem :
# Memory utilization metrics
memory :
# Network interface I/O metrics & TCP connection metrics
network :
# CPU load metrics
load :
# Paging/Swap space utilization and I/O metrics
paging :
# Process count metrics
processes :
# Per process CPU, Memory and Disk I/O metrics. Disabled by default.
# process:
otlp :
protocols :
grpc :
http :
opencensus :
# Collect own metrics
prometheus/internal :
config :
scrape_configs :
- job_name : 'otel-collector'
scrape_interval : 10s
static_configs :
- targets : [ '0.0.0.0:8888' ]
jaeger :
protocols :
grpc :
thrift_binary :
thrift_compact :
thrift_http :
zipkin :
processors :
batch :
resourcedetection/system :
detectors : [ system]
system :
hostname_sources : [ os]
resourcedetection/ec2 :
detectors : [ ec2]
attributes/conf :
actions :
- key : participant.name
action : insert
value : "INSERT_YOUR_NAME_HERE"
exporters :
logging :
verbosity : detailed
service :
pipelines :
traces :
receivers : [ otlp, opencensus, jaeger, zipkin]
processors : [ batch]
exporters : [ logging]
metrics :
receivers : [ otlp, opencensus, prometheus]
processors : [ batch]
exporters : [ logging]
extensions : [ health_check, pprof, zpages]
OpenTelemetry Collector エクスポーター エクスポーターは、プッシュまたはプルベースであり、一つ以上のバックエンド/デスティネーションにデータを送信する方法です。エクスポーターは、一つまたは複数のデータソースをサポートすることがあります。
このワークショップでは、otlphttp gRPC HTTP JSON
%%{
  init:{
    "theme":"base",
    "themeVariables": {
      "primaryColor": "#ffffff",
      "clusterBkg": "#eff2fb",
      "defaultLinkColor": "#333333"
    }
  }
}%%

flowchart LR;
    style Exporters fill:#e20082,stroke:#333,stroke-width:4px,color:#fff
    subgraph Receivers
    A[OTLP]--> M(Receivers)
    B[JAEGER]--> M(Receivers)
    C[Prometheus]--> M(Receivers)
    end
    subgraph Processors
    M(Receivers) --> H(Filters, Attributes, etc)
    E(Extensions)
    end
    subgraph Exporters
    H(Filters, Attributes, etc) --> S(OTLP)
    H(Filters, Attributes, etc) --> T(JAEGER)
    H(Filters, Attributes, etc) --> U(Prometheus)
    end
5. エクスポーターのサブセクション OpenTelemetry Collector エクスポーター OTLP HTTP エクスポーター Splunk Observability CloudへHTTP経由でメトリックスを送信するためには、otlphttp エクスポーターを設定する必要があります。
/etc/otelcol-contrib/config.yaml ファイルを編集し、otlphttp エクスポーターを設定しましょう。以下のYAMLを exporters セクションの下に挿入し、例えば2スペースでインデントしてください。
また、ディスクの容量不足を防ぐために、ロギングエクスポーターの詳細度を変更します。デフォルトの detailed は非常に詳細です。
exporters :
logging :
verbosity : normal
otlphttp/splunk: 次に、metrics_endpoint を定義して、ターゲットURLを設定していきます。
Splunk主催のワークショップの参加者である場合、使用しているインスタンスにはすでにRealm環境変数が設定されています。その環境変数を設定ファイルで参照します。それ以外の場合は、新しい環境変数を作成してRealmを設定する必要があります。例えば
使用するURLは https://ingest.${env:REALM}.signalfx.com/v2/datapoint/otlp です。(Splunkは、データの居住地に応じて世界中の主要地域にRealmを持っています)。
otlphttp エクスポーターは、traces_endpoint と logs_endpoint それぞれのターゲットURLを定義することにより、トレースとログを送信するようにも設定できますが、そのような設定はこのワークショップの範囲外とします。
exporters :
logging :
verbosity : normal
otlphttp/splunk :
metrics_endpoint : https://ingest.${env:REALM}.signalfx.com/v2/datapoint/otlp デフォルトでは、すべてのエンドポイントで gzip 圧縮が有効になっています。エクスポーターの設定で compression: none を設定することにより、圧縮を無効にすることができます。このワークショップでは圧縮を有効にしたままにし、データを送信する最も効率的な方法としてデフォルト設定を使っていきます。
Splunk Observability Cloudにメトリクスを送信するためには、アクセストークンを使用する必要があります。これは、Splunk Observability Cloud UIで新しいトークンを作成することにより行うことができます。トークンの作成方法についての詳細は、Create a token を参照してください。トークンは INGEST タイプである必要があります。
Splunk主催のワークショップの参加者である場合、使用しているインスタンスにはすでにアクセストークンが設定されています(環境変数として設定されています)ので、その環境変数を設定ファイルで参照します。それ以外の場合は、新しいトークンを作成し、それを環境変数として設定する必要があります。例えば
export ACCESS_TOKEN = <replace-with-your-token>トークンは、設定ファイル内で headers: セクションの下に X-SF-TOKEN: ${env:ACCESS_TOKEN} を挿入することにで定義します
exporters :
logging :
verbosity : normal
otlphttp/splunk :
metrics_endpoint : https://ingest.${env:REALM}.signalfx.com/v2/datapoint/otlp
headers :
X-SF-TOKEN : ${env:ACCESS_TOKEN} 設定を確認しましょう これで、エクスポーターもカバーできました。設定を確認していきましょう
Check-in 設定をレビューしてください 1
2
3
4
5
6
7
8
9
10
11
12
13
14
15
16
17
18
19
20
21
22
23
24
25
26
27
28
29
30
31
32
33
34
35
36
37
38
39
40
41
42
43
44
45
46
47
48
49
50
51
52
53
54
55
56
57
58
59
60
61
62
63
64
65
66
67
68
69
70
71
72
73
74
75
76
77
78
79
80
81
82
83
84
85
86
87
88
89
90
91
92
extensions :
health_check :
endpoint : 0.0.0.0 : 13133
pprof :
endpoint : 0.0.0.0 : 1777
zpages :
endpoint : 0.0.0.0 : 55679
receivers :
hostmetrics :
collection_interval : 10s
scrapers :
# CPU utilization metrics
cpu :
# Disk I/O metrics
disk :
# File System utilization metrics
filesystem :
# Memory utilization metrics
memory :
# Network interface I/O metrics & TCP connection metrics
network :
# CPU load metrics
load :
# Paging/Swap space utilization and I/O metrics
paging :
# Process count metrics
processes :
# Per process CPU, Memory and Disk I/O metrics. Disabled by default.
# process:
otlp :
protocols :
grpc :
http :
opencensus :
# Collect own metrics
prometheus/internal :
config :
scrape_configs :
- job_name : 'otel-collector'
scrape_interval : 10s
static_configs :
- targets : [ '0.0.0.0:8888' ]
jaeger :
protocols :
grpc :
thrift_binary :
thrift_compact :
thrift_http :
zipkin :
processors :
batch :
resourcedetection/system :
detectors : [ system]
system :
hostname_sources : [ os]
resourcedetection/ec2 :
detectors : [ ec2]
attributes/conf :
actions :
- key : participant.name
action : insert
value : "INSERT_YOUR_NAME_HERE"
exporters :
logging :
verbosity : normal
otlphttp/splunk :
metrics_endpoint : https://ingest.${env:REALM}.signalfx.com/v2/datapoint/otlp
headers :
X-SF-TOKEN : ${env:ACCESS_TOKEN}
service :
pipelines :
traces :
receivers : [ otlp, opencensus, jaeger, zipkin]
processors : [ batch]
exporters : [ logging]
metrics :
receivers : [ otlp, opencensus, prometheus]
processors : [ batch]
exporters : [ logging]
extensions : [ health_check, pprof, zpages]
もちろん、OTLP プロトコルをサポートする他のソリューションを指すように metrics_endpoint を簡単に設定することができます。
次に、config.yaml のサービスセクションで、今設定したレシーバー、プロセッサー、エクスポーターを有効にしていきます。
OpenTelemetry Collector サービス Service セクションでは、レシーバー、プロセッサー、エクスポーター、およびエクステンションにある設定に基づいて、コレクターで有効にするコンポーネントを設定していきます。
コンポーネントが設定されていても、Service セクション内で定義されていない場合、そのコンポーネントは有効化されません 。
サービスのセクションは、以下の3つのサブセクションで構成されています
extensions(拡張機能) pipelines(パイプライン) telemetry(テレメトリー) デフォルトの設定では、拡張機能セクションが health_check、pprof、zpages を有効にするように設定されており、これらは以前のエクステンションのモジュールで設定しました。
service :
extensions : [ health_check, pprof, zpages] それでは、メトリックパイプラインを設定していきましょう!
6. サービスのサブセクション OpenTelemetry Collector サービス Hostmetrics レシーバー ワークショップのレシーバー部分で振り返ると、ホストシステムに関するメトリクスを生成するために、様々なソースからスクレイピングする Host Metrics レシーバーを定義しました。このレシーバーを有効にするためには、メトリクスパイプラインに hostmetrics レシーバーを含める必要があります。
metrics パイプラインで、メトリクスの receivers セクションに hostmetrics を追加します。
service :
pipelines :
traces :
receivers : [ otlp, opencensus, jaeger, zipkin]
processors : [ batch]
exporters : [ logging]
metrics :
receivers : [ hostmetrics, otlp, opencensus, prometheus]
processors : [ batch]
exporters : [ logging] OpenTelemetry Collector サービス Prometheus Internal レシーバー ワークショップの前半で、prometheus レシーバーの名前を変更し、コレクター内部のメトリクスを収集していることを反映して、prometheus/internal という名前にしました。
現在、メトリクスパイプラインの下で prometheus/internal レシーバーを有効にする必要があります。metrics パイプラインの下の receivers セクションを更新して、prometheus/internal を含めます
service :
pipelines :
traces :
receivers : [ otlp, opencensus, jaeger, zipkin]
processors : [ batch]
exporters : [ logging]
metrics :
receivers : [ hostmetrics, otlp, opencensus, prometheus/internal]
processors : [ batch]
exporters : [ logging] OpenTelemetry Collector サービス Resource Detection プロセッサー また、コレクターがインスタンスのホスト名やAWS/EC2のメタデータを取得できるように、resourcedetection/system および resourcedetection/ec2 プロセッサーを追加しました。これらのプロセッサーをメトリクスパイプライン下で有効にする必要があります。
metrics パイプラインの下の processors セクションを更新して、resourcedetection/system および resourcedetection/ec2 を追加します
service :
pipelines :
traces :
receivers : [ otlp, opencensus, jaeger, zipkin]
processors : [ batch]
exporters : [ logging]
metrics :
receivers : [ hostmetrics, otlp, opencensus, prometheus/internal]
processors : [ batch, resourcedetection/system, resourcedetection/ec2]
exporters : [ logging] OpenTelemetry Collector サービス Attributes プロセッサー また、このワークショップのプロセッサーセクションでは、attributes/conf プロセッサーを追加し、コレクターがすべてのメトリクスに participant.name という新しい属性を挿入するようにしました。これをメトリクスパイプライン下で有効にする必要があります。
metrics パイプラインの下の processors セクションを更新して、attributes/conf を追加します
service :
pipelines :
traces :
receivers : [ otlp, opencensus, jaeger, zipkin]
processors : [ batch]
exporters : [ logging]
metrics :
receivers : [ hostmetrics, otlp, opencensus, prometheus/internal]
processors : [ batch, resourcedetection/system, resourcedetection/ec2, attributes/conf]
exporters : [ logging] OpenTelemetry Collector サービス OTLP HTTP エクスポーター ワークショップのエクスポーターセクションでは、otlphttp エクスポーターを設定して、メトリクスをSplunk Observability Cloudに送信するようにしました。これをメトリクスパイプライン下で有効にする必要があります。
metrics パイプラインの下の exporters セクションを更新して、otlphttp/splunk を追加します
service :
pipelines :
traces :
receivers : [ otlp, opencensus, jaeger, zipkin]
processors : [ batch]
exporters : [ logging]
metrics :
receivers : [ hostmetrics, otlp, opencensus, prometheus/internal]
processors : [ batch, resourcedetection/system, resourcedetection/ec2, attributes/conf]
exporters : [ logging, otlphttp/splunk] Ninja: コレクターの内部を観測するコレクターは、その動作に関する内部シグナルを捕捉しています。これには実行中のコンポーネントからの追加されるシグナルも含まれます。これは、データの流れに関する決定を行うコンポーネントが、その情報をメトリクスやトレースとして表面化する方法を必要とするためです。
なぜコレクターを監視するの? これは「監視者を監視するのは誰か?」という種類の問題ですが、このような情報を表面化できることは重要です。コレクターの歴史の興味深い部分は、GoメトリクスのSDKが安定と考えられる前に存在していたことで、コレクターは当面の間、この機能を提供するためにPrometheusエンドポイントを公開しています。
注意点 組織内で稼働している各コレクターの内部使用状況を監視することは、新しいメトリクス量(MTS)を大幅な増加させる可能性があります。Splunkディストリビューションはこれらのメトリクスをキュレーションしており、増加を予測するのに役立ちます。
Ninja ゾーン コレクターの内部オブザーバビリティを公開するためには、いくつかの設定を追加することがあります
telemetry schema
example-config.yml service :
telemetry :
logs :
level : <info|warn|error>
development : <true|false>
encoding : <console|json>
disable_caller : <true|false>
disable_stacktrace : <true|false>
output_paths : [ <stdout|stderr>, paths...]
error_output_paths : [ <stdout|stderr>, paths...]
initial_fields :
key : value
metrics :
level : <none|basic|normal|detailed>
# Address binds the promethues endpoint to scrape
address : <hostname:port> service :
telemetry :
logs :
level : info
encoding : json
disable_stacktrace : true
initial_fields :
instance.name : ${env:INSTANCE}
metrics :
address : localhost:8888 参照 https://opentelemetry.io/docs/collector/configuration/#service 完成した設定 Check-in 完成した設定をレビューしてください 1
2
3
4
5
6
7
8
9
10
11
12
13
14
15
16
17
18
19
20
21
22
23
24
25
26
27
28
29
30
31
32
33
34
35
36
37
38
39
40
41
42
43
44
45
46
47
48
49
50
51
52
53
54
55
56
57
58
59
60
61
62
63
64
65
66
67
68
69
70
71
72
73
74
75
76
77
78
79
80
81
82
83
84
85
86
87
88
89
90
91
92
extensions :
health_check :
endpoint : 0.0.0.0 : 13133
pprof :
endpoint : 0.0.0.0 : 1777
zpages :
endpoint : 0.0.0.0 : 55679
receivers :
hostmetrics :
collection_interval : 10s
scrapers :
# CPU utilization metrics
cpu :
# Disk I/O metrics
disk :
# File System utilization metrics
filesystem :
# Memory utilization metrics
memory :
# Network interface I/O metrics & TCP connection metrics
network :
# CPU load metrics
load :
# Paging/Swap space utilization and I/O metrics
paging :
# Process count metrics
processes :
# Per process CPU, Memory and Disk I/O metrics. Disabled by default.
# process:
otlp :
protocols :
grpc :
http :
opencensus :
# Collect own metrics
prometheus/internal :
config :
scrape_configs :
- job_name : 'otel-collector'
scrape_interval : 10s
static_configs :
- targets : [ '0.0.0.0:8888' ]
jaeger :
protocols :
grpc :
thrift_binary :
thrift_compact :
thrift_http :
zipkin :
processors :
batch :
resourcedetection/system :
detectors : [ system]
system :
hostname_sources : [ os]
resourcedetection/ec2 :
detectors : [ ec2]
attributes/conf :
actions :
- key : participant.name
action : insert
value : "INSERT_YOUR_NAME_HERE"
exporters :
logging :
verbosity : normal
otlphttp/splunk :
metrics_endpoint : https://ingest.${env:REALM}.signalfx.com/v2/datapoint/otlp
headers :
X-SF-TOKEN : ${env:ACCESS_TOKEN}
service :
pipelines :
traces :
receivers : [ otlp, opencensus, jaeger, zipkin]
processors : [ batch]
exporters : [ logging]
metrics :
receivers : [ hostmetrics, otlp, opencensus, prometheus/internal]
processors : [ batch, resourcedetection/system, resourcedetection/ec2, attributes/conf]
exporters : [ logging, otlphttp/splunk]
extensions : [ health_check, pprof, zpages]
コレクターを再起動する前に、設定ファイルを検証することをお勧めします。これは、組み込みの validate コマンドを使用して行うことができます
Command
Example error output otelcol-contrib validate --config= file:/etc/otelcol-contrib/config.yaml Error: failed to get config: cannot unmarshal the configuration: 1 error(s) decoding:
* error decoding 'processors': error reading configuration for "attributes/conf": 1 error(s) decoding:
* 'actions[0]' has invalid keys: actions
2023/06/29 09:41:28 collector server run finished with error: failed to get config: cannot unmarshal the configuration: 1 error(s) decoding:
* error decoding 'processors': error reading configuration for "attributes/conf": 1 error(s) decoding:
* 'actions[0]' has invalid keys: actions 動作する設定ができたので、コレクターを起動し、その後 zPages が報告している内容を確認しましょう。
sudo systemctl restart otelcol-contrib
データの可視化 Splunk Observability Cloud OpenTelemetry Collectorを設定してSplunk Observability Cloudにメトリクスを送信するようにしたので、Splunk Observability Cloudでデータを見てみましょう。Splunk Observability Cloudへの招待を受け取っていない場合は、講師がログイン資格情報を提供します。
その前に、もう少し興味深くするために、インスタンスでストレステストを実行しましょう。これにより、ダッシュボードが活性化されます。
sudo apt install stress
while true; do stress -c 2 -t 40; stress -d 5 -t 40; stress -m 20 -t 40; done
Splunk Observability Cloudにログインしたら、左側のナビゲーションを使用して Dashboards に移動します
検索ボックスで OTel Contrib を検索します
ダッシュボードが存在しない場合は、講師が迅速に追加します。このワークショップのSplunk主催版に参加していない場合、インポートするダッシュボードグループはこのページの下部にあります。
OTel Contrib Dashboard ダッシュボードをクリックして開きます
ダッシュボードの上部にある Filter 欄に「participant」の途中まで入力し、候補に出る participant.name を選択します
participant.name で、config.yaml 内で設定したあなたの名前を入力するか、リストから選択することができます
これで、OpenTelemetry Collectorを設定したホストの、ホストメトリクスを確認することができます。
OpenTelemetry Collector を開発する カスタムコンポーネントの開発 Open Telemetry Collectorのためのコンポーネントを構築するには、以下の3つの主要な部分が必要です
Configuration - ユーザーが設定できる値は何か Factory - 提供された値を使ってコンポーネントを作成する Business Logic - コンポーネントが実行する必要があること これについて、プロジェクトの重要なDevOpsメトリクスを追跡するためにJenkinsと連携するコンポーネントを構築する例を考えていきます。
測定しようとしているメトリクスは次のとおりです
変更に対するリードタイム - 「コミットが本番環境に入るまでにかかる時間」 変更失敗率 - 「本番環境での障害を引き起こすデプロイの割合」 デプロイ頻度 - 「[チーム]が本番環境に成功してリリースする頻度」 平均復旧時間 - 「[チーム]が本番環境の障害から復旧するのにかかる時間」 これらの指標はGoogleの DevOps Research and Assessment (DORA) チームによって特定されたもので、ソフトウェア開発チームのパフォーマンスを示すのに役立ちます。Jenkins CI を選択した理由は、私たちが同じオープンソースソフトウェアエコシステムに留まり、将来的にベンダー管理のCIツールが採用する例となることができるためです。
計装 🆚 コンポーネント 組織内でオブザーバビリティを向上させる際には、トレードオフが発生するため、考慮する点があります。
長所 短所 (自動)計装 システムを観測するために外部APIが不要 計装を変更するにはプロジェクトの変更が必要 システム所有者/開発者は可観測性の変更が可能 ランタイムへの追加の依存が必要 システムの文脈を理解し、Exemplar とキャプチャされたデータを関連付けることが可能 システムのパフォーマンスに影響を与える可能性がある コンポーネント データ名や意味の変更をシステムのリリースサイクルから独立した展開が可能 APIの破壊的な変更の可能性があり、システムとコレクター間でリリースの調整が必要 その後の利用に合わせて収集されるデータの更新/拡張が容易 キャプチャされたデータの意味がシステムリリースと一致せず、予期せず壊れる可能性がある
8. Developのサブセクション OpenTelemetry Collector を開発する プロジェクトのセットアップ Ninja このワークショップのセクションを完了する時間は経験によって異なる場合があります。
完成したものはこちら にあります。詰まった場合や講師と一緒に進めたい場合に利用してください。
新しい Jenkins CI レシーバーの開発を始めるため、まずはGoプロジェクトのセットアップから始めていきます。
新しいGoプロジェクトを作成する手順は以下の通りです
${HOME}/go/src/jenkinscireceiver という名前の新しいディレクトリを作成し、そのディレクトリに移動します。実際のディレクトリ名や場所は厳密ではありません。自分の開発ディレクトリを自由に選ぶことができます。 go mod init splunk.conf/workshop/example/jenkinscireceiver を実行して、Goのモジュールを初期化します。依存関係を追跡するために使用される go.mod というファイルが作成されます。 インポートされている依存関係のチェックサム値が go.sum として保存されます。 Check-in go.modをレビューする `` text
module splunk.conf/workshop/example/jenkinscireceiver
go 1.20
OpenTelemetry Collector を開発する Configuration の構築 コンポーネントのConfiguration部分は、ユーザーがコンポーネントに対する入力を行う方法であり、設定に使用される値は以下のようである必要があります
そのフィールドが何を制御するのか、ユーザーが直感的に理解できる 必須項目とオプション項目が明確である 共通の名前とフィールドを再利用する オプションをシンプルに保つ ---
# Required Values
endpoint : http://my-jenkins-server:8089
auth :
authenticator : basicauth/jenkins
# Optional Values
collection_interval : 10m
metrics :
example.metric.1 :
enabled : true
example.metric.2 :
enabled : true
example.metric.3 :
enabled : true
example.metric.4 :
enabled : true ---
jenkins_server_addr : hostname
jenkins_server_api_port : 8089
interval : 10m
filter_builds_by :
- name : my-awesome-build
status : amber
track :
values :
example.metric.1 : yes
example.metric.2 : yes
example.metric.3 : no
example.metric.4 : no 悪い例では、Configurationのベストプラクティスに反するとコンポーネントが使いにくくなってしまうことが理解できるはずです。
フィールドの値が何であるべきかを明確ではなく、既存のプロセッサーに移譲できる機能を含み、コレクター内の他のコンポーネントと比較してフィールドの命名に一貫性がありません。
良い例では、必要な値をシンプルに保ち、他のコンポーネントからのフィールド名を再利用し、コンポーネントがJenkinsとコレクター間の相互作用にのみ焦点を当てています。
設定値の中には、このコンポーネントで独自に追加するものと、コレクター内部の共有ライブラリによって提供されているものがあります。これらはビジネスロジックに取り組む際にさらに詳しく説明します。Configurationは小さく始めるべきで、ビジネスロジックに追加の機能が必要になったら、設定も追加していきましょう。
コードを書く Configurationに必要なコードを実装するために、config.go という名前の新しいファイルを以下の内容で作成します
package jenkinscireceiver
import (
"go.opentelemetry.io/collector/config/confighttp"
"go.opentelemetry.io/collector/receiver/scraperhelper"
"splunk.conf/workshop/example/jenkinscireceiver/internal/metadata"
)
type Config struct {
// HTTPClientSettings contains all the values
// that are commonly shared across all HTTP interactions
// performed by the collector.
confighttp . HTTPClientSettings `mapstructure:",squash"`
// ScraperControllerSettings will allow us to schedule
// how often to check for updates to builds.
scraperhelper . ScraperControllerSettings `mapstructure:",squash"`
// MetricsBuilderConfig contains all the metrics
// that can be configured.
metadata . MetricsBuilderConfig `mapstructure:",squash"`
} OpenTelemetry Collector を開発する コンポーネントを検討する Jenkinsからメトリクスを取得するために必要なコンポーネントの種類をおさらいしましょう
エクステンション
レシーバー
プロセッサー
エクスポーター
Ninja: コネクター エクステンションが解決するビジネスユースケースは以下の通りです
実行時の設定が必要な共有機能を持つ コレクターの実行時間の観察に間接的に役立つ 詳細については、エクステンションの概要 を参照してください。
レシーバーが解決するビジネスユースケースは以下の通りです
リモートソースからのデータの取得 リモートソースからのデータの受信 これらは一般的に pull 対 push ベースのデータ収集と呼ばれ、詳細についてはレシーバーの概要 で読むことができます。
プロセッサーが解決するビジネスユースケースは以下の通りです
データ、フィールド、または値の追加または削除 データの観察と意思決定 バッファリング、キューイング、および並べ替え プロセッサーを通過するデータタイプは、下流のコンポーネントに同じデータタイプを転送する必要があることを覚えておいてください。
詳細については、プロセッサーの概要 をご覧ください。
エクスポーターが解決するビジネスユースケースは以下の通りです
データをツール、サービス、またはストレージに送信する OpenTelemetryコレクターは「バックエンド」、すべてを一元化した観測可能性スイートを目指すのではなく、OpenTelemetryの創設原則に忠実であり続けることを目指しています。つまり、ベンダーに依存しない全ての人のための観測可能性です。詳細については、エクスポーターの概要 をお読みください。
コネクターは比較的新しいコンポーネントで、このワークショップではあまり触れていません。
コネクターは、異なるテレメトリタイプやパイプラインをまたいで使用できるプロセッサーのようなものだといえます。たとえば、コネクターはログとしてデータを受け取り、メトリクスとして出力したり、あるパイプラインからメトリクスを受け取り、テレメトリーデータに関するメトリクスを提供したりすることができます。
コネクターが解決するビジネスケースは以下の通りです
異なるテレメトリタイプ間の変換ログからメトリクスへ トレースからメトリクスへ メトリクスからログへ 受信したデータを観察し、自身のデータを生成するメトリクスを受け取り、データの分析メトリクスを生成する。 Ninja セクションの一部としてプロセッサーの概要 内で簡単に概要が説明されています。
これらのコンポーネントについて考えると、Jenkinsに対応する場合はプルベースのレシーバーを開発する必要があることがわかります。
OpenTelemetry Collector を開発する メトリクスを設計する レシーバーによってキャプチャされるメトリクスを定義し、エクスポートするために、コレクターのために開発された mdatagen を使って、yamlで定義したメトリクスをコードに変換していきます。
---
# Type defines the name to reference the component
# in the configuration file
type : jenkins
# Status defines the component type and the stability level
status :
class : receiver
stability :
development : [ metrics]
# Attributes are the expected fields reported
# with the exported values.
attributes :
job.name :
description : The name of the associated Jenkins job
type : string
job.status :
description : Shows if the job had passed, or failed
type : string
enum :
- failed
- success
- unknown
# Metrics defines all the pontentially exported values from this receiver.
metrics :
jenkins.jobs.count :
enabled : true
description : Provides a count of the total number of configured jobs
unit : "{Count}"
gauge :
value_type : int
jenkins.job.duration :
enabled : true
description : Show the duration of the job
unit : "s"
gauge :
value_type : int
attributes :
- job.name
- job.status
jenkins.job.commit_delta :
enabled : true
description : The calculation difference of the time job was finished minus commit timestamp
unit : "s"
gauge :
value_type : int
attributes :
- job.name
- job.status // To generate the additional code needed to capture metrics,
// the following command to be run from the shell:
// go generate -x ./...
//go:generate go run github.com/open-telemetry/opentelemetry-collector-contrib/cmd/mdatagen@v0.80.0 metadata.yaml
package jenkinscireceiver
// There is no code defined within this file. 次のセクションに進む前に、これらのファイルをプロジェクトフォルダ内に作成してください。
Factory の構築 Factoryはソフトウェアデザインパターンの一種で、提供されたConfigurationを使って、動的にオブジェクト(この場合は jenkinscireceiver)を作成するものです。現実的な例では、携帯電話店に行って、あなたの正確な説明に合った携帯電話を求め、それを提供されるようなものです。
コマンド go generate -x ./... を実行すると、定義されたメトリクスをエクスポートするために必要なすべてのコードを含む新しいフォルダ jenkinscireceiver/internal/metadata が作成されます。生成されるコードは以下の通りです
factory.go
config.go
scraper.go
build-config.yaml
project layout package jenkinscireceiver
import (
"errors"
"go.opentelemetry.io/collector/component"
"go.opentelemetry.io/collector/config/confighttp"
"go.opentelemetry.io/collector/receiver"
"go.opentelemetry.io/collector/receiver/scraperhelper"
"splunk.conf/workshop/example/jenkinscireceiver/internal/metadata"
)
func NewFactory () receiver . Factory {
return receiver . NewFactory (
metadata . Type ,
newDefaultConfig ,
receiver . WithMetrics ( newMetricsReceiver , metadata . MetricsStability ),
)
}
func newMetricsReceiver ( _ context . Context , set receiver . CreateSettings , cfg component . Config , consumer consumer . Metrics ) ( receiver . Metrics , error ) {
// Convert the configuration into the expected type
conf , ok := cfg .( * Config )
if ! ok {
return nil , errors . New ( "can not convert config" )
}
sc , err := newScraper ( conf , set )
if err != nil {
return nil , err
}
return scraperhelper . NewScraperControllerReceiver (
& conf . ScraperControllerSettings ,
set ,
consumer ,
scraperhelper . AddScraper ( sc ),
)
} package jenkinscireceiver
import (
"go.opentelemetry.io/collector/config/confighttp"
"go.opentelemetry.io/collector/receiver/scraperhelper"
"splunk.conf/workshop/example/jenkinscireceiver/internal/metadata"
)
type Config struct {
// HTTPClientSettings contains all the values
// that are commonly shared across all HTTP interactions
// performed by the collector.
confighttp . HTTPClientSettings `mapstructure:",squash"`
// ScraperControllerSettings will allow us to schedule
// how often to check for updates to builds.
scraperhelper . ScraperControllerSettings `mapstructure:",squash"`
// MetricsBuilderConfig contains all the metrics
// that can be configured.
metadata . MetricsBuilderConfig `mapstructure:",squash"`
}
func newDefaultConfig () component . Config {
return & Config {
ScraperControllerSettings : scraperhelper . NewDefaultScraperControllerSettings ( metadata . Type ),
HTTPClientSettings : confighttp . NewDefaultHTTPClientSettings (),
MetricsBuilderConfig : metadata . DefaultMetricsBuilderConfig (),
}
} package jenkinscireceiver
type scraper struct {}
func newScraper ( cfg * Config , set receiver . CreateSettings ) ( scraperhelper . Scraper , error ) {
// Create a our scraper with our values
s := scraper {
// To be filled in later
}
return scraperhelper . NewScraper ( metadata . Type , s . scrape )
}
func ( scraper ) scrape ( ctx context . Context ) ( pmetric . Metrics , error ) {
// To be filled in
return pmetrics . NewMetrics (), nil
} ---
dist :
name : otelcol
description : "Conf workshop collector"
output_path : ./dist
version : v0.0.0-experimental
extensions :
- gomod : github.com/open-telemetry/opentelemetry-collector-contrib/extension/basicauthextension v0.80.0
- gomod : github.com/open-telemetry/opentelemetry-collector-contrib/extension/healthcheckextension v0.80.0
receivers :
- gomod : go.opentelemetry.io/collector/receiver/otlpreceiver v0.80.0
- gomod : github.com/open-telemetry/opentelemetry-collector-contrib/receiver/jaegerreceiver v0.80.0
- gomod : github.com/open-telemetry/opentelemetry-collector-contrib/receiver/prometheusreceiver v0.80.0
- gomod : splunk.conf/workshop/example/jenkinscireceiver v0.0.0
path : ./jenkinscireceiver
processors :
- gomod : go.opentelemetry.io/collector/processor/batchprocessor v0.80.0
exporters :
- gomod : go.opentelemetry.io/collector/exporter/loggingexporter v0.80.0
- gomod : go.opentelemetry.io/collector/exporter/otlpexporter v0.80.0
- gomod : go.opentelemetry.io/collector/exporter/otlphttpexporter v0.80.0
# This replace is a go directive that allows for redefine
# where to fetch the code to use since the default would be from a remote project.
replaces :
splunk.conf/workshop/example/jenkinscireceiver => ./jenkinscireceiver ├── build-config.yaml
└── jenkinscireceiver
├── go.mod
├── config.go
├── factory.go
├── scraper.go
└── internal
└── metadata これらのファイルがプロジェクトに作成されたら、go mod tidy を実行します。すると、すべての依存ライブラリが取得され、go.mod が更新されます。
OpenTelemetry Collector を開発する ビジネスロジックを作る この時点では、何も行っていないカスタムコンポーネントが作成されています。ここから、Jenkinsからデータを取得するための必要なロジックを追加していきましょう。
ここからのステップは以下の通りです
Jenkinsに接続するクライアントを作成する 設定されたすべてのジョブをキャプチャする 設定されたジョブの最後のビルドのステータスを報告する コミットタイムスタンプとジョブ完了の時間差を計算する 変更を scraper.go に加えていきます。
Jenkinsクライアントを追加する
ジョブをキャプチャする
ジョブの状態を報告する
差分を報告する Jenkinsサーバーに接続するために、パッケージ “github.com/yosida95/golang-jenkins” を使用します。これには、Jenkinsサーバーからデータを読み取るために必要な機能が提供されています。
次に、“go.opentelemetry.io/collector/receiver/scraperhelper” ライブラリのいくつかのヘルパー関数を利用して、コンポーネントの起動が完了したらJenkinsサーバーに接続できるようにするスタート関数を作成します。
package jenkinscireceiver
import (
"context"
jenkins "github.com/yosida95/golang-jenkins"
"go.opentelemetry.io/collector/component"
"go.opentelemetry.io/collector/pdata/pmetric"
"go.opentelemetry.io/collector/receiver"
"go.opentelemetry.io/collector/receiver/scraperhelper"
"splunk.conf/workshop/example/jenkinscireceiver/internal/metadata"
)
type scraper struct {
mb * metadata . MetricsBuilder
client * jenkins . Jenkins
}
func newScraper ( cfg * Config , set receiver . CreateSettings ) ( scraperhelper . Scraper , error ) {
s := & scraper {
mb : metadata . NewMetricsBuilder ( cfg . MetricsBuilderConfig , set ),
}
return scraperhelper . NewScraper (
metadata . Type ,
s . scrape ,
scraperhelper . WithStart ( func ( ctx context . Context , h component . Host ) error {
client , err := cfg . ToClient ( h , set . TelemetrySettings )
if err != nil {
return err
}
// The collector provides a means of injecting authentication
// on our behalf, so this will ignore the libraries approach
// and use the configured http client with authentication.
s . client = jenkins . NewJenkins ( nil , cfg . Endpoint )
s . client . SetHTTPClient ( client )
return nil
}),
)
}
func ( s scraper ) scrape ( ctx context . Context ) ( pmetric . Metrics , error ) {
// To be filled in
return pmetric . NewMetrics (), nil
} これで、Jenkinsレシーバーを初期化するために必要なすべてのコードが完成しました。
ここから先は、実装が必要な scrape メソッドに焦点を当てます。このメソッドは、設定された間隔(デフォルトでは1分)ごとに実行されます。
Jenkinsサーバーの負荷状況や、どの程度のプロジェクトが実行されているかを測定するために、Jenkinsで設定されているジョブの数をキャプチャしたいと考えています。これを行うために、Jenkinsクライアントを呼び出してすべてのジョブをリスト化し、エラーが報告された場合はメトリクスなしでそれを返し、そうでなければメトリクスビルダーからのデータを発行します。
func ( s scraper ) scrape ( ctx context . Context ) ( pmetric . Metrics , error ) {
jobs , err := s . client . GetJobs ()
if err != nil {
return pmetric . Metrics {}, err
}
// Recording the timestamp to ensure
// all captured data points within this scrape have the same value.
now := pcommon . NewTimestampFromTime ( time . Now ())
// Casting to an int64 to match the expected type
s . mb . RecordJenkinsJobsCountDataPoint ( now , int64 ( len ( jobs )))
// To be filled in
return s . mb . Emit (), nil
} 前のステップにより、すべてのジョブをキャプチャしてジョブの数をレポートできるようになりました。
このステップでは、それぞれのジョブを調査し、レポートされた値を使用してメトリクスをキャプチャしていきます。
func ( s scraper ) scrape ( ctx context . Context ) ( pmetric . Metrics , error ) {
jobs , err := s . client . GetJobs ()
if err != nil {
return pmetric . Metrics {}, err
}
// Recording the timestamp to ensure
// all captured data points within this scrape have the same value.
now := pcommon . NewTimestampFromTime ( time . Now ())
// Casting to an int64 to match the expected type
s . mb . RecordJenkinsJobsCountDataPoint ( now , int64 ( len ( jobs )))
for _ , job := range jobs {
// Ensure we have valid results to start off with
var (
build = job . LastCompletedBuild
status = metadata . AttributeJobStatusUnknown
)
// This will check the result of the job, however,
// since the only defined attributes are
// `success`, `failure`, and `unknown`.
// it is assume that anything did not finish
// with a success or failure to be an unknown status.
switch build . Result {
case "aborted" , "not_built" , "unstable" :
status = metadata . AttributeJobStatusUnknown
case "success" :
status = metadata . AttributeJobStatusSuccess
case "failure" :
status = metadata . AttributeJobStatusFailed
}
s . mb . RecordJenkinsJobDurationDataPoint (
now ,
int64 ( job . LastCompletedBuild . Duration ),
job . Name ,
status ,
)
}
return s . mb . Emit (), nil
} 最後のステップでは、コミットからジョブ完了までにかかった時間を計算して、DORA メトリクス を推測するのに役立てていきます。
func ( s scraper ) scrape ( ctx context . Context ) ( pmetric . Metrics , error ) {
jobs , err := s . client . GetJobs ()
if err != nil {
return pmetric . Metrics {}, err
}
// Recording the timestamp to ensure
// all captured data points within this scrape have the same value.
now := pcommon . NewTimestampFromTime ( time . Now ())
// Casting to an int64 to match the expected type
s . mb . RecordJenkinsJobsCountDataPoint ( now , int64 ( len ( jobs )))
for _ , job := range jobs {
// Ensure we have valid results to start off with
var (
build = job . LastCompletedBuild
status = metadata . AttributeJobStatusUnknown
)
// Previous step here
// Ensure that the `ChangeSet` has values
// set so there is a valid value for us to reference
if len ( build . ChangeSet . Items ) == 0 {
continue
}
// Making the assumption that the first changeset
// item is the most recent change.
change := build . ChangeSet . Items [ 0 ]
// Record the difference from the build time
// compared against the change timestamp.
s . mb . RecordJenkinsJobCommitDeltaDataPoint (
now ,
int64 ( build . Timestamp - change . Timestamp ),
job . Name ,
status ,
)
}
return s . mb . Emit (), nil
} これらのステップがすべて完了すると、Jenkins CIレシーバーが完成します!
次は何をするの? コンポーネントに必要な機能は、おそらく他にもたくさん思いつくでしょう。例えば
ジョブで使用されたブランチ名を含めることはできますか? ジョブのプロジェクト名を含めることはできますか? プロジェクトのジョブの総持続時間をどのように計算しますか? 変更が機能するかどうかをどのように検証しますか? この時間を使って遊んでみたり、壊してみたり、変更してみたり、ビルドからのログをキャプチャしてみるなどしてください。