OpenTelemetry Collector サービス
OpenTelemetry Collector サービス
OTLP HTTP エクスポーター #
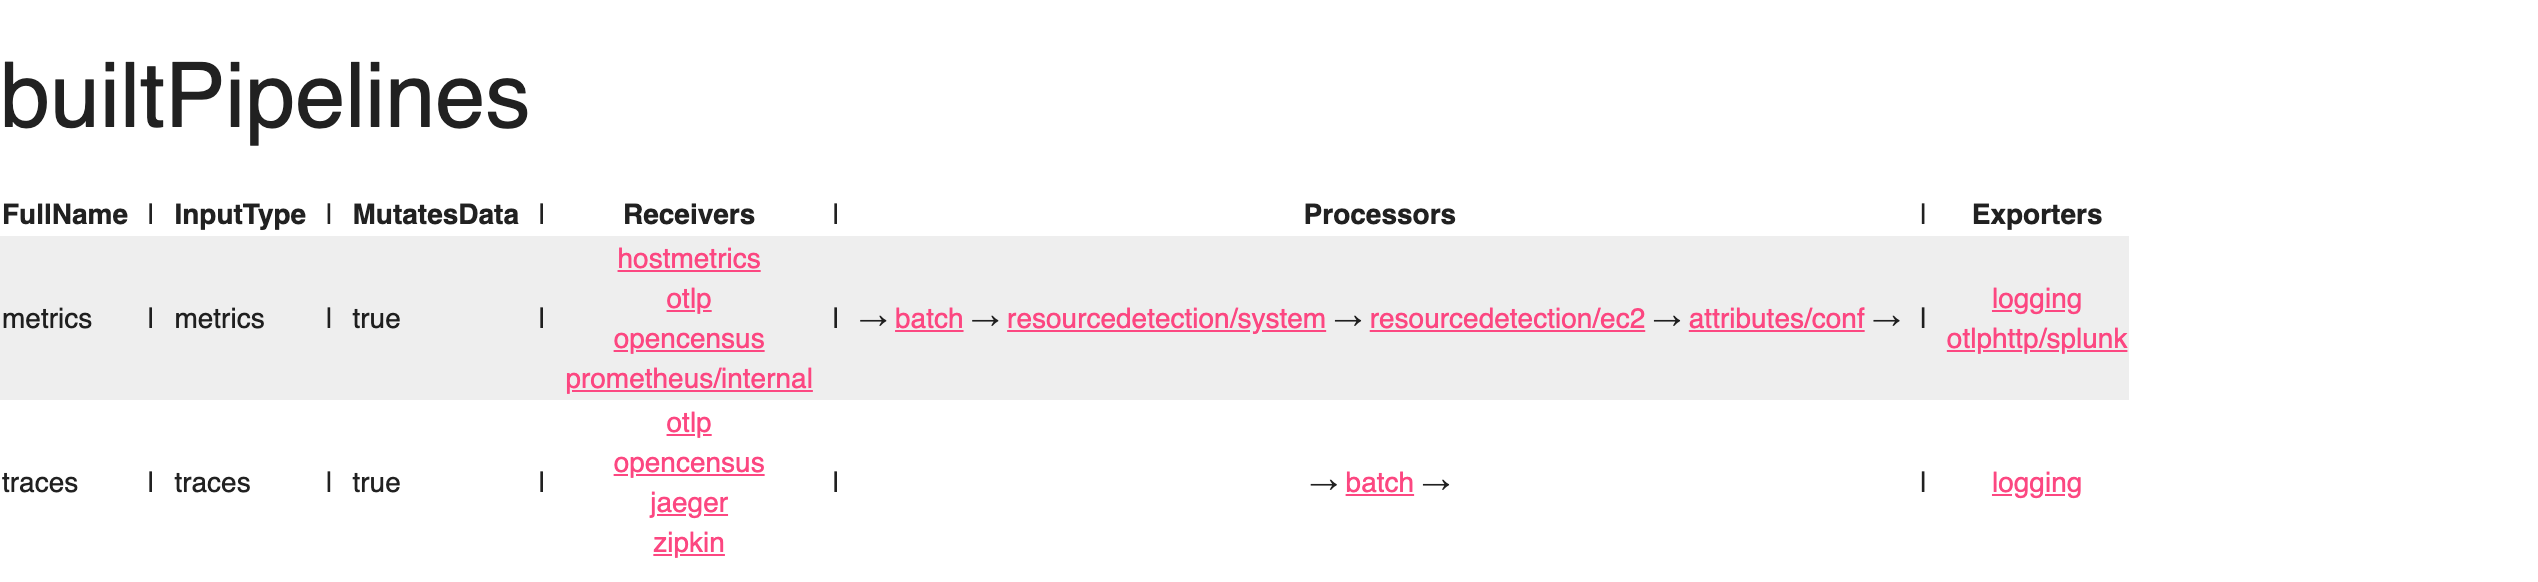
ワークショップのエクスポーターセクションでは、otlphttp エクスポーターを設定して、メトリクスをSplunk Observability Cloudに送信するようにしました。これをメトリクスパイプライン下で有効にする必要があります。
metrics パイプラインの下の exporters セクションを更新して、otlphttp/splunk を追加します
yaml
service:

  pipelines:

    traces:
      receivers: [otlp, opencensus, jaeger, zipkin]
      processors: [batch]
      exporters: [logging]

    metrics:
      receivers: [hostmetrics, otlp, opencensus, prometheus/internal]
      processors: [batch, resourcedetection/system, resourcedetection/ec2, attributes/conf]
exporters: [logging, otlphttp/splunk]完成した設定 #
Tip
コレクターを再起動する前に、設定ファイルを検証することをお勧めします。これは、組み込みの validate コマンドを使用して行うことができます
yaml
service:
  telemetry:
    logs:
      level: <info|warn|error>
      development: <true|false>
      encoding: <console|json>
      disable_caller: <true|false>
      disable_stacktrace: <true|false>
      output_paths: [<stdout|stderr>, paths...]
      error_output_paths: [<stdout|stderr>, paths...]
      initial_fields:
        key: value
    metrics:
      level: <none|basic|normal|detailed>
      # Address binds the promethues endpoint to scrape
      address: <hostname:port>
yaml
service:
  telemetry:
    logs:
      level: info
      encoding: json
      disable_stacktrace: true
      initial_fields:
        instance.name: ${env:INSTANCE}
    metrics:
address: localhost:8888 yaml
extensions:
  health_check:
    endpoint: 0.0.0.0:13133
  pprof:
    endpoint: 0.0.0.0:1777
  zpages:
    endpoint: 0.0.0.0:55679

receivers:
  hostmetrics:
    collection_interval: 10s
    scrapers:
      # CPU utilization metrics
      cpu:
      # Disk I/O metrics
      disk:
      # File System utilization metrics
      filesystem:
      # Memory utilization metrics
      memory:
      # Network interface I/O metrics & TCP connection metrics
      network:
      # CPU load metrics
      load:
      # Paging/Swap space utilization and I/O metrics
      paging:
      # Process count metrics
      processes:
      # Per process CPU, Memory and Disk I/O metrics. Disabled by default.
      # process:
  otlp:
    protocols:
      grpc:
      http:

  opencensus:

  # Collect own metrics
  prometheus/internal:
    config:
      scrape_configs:
      - job_name: 'otel-collector'
        scrape_interval: 10s
        static_configs:
        - targets: ['0.0.0.0:8888']

  jaeger:
    protocols:
      grpc:
      thrift_binary:
      thrift_compact:
      thrift_http:

  zipkin:

processors:
  batch:
  resourcedetection/system:
    detectors: [system]
    system:
      hostname_sources: [os]
  resourcedetection/ec2:
    detectors: [ec2]
  attributes/conf:
    actions:
      - key: participant.name
        action: insert
        value: "INSERT_YOUR_NAME_HERE"

exporters:
  logging:
    verbosity: normal
  otlphttp/splunk:
    metrics_endpoint: https://ingest.${env:REALM}.signalfx.com/v2/datapoint/otlp
    headers:
      X-SF-TOKEN: ${env:ACCESS_TOKEN}

service:

  pipelines:

    traces:
      receivers: [otlp, opencensus, jaeger, zipkin]
      processors: [batch]
      exporters: [logging]

    metrics:
      receivers: [hostmetrics, otlp, opencensus, prometheus/internal]
      processors: [batch, resourcedetection/system, resourcedetection/ec2, attributes/conf]
      exporters: [logging, otlphttp/splunk]

extensions: [health_check, pprof, zpages]bash
otelcol-contrib validate --config=file:/etc/otelcol-contrib/config.yamltext
Error: failed to get config: cannot unmarshal the configuration: 1 error(s) decoding:

* error decoding 'processors': error reading configuration for "attributes/conf": 1 error(s) decoding:

* 'actions[0]' has invalid keys: actions
2023/06/29 09:41:28 collector server run finished with error: failed to get config: cannot unmarshal the configuration: 1 error(s) decoding:

* error decoding 'processors': error reading configuration for "attributes/conf": 1 error(s) decoding:

* 'actions[0]' has invalid keys: actions
動作する設定ができたので、コレクターを起動し、その後 zPages が報告している内容を確認しましょう。
bash
sudo systemctl restart otelcol-contrib