# Enable/disable debug loggingdebug:enabled:falseverbose:~# Configure unique cluster name & IDcluster:name:isovalent-demoid:0# Configure ENI specificseni:enabled:trueupdateEC2AdapterLimitViaAPI:true# Dynamically fetch ENI limits from EC2 APIawsEnablePrefixDelegation:true# Assign /28 CIDR blocks per ENI (16 IPs) instead of individual IPsenableIPv4Masquerade:false# Pods use their real VPC IPs — no SNAT needed in ENI modeloadBalancer:serviceTopology:true# Prefer backends in the same AZ to reduce cross-AZ traffic costsipam:mode:eniroutingMode:native # No overlay tunnels — traffic routes natively through VPC# BPF / KubeProxyReplacement# Cilium replaces kube-proxy entirely with eBPF programs in the kernel.# This requires a direct path to the API server, hence k8sServiceHost.kubeProxyReplacement:"true"k8sServiceHost:<YOUR-EKS-API-SERVER-ENDPOINT>k8sServicePort:443# TLS for internal Cilium communicationtls:ca:certValidityDuration:3650# 10 years for the CA cert# Hubble: network observability built on top of Cilium's eBPF datapathhubble:enabled:truemetrics:enableOpenMetrics:true# Use OpenMetrics format for better Prometheus compatibilityenabled:# DNS: query/response tracking with namespace-level label context- dns:labelsContext=source_namespace,destination_namespace# Drop: packet drop reasons (policy deny, invalid, etc.) per namespace- drop:labelsContext=source_namespace,destination_namespace# TCP: connection state tracking (SYN, FIN, RST) per namespace- tcp:labelsContext=source_namespace,destination_namespace# Port distribution: which destination ports are being used- port-distribution:labelsContext=source_namespace,destination_namespace# ICMP: ping/traceroute visibility with workload identity context- icmp:labelsContext=source_namespace,destination_namespace;sourceContext=workload-name|reserved-identity;destinationContext=workload-name|reserved-identity# Flow: per-workload flow counters (forwarded, dropped, redirected)- flow:sourceContext=workload-name|reserved-identity;destinationContext=workload-name|reserved-identity# HTTP L7: request/response metrics with full workload context and exemplars for trace correlation- "httpV2:exemplars=true;labelsContext=source_ip,source_namespace,source_workload,destination_namespace,destination_workload,traffic_direction;sourceContext=workload-name|reserved-identity;destinationContext=workload-name|reserved-identity"# Policy: network policy verdict tracking (allowed/denied) per workload- "policy:sourceContext=app|workload-name|pod|reserved-identity;destinationContext=app|workload-name|pod|dns|reserved-identity;labelsContext=source_namespace,destination_namespace"# Flow export: enables Hubble to export flow records to Timescape for historical storage- flow_exportserviceMonitor:enabled:true# Creates a Prometheus ServiceMonitor for auto-discoverytls:enabled:trueauto:enabled:truemethod:cronJob # Automatically rotate Hubble TLS certs on a schedulecertValidityDuration:1095# 3 years per cert rotationrelay:enabled:true# Hubble Relay aggregates flows from all nodes cluster-widetls:server:enabled:trueprometheus:enabled:trueserviceMonitor:enabled:truetimescape:enabled:true# Stores historical flow data for time-travel debugging# Cilium Operator: cluster-wide identity and endpoint managementoperator:prometheus:enabled:trueserviceMonitor:enabled:true# Cilium Agent: per-node eBPF datapath metricsprometheus:enabled:trueserviceMonitor:enabled:true# Cilium Envoy: L7 proxy metrics (HTTP, gRPC)envoy:prometheus:enabled:trueserviceMonitor:enabled:true# Enable the Cilium agent to hand off DNS proxy responsibilities to the# external DNS Proxy HA deployment, so policies keep working during upgradesextraConfig:external-dns-proxy:"true"# Enterprise feature gates — these must be explicitly approvedenterprise:featureGate:approved:- DNSProxyHA # High-availability DNS proxy (installed separately)- HubbleTimescape # Historical flow storage via Timescape
# Tetragon configuration with Enhanced Network Observability enabled# Required for Splunk Observability Cloud Network Explorer integrationtetragon:# Enable network events — this activates eBPF-based socket trackingenableEvents:network:true# Layer3 settings: track TCP, UDP, and ICMP with RTT and latency# These enable the socket stats metrics (srtt, retransmits, bytes, etc.)layer3:tcp:enabled:truertt:enabled:true# Round-trip time per TCP flowudp:enabled:trueicmp:enabled:truelatency:enabled:true# Per-connection latency tracking# DNS tracking at the kernel level (complements Hubble DNS metrics)dns:enabled:true# Expose Tetragon metrics via Prometheusprometheus:enabled:trueserviceMonitor:enabled:true# Filter out noise from internal system namespaces — we only care about# application workloads, not the observability stack itselfexportDenyList:|- {"health_check":true}
{"namespace":["", "cilium", "tetragon", "kube-system", "otel-splunk"]}# Only include labels that are meaningful for the Network ExplorermetricsLabelFilter:"namespace,workload,binary"resources:limits:cpu:500mmemory:1Girequests:cpu:100mmemory:256Mi# Enable the Tetragon Operator and TracingPolicy support.# With tracingPolicy.enabled: true, the operator manages and deploys# TracingPolicies (TCP connection tracking, HTTP visibility, etc.) automatically.tetragonOperator:enabled:truetracingPolicy:enabled:true
terminationGracePeriodSeconds:30agent:config:extensions:# k8s_observer watches the Kubernetes API for pod and port changes.# This enables automatic service discovery without static endpoint lists.k8s_observer:auth_type:serviceAccountobserve_pods:truereceivers:kubeletstats:collection_interval:30sinsecure_skip_verify:true# Cilium Agent (port 9962) and Hubble (port 9965) both run in the# same DaemonSet pod, identified by label k8s-app=cilium.# We use two separate scrape jobs because they're on different ports.prometheus/isovalent_cilium:config:scrape_configs:- job_name:'cilium_metrics_9962'scrape_interval:30smetrics_path:/metricskubernetes_sd_configs:- role:podrelabel_configs:- source_labels:[__meta_kubernetes_pod_label_k8s_app]action:keepregex:cilium- source_labels:[__meta_kubernetes_pod_ip]target_label:__address__replacement:${__meta_kubernetes_pod_ip}:9962- target_label:jobreplacement:'cilium_metrics_9962'- job_name:'hubble_metrics_9965'scrape_interval:30smetrics_path:/metricskubernetes_sd_configs:- role:podrelabel_configs:- source_labels:[__meta_kubernetes_pod_label_k8s_app]action:keepregex:cilium- source_labels:[__meta_kubernetes_pod_ip]target_label:__address__replacement:${__meta_kubernetes_pod_ip}:9965- target_label:jobreplacement:'hubble_metrics_9965'# Cilium Envoy uses a different pod label (k8s-app=cilium-envoy)prometheus/isovalent_envoy:config:scrape_configs:- job_name:'envoy_metrics_9964'scrape_interval:30smetrics_path:/metricskubernetes_sd_configs:- role:podrelabel_configs:- source_labels:[__meta_kubernetes_pod_label_k8s_app]action:keepregex:cilium-envoy- source_labels:[__meta_kubernetes_pod_ip]target_label:__address__replacement:${__meta_kubernetes_pod_ip}:9964- target_label:jobreplacement:'cilium_metrics_9964'# Cilium Operator is a Deployment (not DaemonSet), identified by io.cilium.app=operatorprometheus/isovalent_operator:config:scrape_configs:- job_name:'cilium_operator_metrics_9963'scrape_interval:30smetrics_path:/metricskubernetes_sd_configs:- role:podrelabel_configs:- source_labels:[__meta_kubernetes_pod_label_io_cilium_app]action:keepregex:operator- target_label:jobreplacement:'cilium_metrics_9963'# Tetragon is identified by app.kubernetes.io/name=tetragonprometheus/isovalent_tetragon:config:scrape_configs:- job_name:'tetragon_metrics_2112'scrape_interval:30smetrics_path:/metricskubernetes_sd_configs:- role:podrelabel_configs:- source_labels:[__meta_kubernetes_pod_label_app_kubernetes_io_name]action:keepregex:tetragon- source_labels:[__meta_kubernetes_pod_ip]target_label:__address__replacement:${__meta_kubernetes_pod_ip}:2112- target_label:jobreplacement:'tetragon_metrics_2112'processors:# Strict allowlist filter: only forward metrics we've explicitly named.# Without this, Cilium and Tetragon can generate thousands of metric series# and overwhelm Splunk Observability Cloud with cardinality.filter/includemetrics:metrics:include:match_type:strictmetric_names:# --- Kubernetes base metrics ---- container.cpu.usage- container.memory.rss- k8s.container.restarts- k8s.pod.phase- node_namespace_pod_container- tcp.resets- tcp.syn_timeouts# --- Cilium Agent metrics ---# API rate limiting — detect if the agent is being throttled- cilium_api_limiter_processed_requests_total- cilium_api_limiter_processing_duration_seconds# BPF map utilization — alerts when eBPF maps are near capacity- cilium_bpf_map_ops_total# Controller health — tracks background reconciliation tasks- cilium_controllers_group_runs_total- cilium_controllers_runs_total# Endpoint state — how many pods are in each lifecycle state- cilium_endpoint_state# Agent error/warning counts — early warning for problems- cilium_errors_warnings_total# IP address allocation tracking- cilium_ip_addresses- cilium_ipam_capacity# Kubernetes event processing rate- cilium_kubernetes_events_total# L7 policy enforcement (HTTP, DNS, Kafka)- cilium_policy_l7_total# DNS proxy latency histogram — key metric for catching DNS saturation- cilium_proxy_upstream_reply_seconds_bucket# --- Hubble metrics ---# DNS query and response counts — primary indicator in the demo scenario- hubble_dns_queries_total- hubble_dns_responses_total# Packet drops by reason (policy_denied, invalid, TTL_exceeded, etc.)- hubble_drop_total# Total flows processed — overall network activity volume- hubble_flows_processed_total# HTTP request latency histogram and total count- hubble_http_request_duration_seconds_bucket- hubble_http_requests_total# ICMP traffic tracking- hubble_icmp_total# Policy verdict counts (forwarded vs. dropped by policy)- hubble_policy_verdicts_total# TCP flag tracking (SYN, FIN, RST) — connection lifecycle visibility- hubble_tcp_flags_total# --- Tetragon metrics ---# Total eBPF events processed- tetragon_events_total# DNS cache health- tetragon_dns_cache_evictions_total- tetragon_dns_cache_misses_total- tetragon_dns_total# HTTP response tracking with latency- tetragon_http_response_total- tetragon_http_stats_latency_bucket- tetragon_http_stats_latency_count- tetragon_http_stats_latency_sum# Layer3 errors- tetragon_layer3_event_errors_total# TCP socket statistics — per-connection RTT, retransmits, byte/segment counts# These power the latency and throughput views in Network Explorer- tetragon_socket_stats_retransmitsegs_total- tetragon_socket_stats_rxsegs_total- tetragon_socket_stats_srtt_count- tetragon_socket_stats_srtt_sum- tetragon_socket_stats_txbytes_total- tetragon_socket_stats_txsegs_total- tetragon_socket_stats_rxbytes_total# UDP statistics- tetragon_socket_stats_udp_retrieve_total- tetragon_socket_stats_udp_txbytes_total- tetragon_socket_stats_udp_txsegs_total- tetragon_socket_stats_udp_rxbytes_total# Network flow events (connect, close, send, receive)- tetragon_network_connect_total- tetragon_network_close_total- tetragon_network_send_total- tetragon_network_receive_totalresourcedetection:detectors:[system]system:hostname_sources:[os]service:pipelines:metrics:receivers:- prometheus/isovalent_cilium- prometheus/isovalent_envoy- prometheus/isovalent_operator- prometheus/isovalent_tetragon- hostmetrics- kubeletstats- otlpprocessors:- filter/includemetrics- resourcedetectionautodetect:prometheus:trueclusterName:isovalent-demosplunkObservability:accessToken:<YOUR-SPLUNK-ACCESS-TOKEN>realm:<YOUR-SPLUNK-REALM> # e.g. us1, us2, eu0profilingEnabled:truecloudProvider:awsdistribution:eksenvironment:isovalent-demo# Gateway mode runs a central collector deployment that receives from all agents.# Agents send to the gateway, which handles batching and export to Splunk.# This reduces the number of direct connections to Splunk's ingest endpoint.gateway:enabled:trueresources:requests:cpu:250mmemory:512Milimits:cpu:1memory:1Gi# certmanager handles mTLS between the OTel Collector agent and gatewaycertmanager:enabled:true
# Confirm your nodes are healthykubectl get nodes
# Confirm Cilium and Hubble are running on both nodeskubectl get pods -n kube-system | grep -E "(cilium|hubble)"# Confirm the Splunk OTel Collector is running — this is what ships metrics to Splunkkubectl get pods -n otel-splunk
# Confirm the jobs-app is fully deployed and healthykubectl get pods -n tenant-jobs
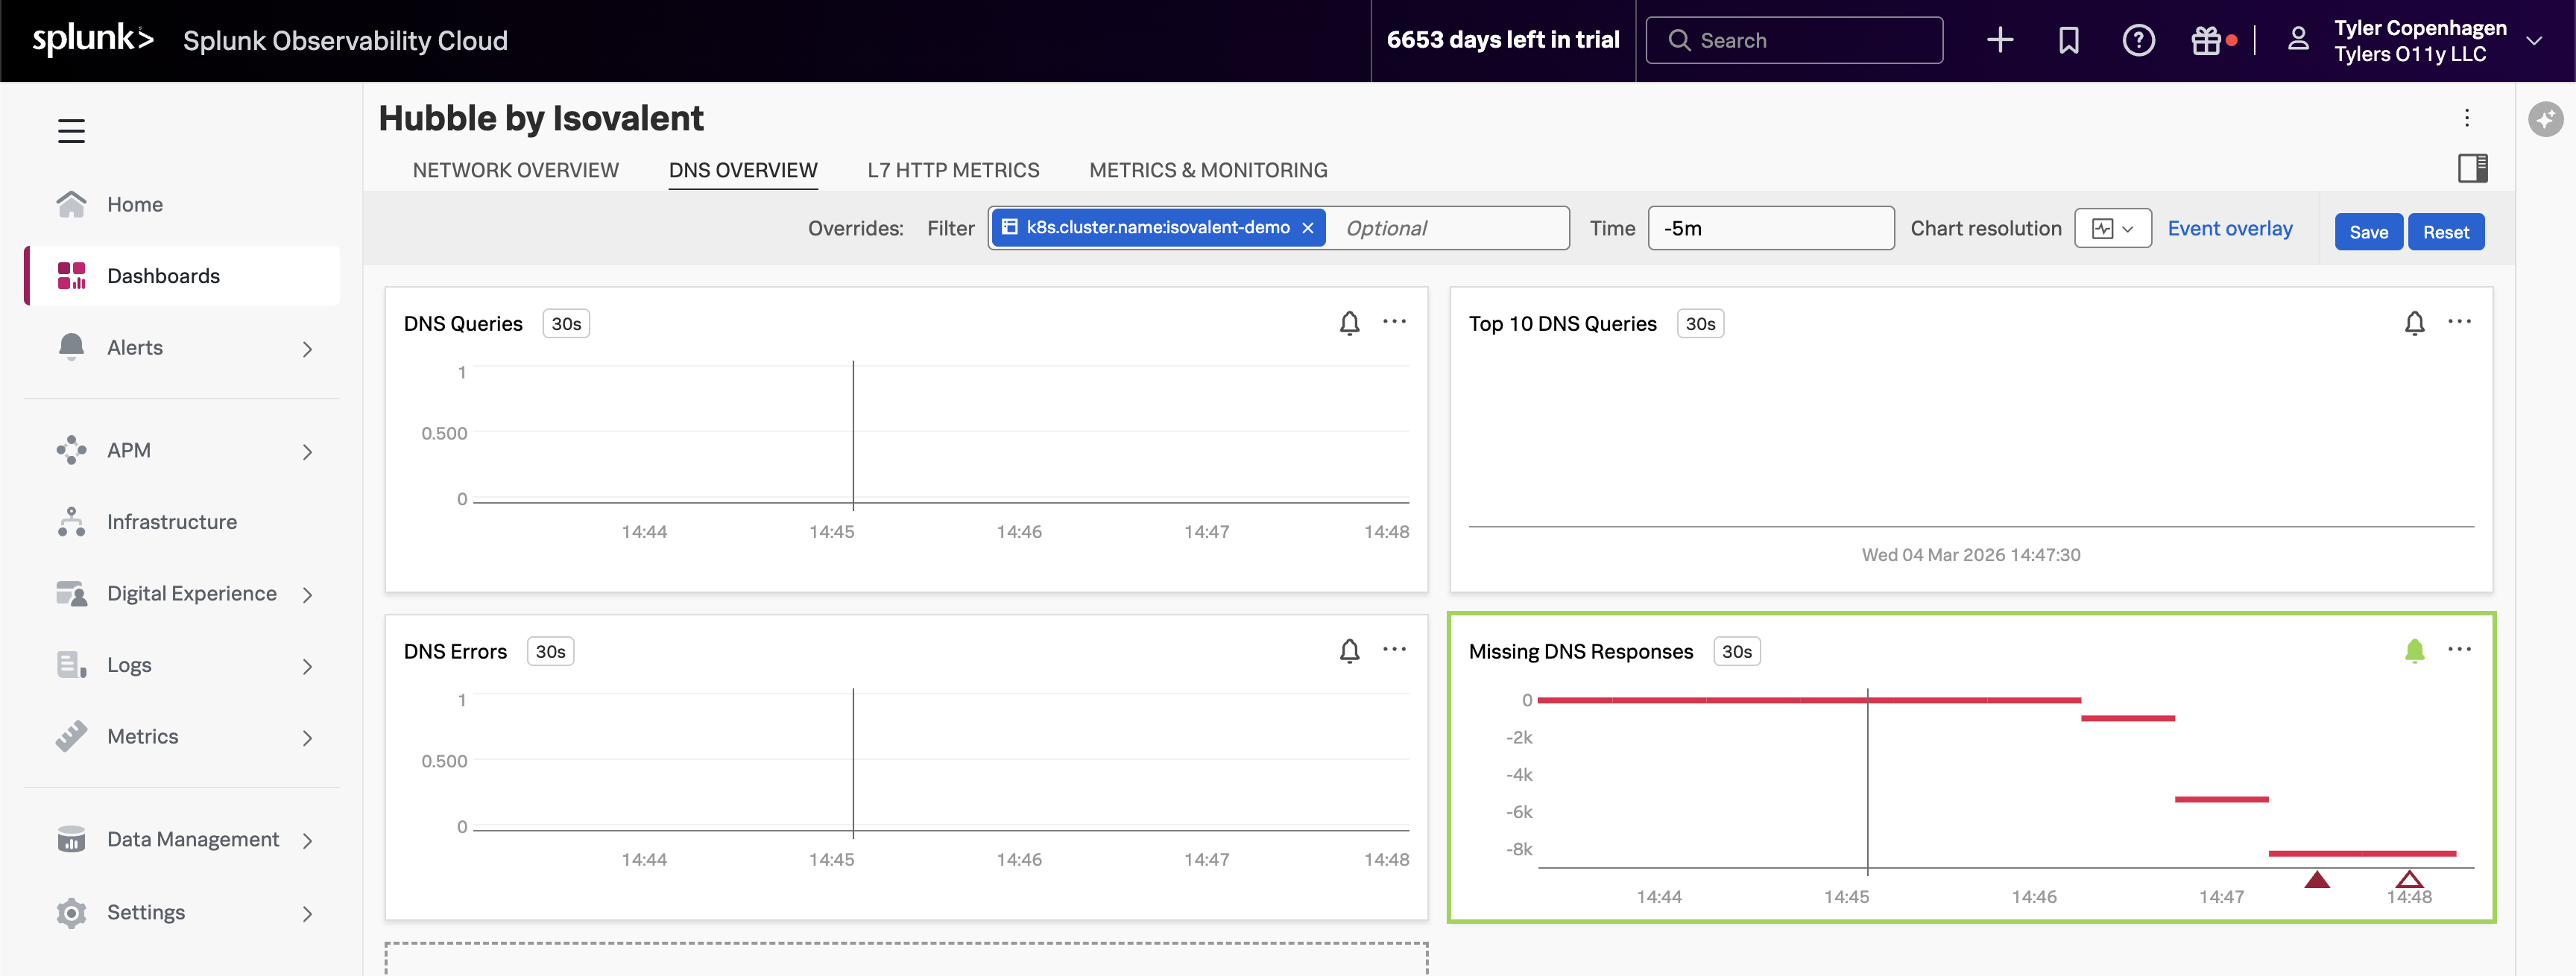
「これが全体像です:ある時点で、crawler サービスが 1 レプリカから 5 にスケールアップされ、クロール間隔が非常に積極的に設定されました — 0.2 から 0.3 秒ごと。これは 5 つの Pod が、それぞれ api.github.com を解決するために DNS ルックアップを毎秒複数回発火させています。合計すると、毎秒 15 から 25 の DNS クエリが持続的に発生します。DNS プロキシは単一のワークロードからそのような負荷を処理するようには作られていないので、キューイング、スローダウン、そして最終的にはリクエストのドロップを開始します。DNS 解決を必要とする namespace 内の他のすべてのサービスが巻き添えを食います。
それが何を見ているか確認しましょう。」
# Confirm the current crawler replica count — you'll see 5kubectl get deploy crawler -n tenant-jobs
# Pull the environment config to see the crawl frequency settingskubectl get deploy crawler -n tenant-jobs \
-o jsonpath='{.spec.template.spec.containers[0].env}'| jq .
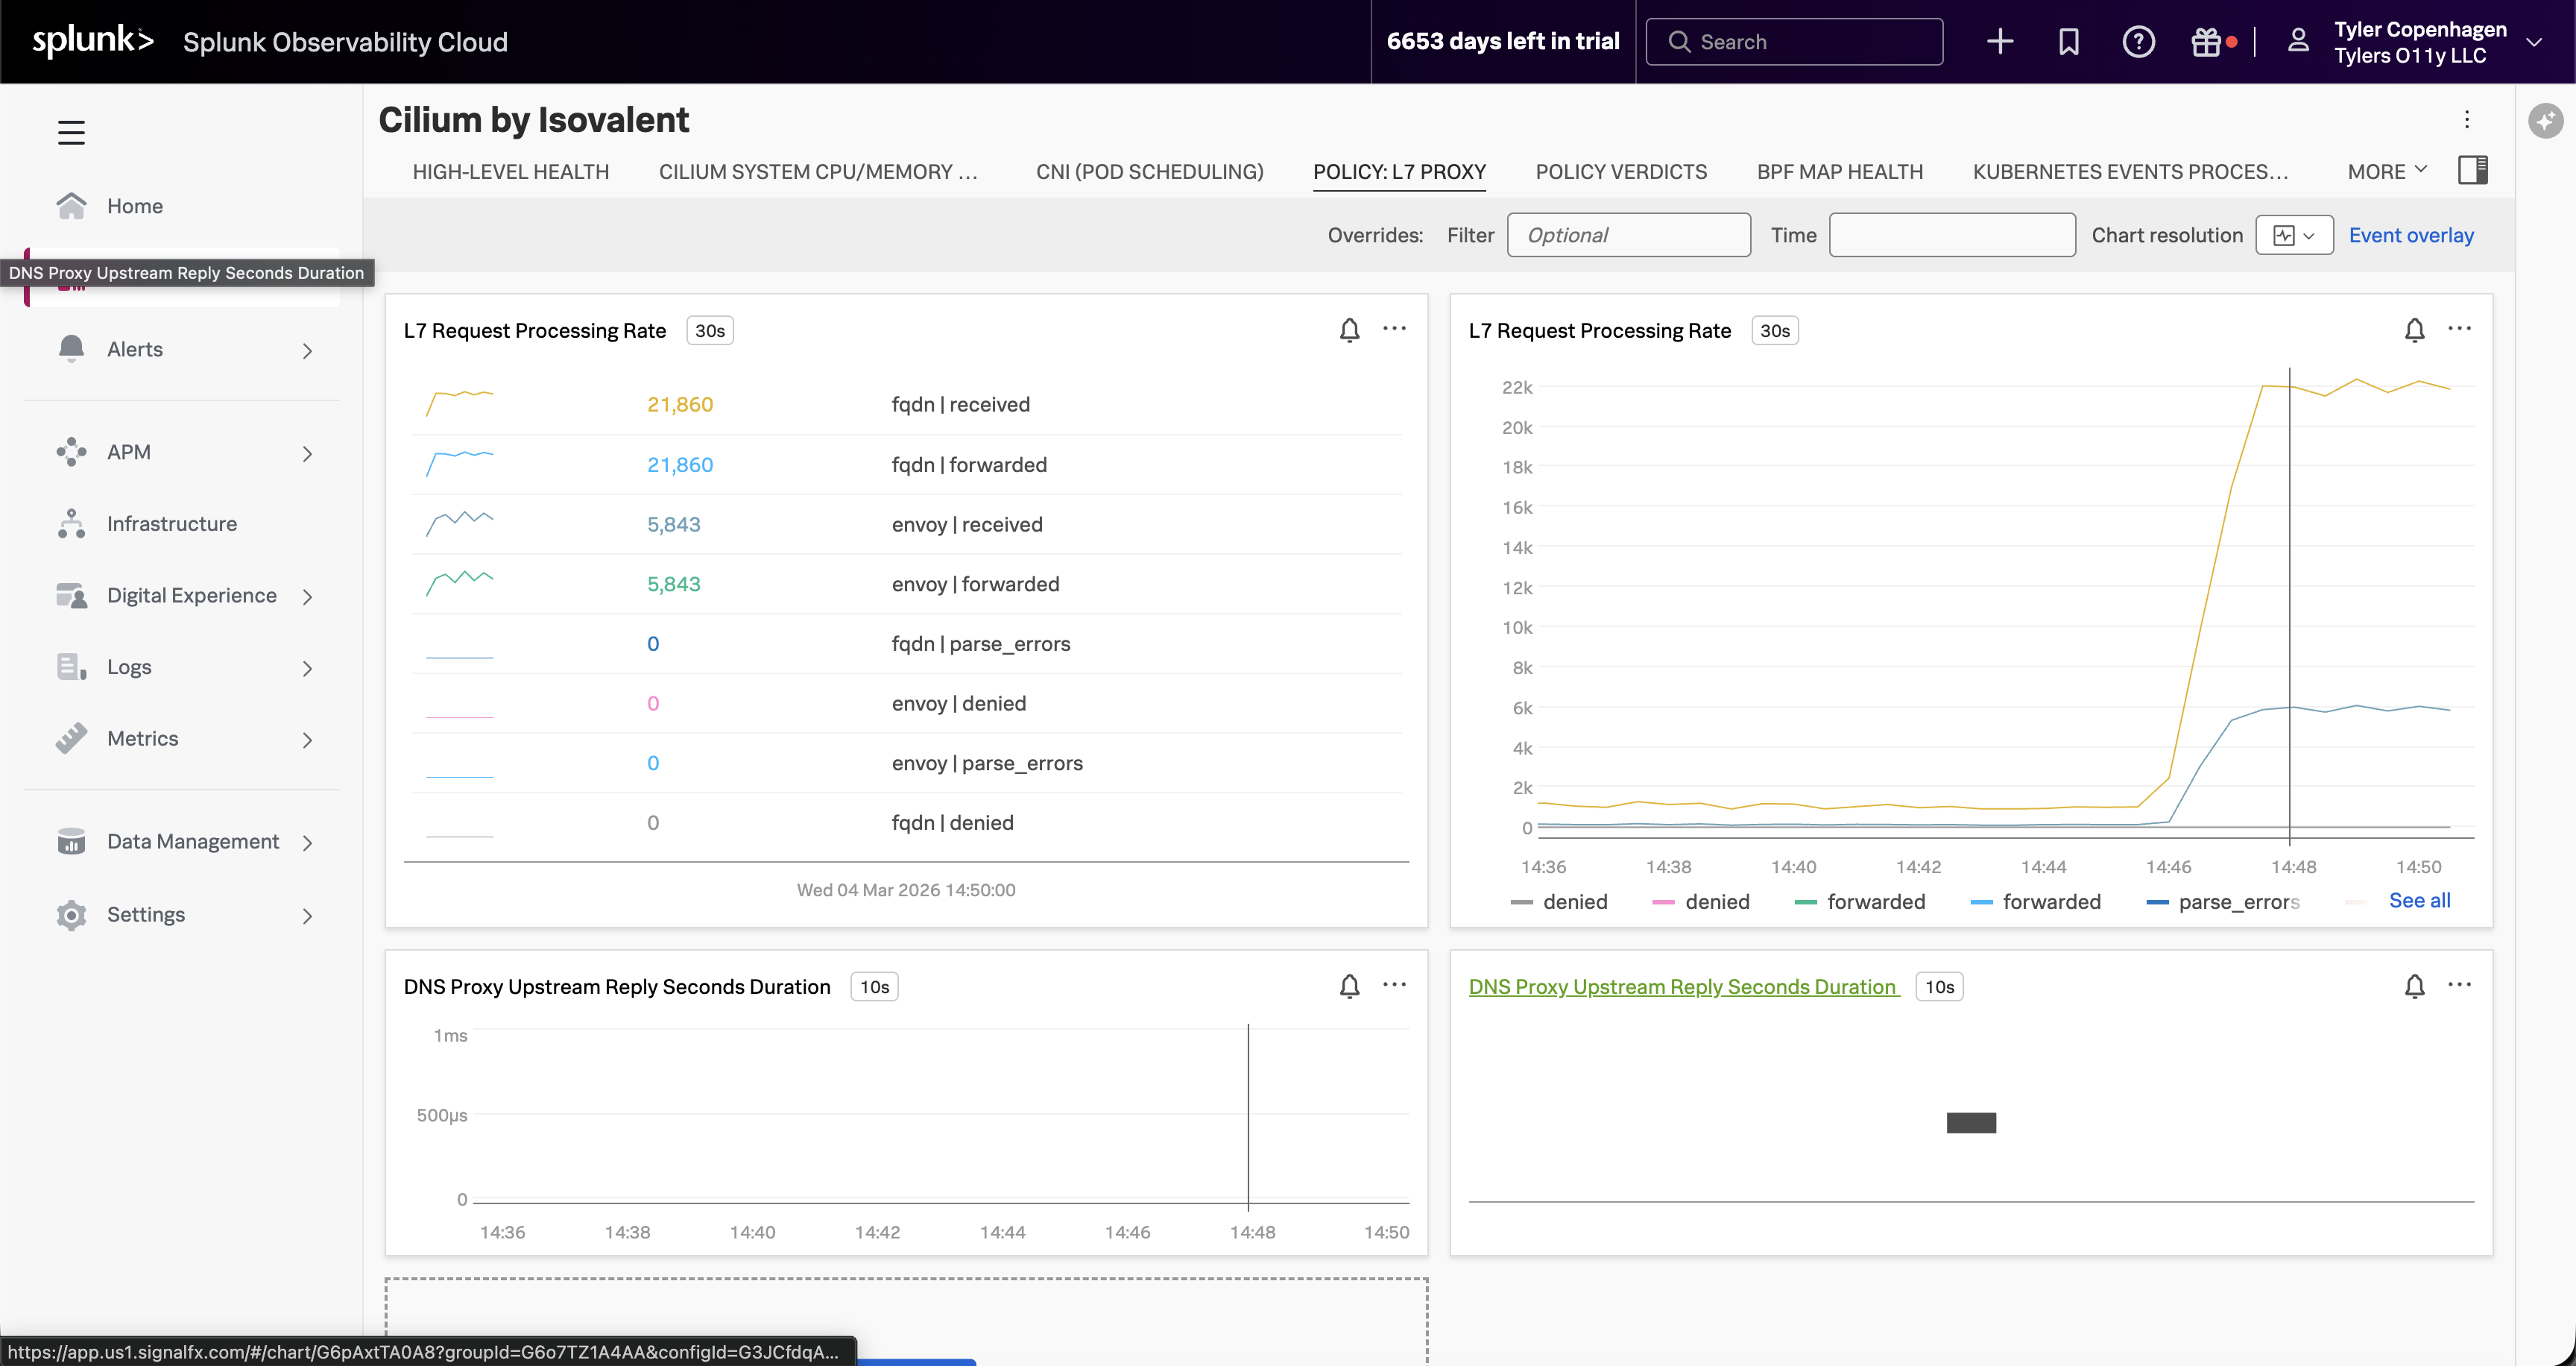
オプションとして、Cilium by Isovalent dashboard → Policy: L7 Proxy タブに切り替えます。