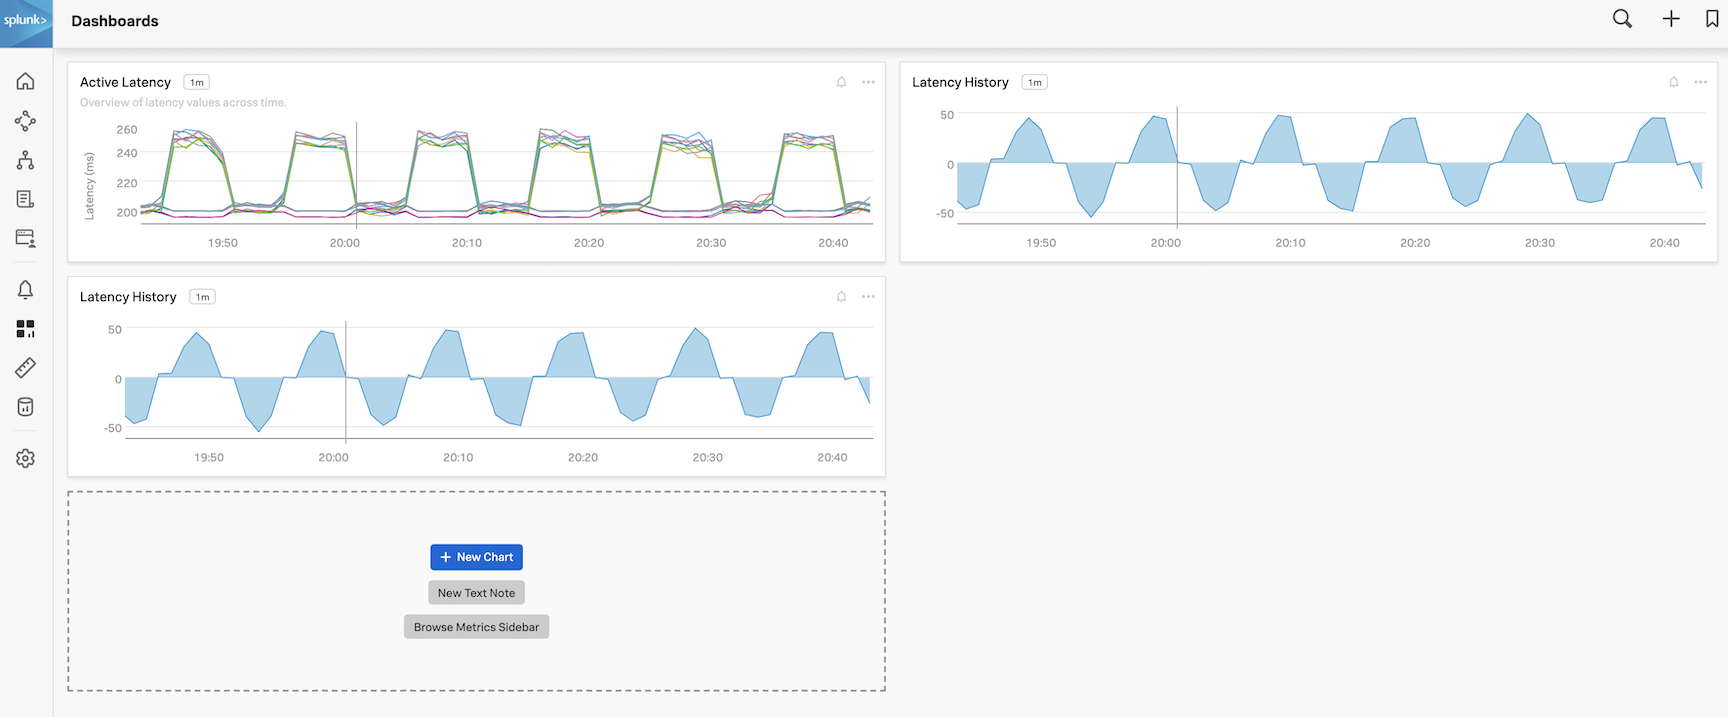
Adding charts to dashboards
1. Save to existing dashboard
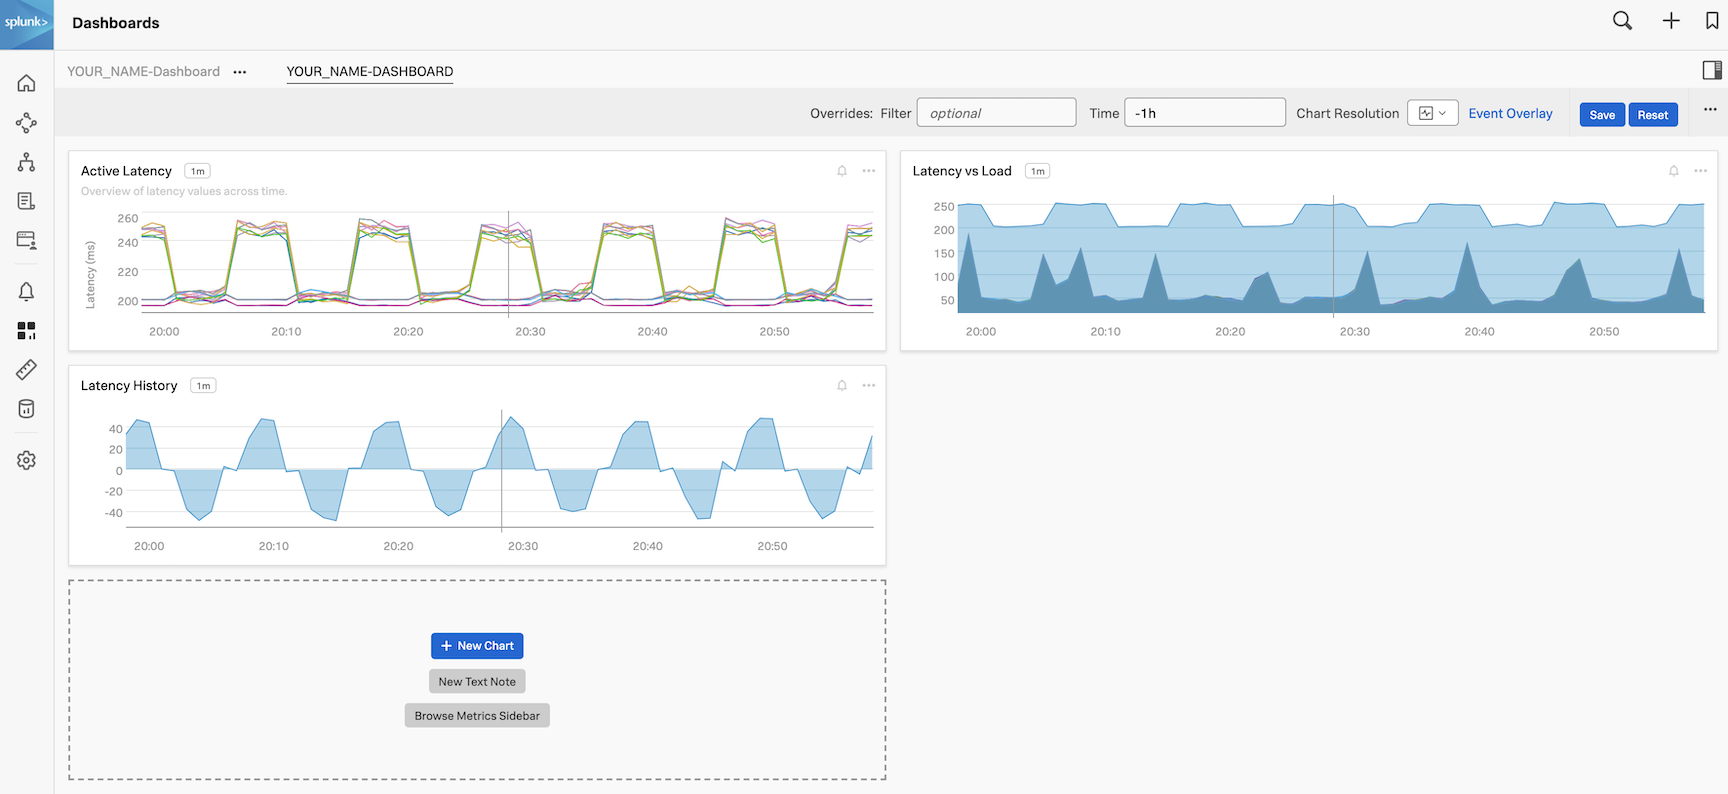
Check that you have YOUR_NAME-Dashboard: YOUR_NAME-Dashboard in the top left corner. This means you chart will be saved in this Dashboard.
Name the Chart Latency History and add a Chart Description if you wish.
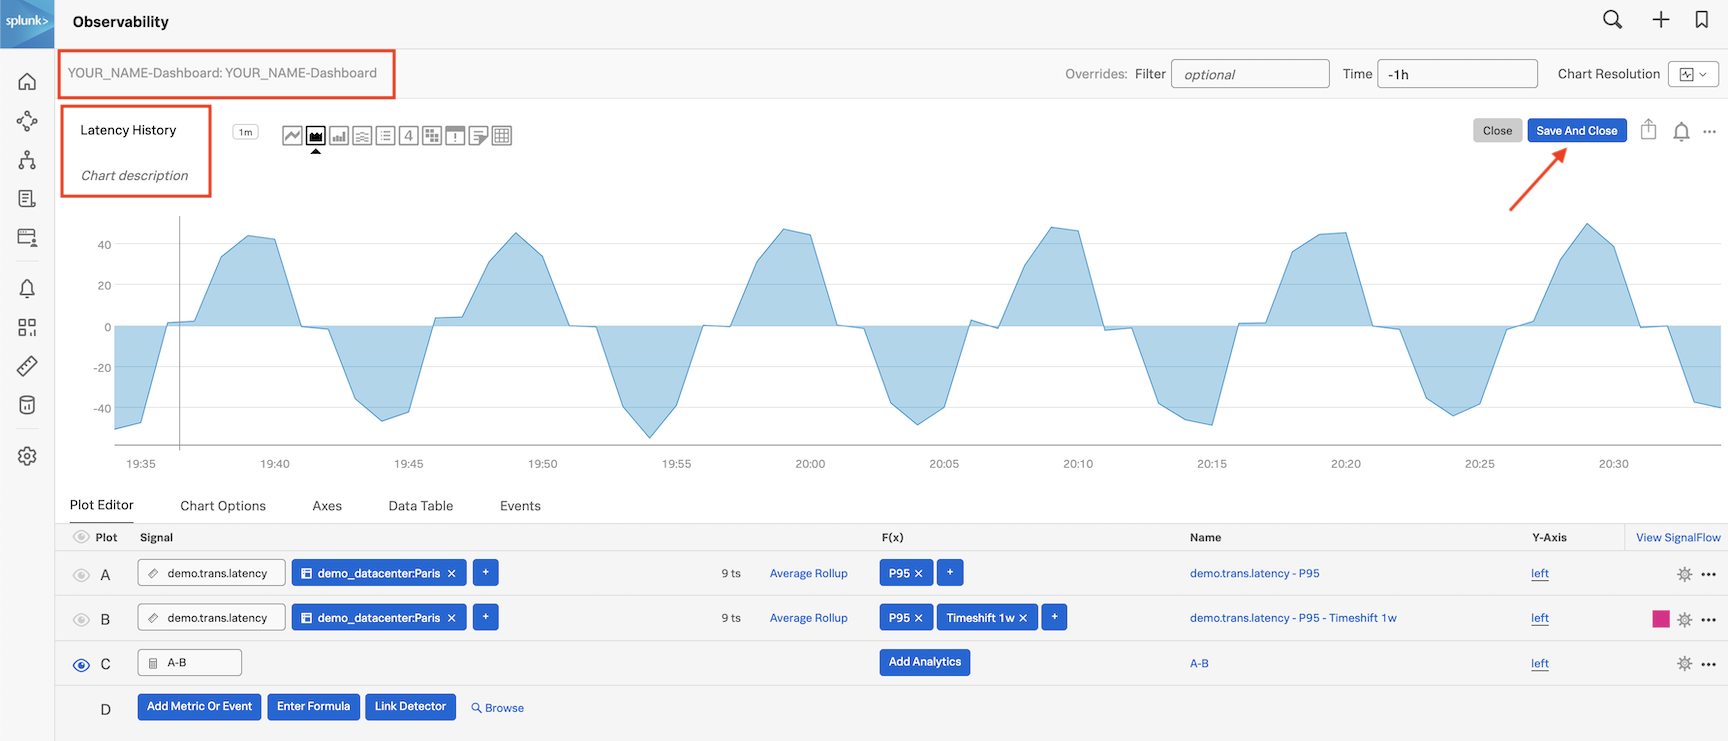
Click on Save And Close. This returns you to your dashboard that now has two charts!
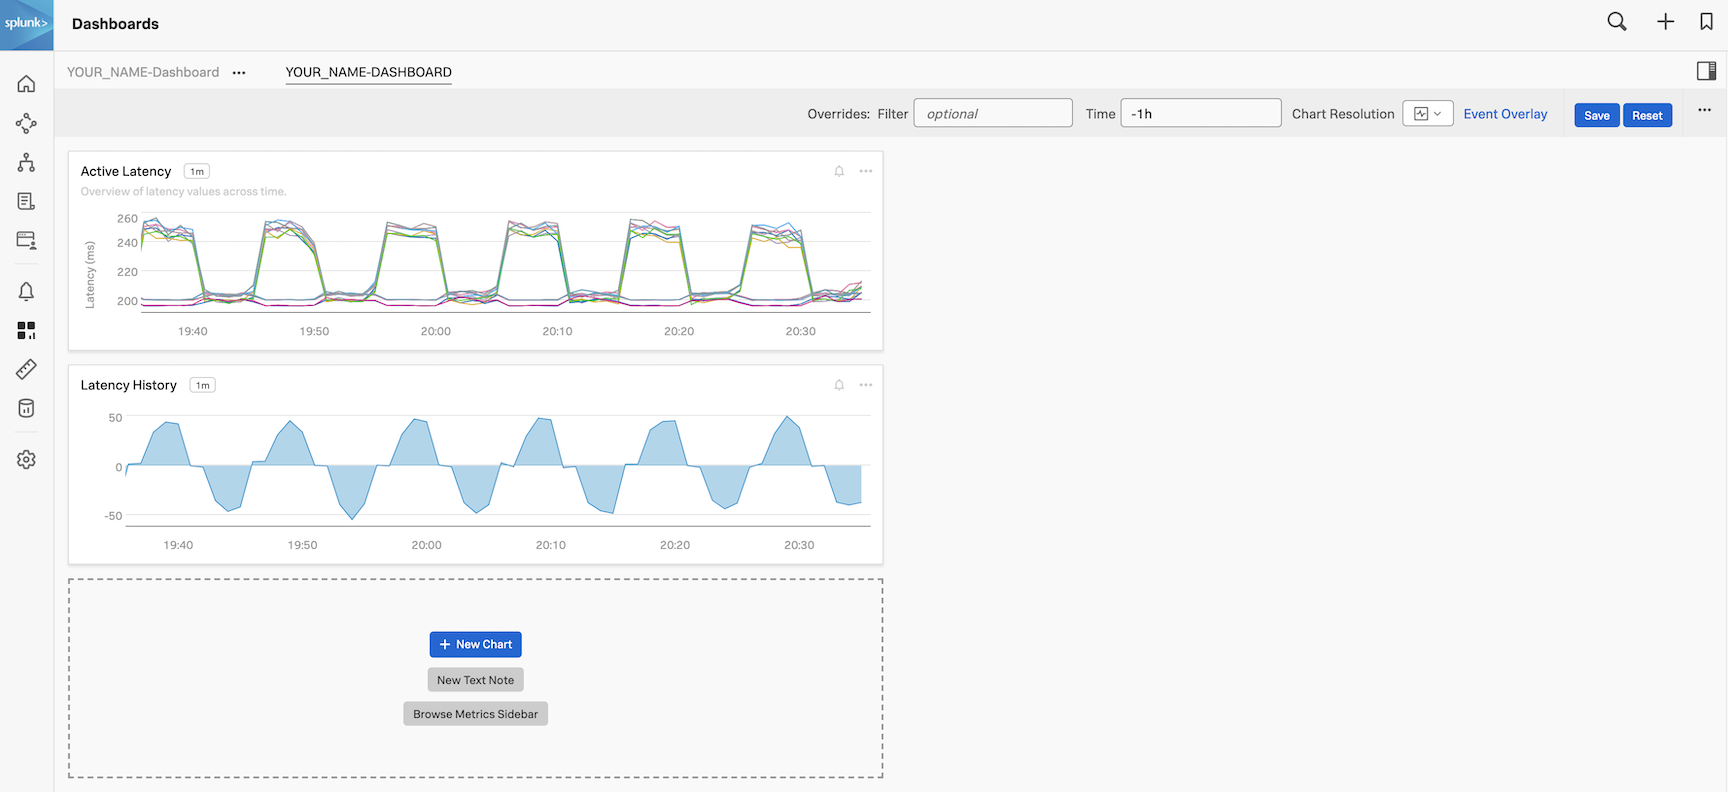 Now let’s quickly add another Chart based on the previous one.
2. Copy and Paste a chart
Click on the three dots ... on the Latency History chart in your dashboard and then on Copy.
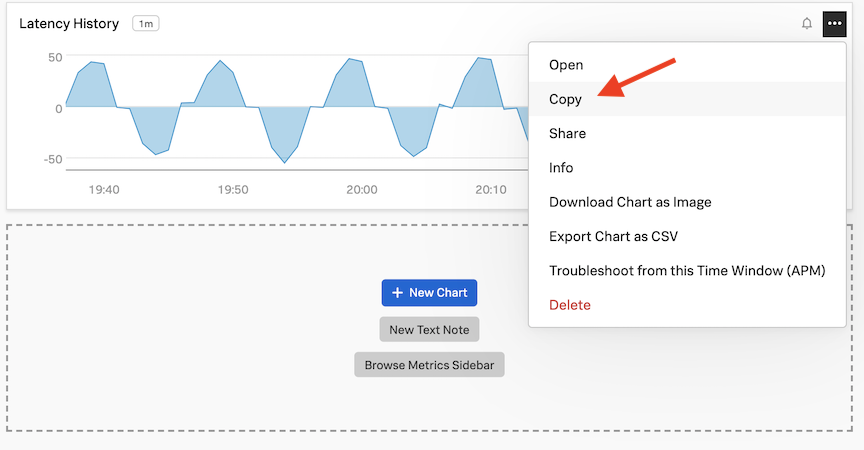
You see the chart being copied, and you should now have a red circle with a white 1 next to the + on the top left of the page.
Click on the plus icon the top of the page, and then in the menu on Paste Charts (There should also be a red dot with a 1 visible at the end of the line).
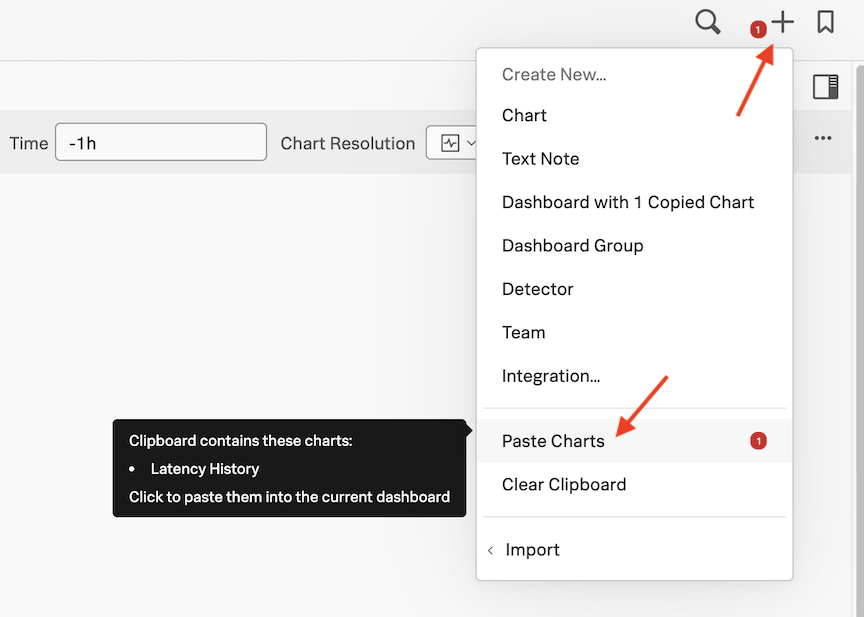
This will place a copy of the previous chart in your dashboard.
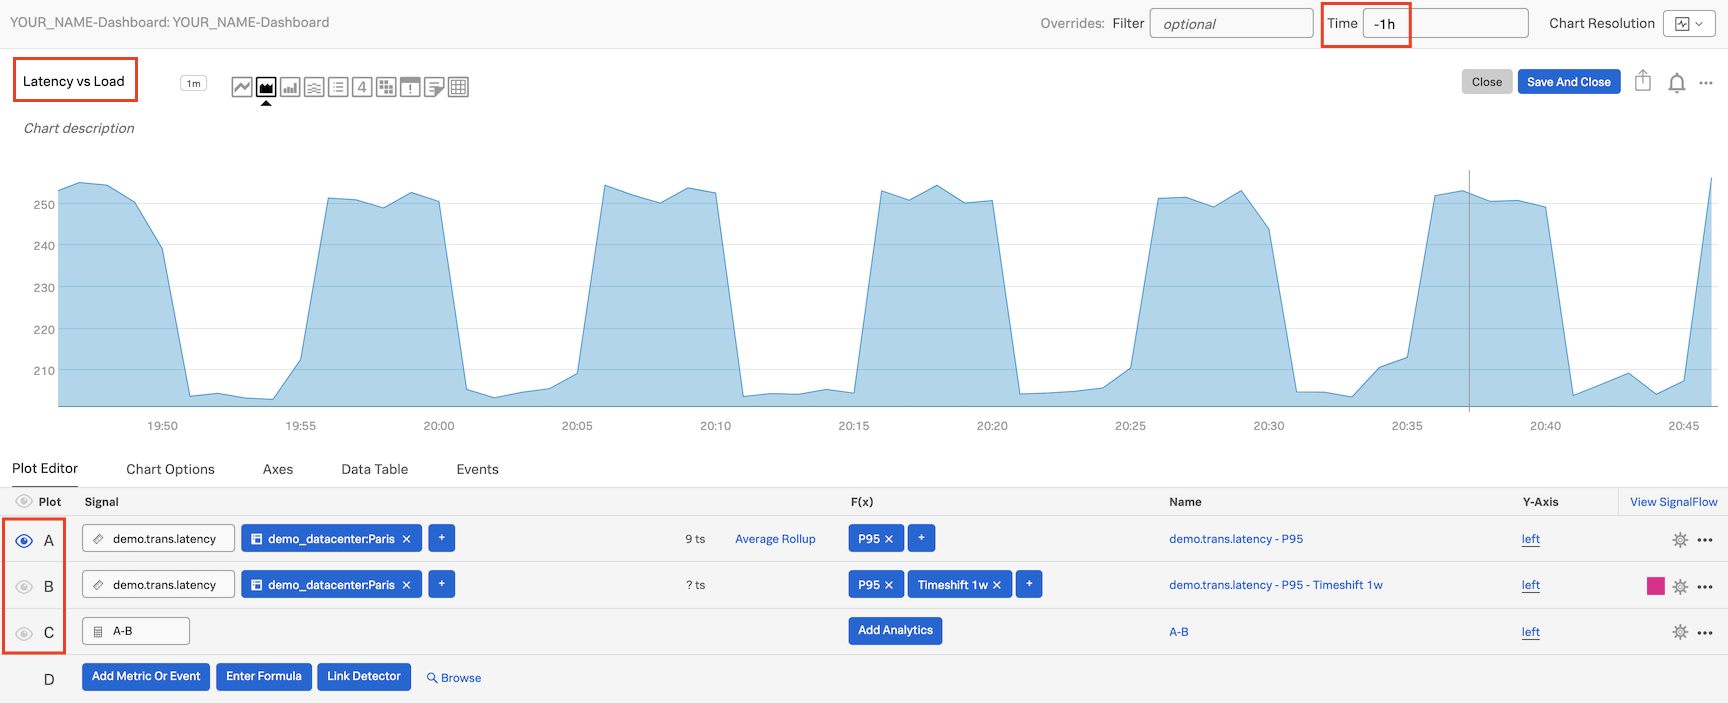
3. Edit the pasted chart
Click on the three dots ... on one of the Latency History charts in your dashboard and then on Open (or you can click on the name of the chart which here is Latency History).
This will bring you to the editor environment again.
First set the time for the chart to -1 hour in the Time box at the top right of the chart. Then to make this a different chart, click on the eye icon in front of signal “A” to make it visible again, and then hide signal “C” via the eye icon and change the name for Latency history to Latency vs Load.
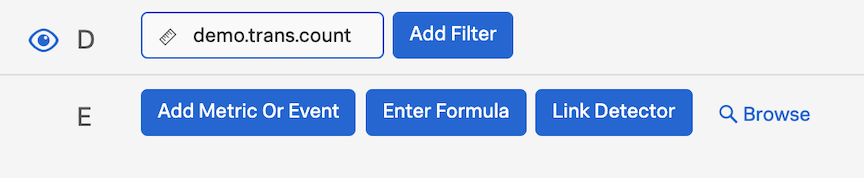
Click on the Add Metric Or Event button. This will bring up the box for a new signal. Type and select demo.trans.count for Signal D.
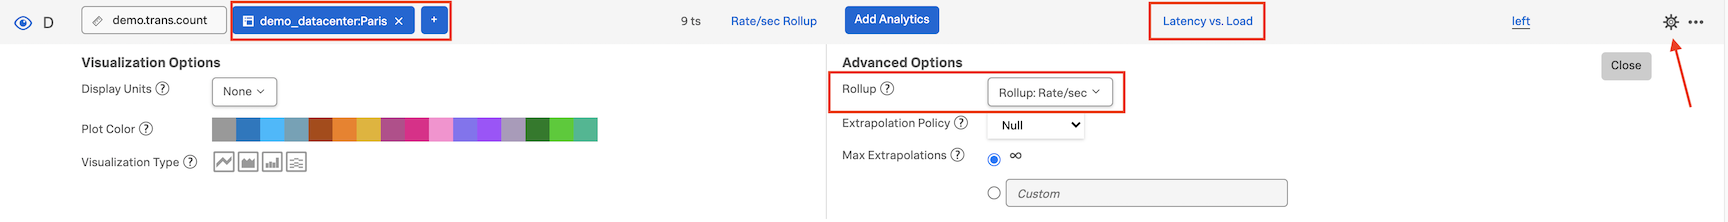
This will add a new Signal D to your chart, It shows the number of active requests. Add the filter for the demo_datacenter:Paris, then change the Rollup type by clicking on the Configure Plot button and changing the roll-up from Auto (Delta) to Rate/sec. Change the name from demo.trans.count to Latency vs Load.
Finally press the Save And Close button. This returns you to your dashboard that now has three different charts!
Let’s add an “instruction” note and arrange the charts!